Comparison of Total Phenolic Content and Total Antioxidant Activity in Local Red Wines Determined by Spectrophotometric Methods ()
1. Introduction
Antioxidants are substances that, at low concentrations, prevent or retard the oxidation of easily oxidisable biomolecules such as lipids, proteins or DNA. They counteract free radicals and thus prevent oxidative damage [1] [2] . There are two basic categories of antioxidants, namely, synthetic and natural. The interest of natural antioxidants has increased in recent years because of their presumed safety and potantial nutritional and therapeutical effects [3] . Epidemiological studies indicated that a higher level of natural antioxidants (vitamins, carotenoids, phenolics) in human everyday diet can protect against cardiovascular diseases, cataract, cancer and aging-related disorders [4] . Among natural antioxidants, red wine has attracted particular interest due to a high content of biologically active compounds [3] . Phenolic compounds are one of the most important quality parameters of wines, and they contribute to organoleptic characteristics such as color, astringency, and bitterness [5] . These compounds are also active in biochemical processes and have nutraceutical effects on human health, including antimicrobial, anticarcinogenic, and antioxidant properties [6] . Consequently, numerous papers have focused on the determination of antioxidant capacities of wines and correlation with their polyphenol content [5] -[12] .
Several in vitro methods have been developed to measure antioxidant capacities of food, beverages and biological samples. The most commonly used antioxidant capacity assays were 1,1-diphenyl-2-picrylhydrazyl radical (DPPH∙) assay [13] , 2,2-azino-di-(3-ethylbenzothialozine-sulphonic acid) (ABTS) assay [14] , ferric ion reducing antioxidant power (FRAP) assay [15] [16] , cupric ion reducing capability (CUPRAC) assay [17] and oxygen radical absorbance capacity (ORAC) assay [18] [19] . These methods differ from each other in terms of their assay principles and reaction conditions. Single assay will not accurately reflect all antioxidants. Therefore it is recommended that at least two or all of these assays be combined to provide a full profile of antioxidant capacity of foodstuff [20] .
The main objective of this study was to determine the polyphenolic content and antioxidant capacity of local wine samples and to compare the antioxidant capacity of these samples applying four most widely used spectrophotometric methods: DPPH, ABTS, FRAP, CUPRAC and to estimate correlation of antioxidant capacities with total phenolics.
2. Material and Methods
2.1. Wine Samples
8 red wine samples were purchased from local stores in Elazığ and Malatya (Table 1). Samples were opened, protected against sunlight and stored at 4˚C. Analyses were carried out within a few days. Each wine was analyzed 5 times.
2.2. Chemicals
Gallic acid, Folin-Ciocalteu reagent, 2,2-diphenyl-1-picrylhydrazyl radical (DPPH) and 2,2’-azino-bis (3-ethylbenzothiazoline-6-sulphonic acid)diammonium salt (ABTS) were purchased from Sigma-Aldrich. Trolox (6- hydroxy-2,5,7,8-tetramethylchromane-2-carboxylic acid) and 2,4,6-tris(2-pyridyl)-s-triazine (TPTZ) were purchased from Fluka. Copper(II)chloride, iron(III)chloride, potassium peroxodisulfate, sodium acetate, ammonium acetate, sodium carbonate were obtained from Merck. 2,9-dimethyl-1,10-phenanthroline was from Acros Organics. All solvents and reagents that are used in this study were HPLC or of analytical grade.
2.3. Equipment
Absorbance measurements were performed on a UV mini 1240 UV-Visible spectrophotometer (Shimadzu, Japan).
2.4. Determination of Total Phenolic Content
Spectrophotometric determination of the TPC was carried out with Folin-Ciocalteu method as adapted for wine analysis [21] using gallic acid as the standard. This method is based on the reduction of a phosphotungstenphophomolybdate complex by phenolics to blue reaction products. For the preparation of calibration curve, 0.1 mL aliquots of 50, 100, 150, 200, 250 and 300 mg/L aqueous gallic acid solutions or 0.1 mL 20-fold dilution samples of red wines (diluted with 13% (v, v) ethanol) were introduced into a test tube and then 2 mL of 2% sodium carbonate was added. After incubation for 2 min, 0.1 mL of Folin-Ciocalteu’s reagent (diluted with water 1:1, v/v) was added. After a further 30 min the absorbance was measured at 750 nm using a spectrophotometer. Results were expressed as mg gallic acid equivalents per litre of wine (mg GAE/L).
2.5. ABTS•+ Radical-Scavenging Assay
ABTS assay was based on a previously published method with some modifications [14] , using Trolox (6-hydroxy-2,5,7,8-tetramethyl-chromane-2-carboxylic acid), a water-soluble analog of vitamin E as standard. ABTS•+ radical cation was produced by mixing 7 mM ABTS solution and 2.46 mM potassium persulfate aqueous solution. This stock solution was kept in the dark at room temperature for 12 - 16 h for incubation. The ABTS•+ solution was then diluted with ethanol (approximately 1:90, v/v) to obtain an an absorbance of 0.7 ± 0.02 at 734 nm. After 100 µL diluted sample or Trolox standard solution was added to 2.4 mL ABTS•+ solution, absorbance was measured at exactly 6 min. Results were expressed as Trolox-equivalent antioxidant capacity (TEAC) values (mM). The standard curve was linear between 0 - 500 µM Trolox.
2.6. Ferric Reducing Antioxidant Power (FRAP)
The FRAP assay was performed according to previously described method with some modifications [15] . The FRAP reagent was prepared freshly. The stock solution included 25 mL acetate buffer (300 mM, pH 3.6), 2.5 mL 10 mM TPTZ (2,4,6-tripyridyl-s-triazine) solution in 40 mM HCl and 2.5 ml of 20 mM FeCl3∙6H2O. The mixture was warmed at 37˚C before using. 150 µL diluted sample or Trolox standard solution was added to 2.85 mL FRAP solution. The absorbance was measured at 593 nm after 30 min. Aqueous solutions of Trolox concentration were between 0 and 300 µM for calibration.
2.7. 1,1-Diphenyl-2-Picrylhydrazyl Radical (DPPH∙) Assay
6 × 10⁻⁵ mol/L of DPPH radical reagent was prepared in ethanol. 100 µL of diluted wine or Trolox standard solutions were mixed with 2.9 mL DPPH radical solution [22] and after 30 min, the absorbances were measured at 515 nm against ethanol. The standard curve was linear between 100 - 1000 µM Trolox.
2.8. Cupric Reducing Antioxidant Capacity (CUPRAC)
Cupric reducing antioxidant capacity assay was carried out according to the method of Apak et al. [17] . 1 mL each of 10 mmM Cu(II), 7.5 mM neocuprine, 1 M ammonium acetate buffer (pH 7) solutions and 0.6 mL water were mixed in a test tube. 0.5 mL of diluted wine or Trolox standard solutions were added to the initial mixture. The absorbance was measured at 450 nm after 30 minutes. Trolox standard solutions were prepared at a concentration range from 40 to 400 µM.
2.9. Statistical Analysis
Data is expressed as means ± SD of five paralel measurements. Correlation analysis was performed by Spearman rho coefficient. p < 0.01 was regarded as statistically significant.
3. Results and Discussion
3.1. Total Phenolic Content and Total Antioxidant Capacity
The total phenolic content (TPC) and total antioxidant capacity content (TAC) of the local wine samples are presented in Table2
TAC was measured by four different assays DPPH, ABTS, FRAP and CUPRAC using mmol Trolox equivalents per litre of wine (mmol TE/L) to express the results. The TPC of the wine samples were expressed mg of gallic acid equivalents per liter of wine (mg GAE/L).
TPC values of local wines ranged from 2599.90 to 4846.57 mg GAE/L. The total phenolic contents determined by the Folin-Ciocalteu method for wines from other countries are as follow: M. S. Fernandez-Pachon et al. 1313 - 2389 mg GAE/L for Spanish red wines [23] . Kallithraka et al. reported values of 621.7 - 3200.3 mg GAE/L for Greek red wines [24] . D. Di Majo et al. reported values of 2.34 - 3.73 g/L for Sicilian red wines [25] . Minussi et al. reported values of 3314 - 4177 mg GAE/L for Italian red wines [26] . Paixao et al. reported values of 1724 - 1936 mg GAE/L for Portuguese red wines [5] . Stasko et al. reported values of 1460 - 3380 mg GAE/L for Austrian and Slovakian red wines [8] . Seruga et al. reported values of 1012 - 3264 mg GAE/L for Crotian red wines [6] . Lucena et al. reported values of 3.2 - 5.9 g GAE/l for Brazilian red wines [10] . H. Li et al. reported values of 1402 - 3130 mg GAE/L for selected China red wines [9] . Dugo et al. reported values of 1794 - 4614 mg GAE/L for Sicilian red wines [27] . Stratil et al. reported values of 963 - 2262 mg GAE/L for Czech Republic red wines [12] . Jordao et al. reported values of 1788 - 3070 mg GAE/L for Portuguese sparkling red wines [28] . Vrcek et al. reported values of 554 - 2669 mg GAE/L for Crotian red wines [11] . Yoo et al. reported values of 1181 - 3589 mg GAE/L for Australian red wines [29] . Jiang et al. reported values of 860 - 2710 mg GAE/L for selected China red wines [30] . Radovanovic et al. reported values of 1602 - 1968 mg GAE/L for selected Serbian red wines [31] . Porgalı et al. reported values of 1837 - 3467 mg GAE/L for Turkish red wines [32] (Table 3).
Such large differences in total phenolic content between the investigated red wines from different countries are likely to result from grape varieties, vineyard location, climate, soil type, different wine processing techniques and ageing.
TAC values of local wines by DPPH, ABTS, FRAP and CUPRAC assay ranged from 7.49 - 15.93 mmol TE/L, 12.02 - 24.73 mmol TE/L, 12.65 - 27.68 mmol TE/L and 13.19 - 31.07 mmol TE/L, respectively (Figure 1).
The total antioxidant capacity determined by the DPPH and ABTS assay for wines from other countries are as follows: De Beer et al. reported values of 13.18 - 15.76 mmol TE/L by ABTS assay and 9.51 - 12.39 mmol TE/L by DPPH assay for South African red wines [33] . Fernandez-Pachon et al. reported values of 3.06 - 11.15 mmol TE/L by ABTS assay and 4.65 - 17.41 mmol TE/L by DPPH assay for Spanish red wines [23] . Nixdorf et al. reported values of 2.6 - 6.3 mmol TE/L by DPPH assay for Brazilian red wines [22] . Stasko et al. reported values of 13.22 - 17.74 mmol TE/L DPPH assay and 7.84 - 13.59 mmol TE/L by ABTS assay for Austrian and Slovakian red wines [8] . H. Li et al. reported values of 4.19 - 17.17 mmol TE/L by DPPH assay, 9.10 - 30.51 mmol TE/L by ABTS assay and 16.11 - 31.93 mmol TE/L by CUPRAC for selected China red wines [9] . Feliciano et al. reported values of 8.10 - 17.91 mmol TE/L by FRAP assay for Portuguese wines from the Setubal Region [34] . Crotian red wines, Seruga et al. reported values of 9.2 - 37.8 mmol TE/L by DPPH assay and 7.9 - 24.2 mmol TE/L by ABTS assay for Crotian red wines [6] . Stratil et al. reported values of 2.91 - 8.62 mmol TE/L by DPPH assay, 13.89 - 34.69 mmol TE/L by ABTS assay and 4.92 - 13.94 mmol TE/L by FRAP assay [12] . Vrcek et al. reported values of 4.94 - 20.64 mmol TE/L by DPPH assay and 2.87 - 11.7 by ABTS assay [11] . Jordao et al. reported values 25.60 - 37.42 mmol TE/L by ABTS assay [28] . Yoo et al. reported values of 8.51 - 18.85 mmol TE/L by DPPH assay for Australian red wines [29] . Jiang et al. reported values of 3.86 - 6.18 mmol TE/L by DPPH assay and 9.19 - 19.63 mmol TE/L by CUPRAC assay for selected China red wines [30] . Radovanovic et al. reported values of 3.64 - 8.06 mmol TE/L by DPPH assay for China Serbian red wines (Radovanovic et al., 2012). Xi et al. reported values of 4.73 - 31.05 mmol TE/L by DPPH assay and 7.71 - 44.78 mmol TE/L by ABTS assay for China red wines from Yan73 [35] (Table 4).
Different authors have reported very different Trolox equivalents values. This is expected since experimental conditions of DPPH, ABTS, FRAP and CUPRAC methods were different from each other in many details. Significant differences in antioxidant activity existed not only experimental conditions but also variety of red wines due to different origins and winemaking procedures.
3.2. Correlation between Antioxidant Capacity and Total Polyphenols
Correlation analysis was used to explore the relationships amongst the different antioxidant parameters measured for all wine samples (Table 5). The total phenolic contents of red wine samples exhibited a good correlation (p < 0.01) with antioxidant properties. Amongst the methods the strong correlation between DPPH and Folin

Table 2 . Total antioxidant capacity and total phenolic content of wine samples.
Data are expressed as mean values ± SD (n = 5).
Table 3. Comparison of present study and published values of total phenolic content in red wines (mg gallic acid equivalents/L).
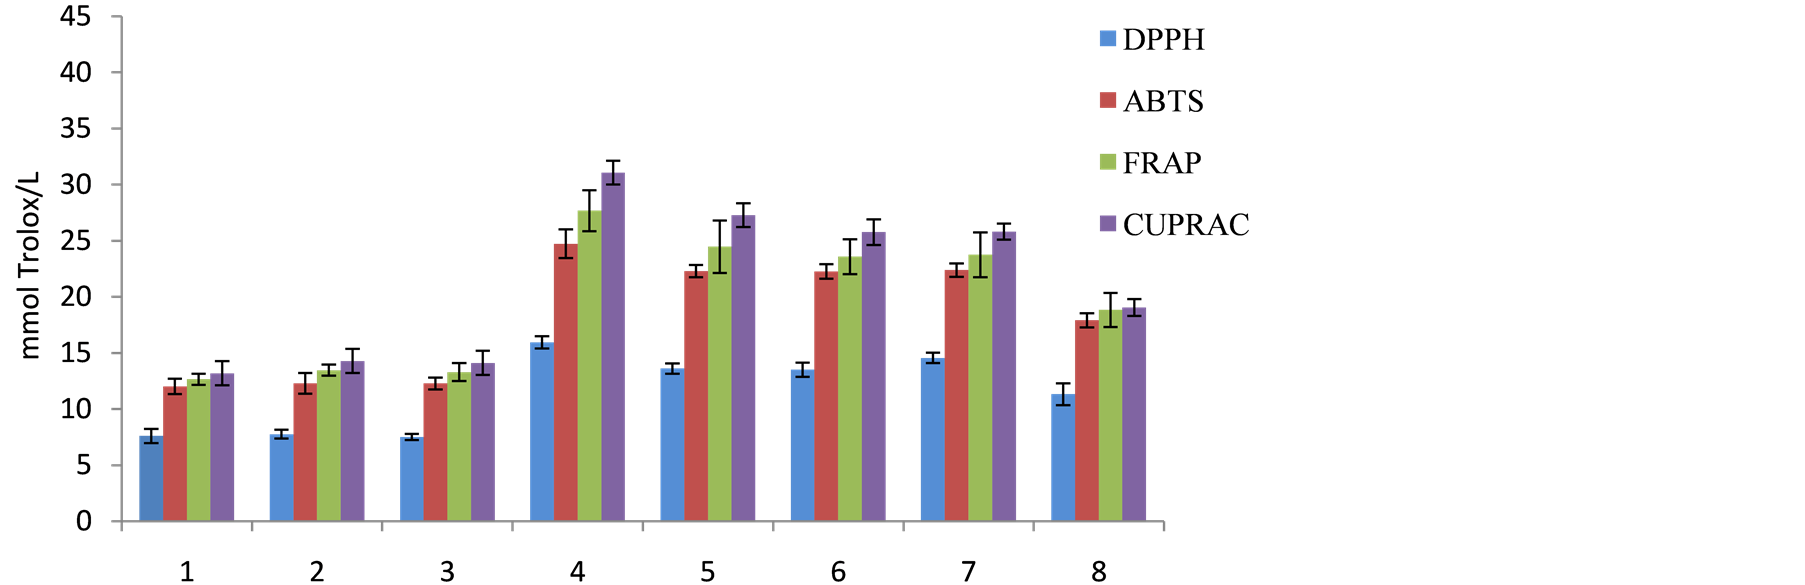
Figure 1. Total antioxidant activity determined by DPPH, ABTS, FRAP and CUPRAC methods (mmol TE/L).
Table 4. Comparison of present study and published values of TAC by DPPH, ABTS, FRAP and CUPRAC assay in wines (mmol TE/L).
Table 5. Spearman rho correlation coefficients (R) among the different methods.
**Correlation is significant at the 0.01 level (2-tailed).
lin method was 0.864; CUPRAC and Folin method was 0.848. Amongst the methods used for quantifying antioxidant activities, the correlation between FRAP and CUPRAC; FRAP and ABTS were 0.886 and 0.870, respectively.
These results are in agreement with other reports in the literature [5] [6] [8] -[12] [30] [32] .
4. Conclusions
Since the above methods differ from each other in terms of assay principles and reaction conditions, one single method is not enough to show all the antioxidants. Therefore this study compared four most widely used spectrophotometric methods. A good correlation between the antioxidant activities determined by DPPH, ABTS, FRAP and CUPRAC methods versus total phenol content (Folin Method) was observed for the red wines in this study. It has been suggested that the antioxidant capacity of wine is strongly correlated to the type of phenolic compounds present in wines. This points out the predominant role of phenols in antioxidant activity.
Declarations of Interest
Financial support from İnönü University Scientific Projects Research Unit (Project No. 2011/189) is acknowledged.