Glycemic Index of a Diabetes-Specific Nutritional Powder: An Open-Label Study in Healthy Indian Adults ()
1. Introduction
Over the last few decades, the prevalence of diabetes has seen a marked increase in India, where, type 2 diabetes (T2DM) has been most prevalent with 74.2 million diagnosed cases in 2021 [1] . This upsurge is primarily due to rapid urbanization, a sedentary lifestyle, and unhealthy food habits leading to obesity among younger individuals [2] [3] . Furthermore, with the burden associated with undiagnosed cases (39.4 million), there’s a risk of micro- and macro-vascular complications which demands immediate addressal of the situation to prevent a further rise in the disease burden of the country.
Management practices for patients with T2DM include lifestyle modifications that involve following a balanced diet before initiating pharmacotherapy [4] . However, managing T2DM with diet is challenging, as only 5% to 6% of patients are aware of the importance of diet in managing their condition [5] . This challenge is further compounded by the lack of physician training in nutritional interventions, thus, furthering the barrier to effective counselling of such patients [6] [7] . Moreover, patient access to registered dietitians/nutritionists/educators who could effectively guide dietary modifications for managing T2DM remains inadequate [8] [9] [10] . So, adequate dietary information and its importance in managing T2DM needs to be integrated into the diabetes care management guidelines.
The current dietary guidelines for managing diabetes have evolved over the past few years [11] - [19] . However, in India, such comprehensive guidelines do not exist. It is well established that dietary components have a clinically significant impact on the modulation of blood glucose levels [20] . A diet balanced in carbohydrates, proteins, fats (low), micronutrients, vitamins, and minerals has been demonstrated to reduce excess body weight, thus, in turn, reducing the risk of developing T2DM [4] [16] [21] . The Glycemic index (GI) is used as a measure of carbohydrate quality and is recognized as a valid methodology for classifying carbohydrate foods according to their postprandial glycemic response [22] . Foods or dietary patterns with a low GI, help achieve effective control over blood glucose and reduce body weight. This is so because, such foods break down slowly and are absorbed gradually into the bloodstream, and hence have the potential to effectively control blood glucose levels [23] . A systematic review and meta-analysis of 54 randomized controlled studies in children or adults with impaired glucose tolerance, type 1 or 2 diabetes that demonstrated that low GI diets are beneficial over other diet types by reducing glycated haemoglobin (HbA1c), fasting blood glucose, body mass index (BMI), and blood lipids [24] . Another study that determined the long-term effects of changing the source and quantity of dietary carbohydrates on postprandial glucose in subjects with impaired glucose tolerance demonstrated that a low GI diet reduced the postprandial plasma glucose levels by 21% [25] . Similarly, a low-GI and low-fibre-rich cereal diet showed a significant difference in the absolute decrease in HbA1c level relative to the fibre-rich cereal diet group (−0.5% vs. −0.18%) [26] . On the contrary, diets rich in carbohydrates have been linked to obesity, hyperinsulinemia, and insulin resistance, leading to an increased risk of T2DM [27] [28] . In India, food habits generally focus on refined carbohydrates and fat intake, with less consumption of cereals, fruits, and vegetables [29] [30] . Therefore, to effectively manage patients with T2DM in India, there is not only a need to focus on healthy dietary choices (foods with low GI, optimal consumer awareness and education) [31] , but also integrate such guidance into the T2DM management plans. Studies on the effectiveness and impact of DSN on critically ill patients, hospitalized patients and T2DM patients are available in literature [32] [33] [34] [35] . Studies comparing the GI of DSN are rare in healthy subjects. Furthermore, data on the effect of nutrition with a low GI diet profile in an Indian setting remains limited. To our knowledge, there has been no study comparing the GI of DSNs with different flavors, against an active comparator during the study period. Hence, in this study, we determined the GI of our diabetes-specific nutritional (DSN) powders (Prohance D) with two different flavors (chocolate and vanilla) against an active comparator nutritional powder Glucerna SR, in healthy Indian adults in fasting conditions.
2. Methods
2.1. Study Design
The study was an open-label, single-dose, non-comparative study in healthy adults conducted at a clinical trial facility in India. The overall study duration was 39 days (February-March 2016) (Figure 1).
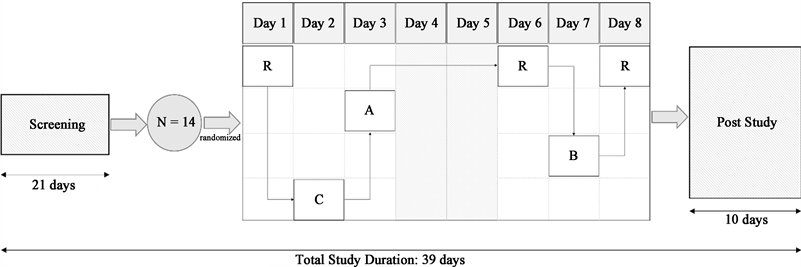
A, Treatment A (Diabetic Care Powder Chocolate Flavor 108 g); B, Treatment B (Diabetic Care Powder Vanilla Flavor 108 g); C, Treatment C (Glucerna SR Vanilla Flavored Powder 97 g); N, sample size; R, Reference product (Risidex/Dextrose monohydrate 55 g).
Figure 1. Study design flow chart.
The study was conducted in accordance with the Declaration of Helsinki and conformed to the local regulatory guidelines, Good Clinical Practice guidelines, and recommendations by the ISO 26642:2010 (E) [36] . Informed consent was obtained from all subjects prior to study entry. The study was reviewed and approved by the Institutional Ethics Committee of the participating site.
2.2. Study Population
Healthy adults aged between 18 to 45 years were included in the study if their body weight was at least 50 kg, BMI ranged between 18.5 to 25.0 Kg/m2 (for males) or 17.0 to 25.0 Kg/m2 (for females), had no evidence of any underlying disease during screening and whose physical examination was performed within 21 days before study initiation. The subjects should have had acceptable pre-study laboratory parameters, provided consent on their availability during the study and adhered to the protocol requirements of the trial. Females of childbearing potential had to follow an acceptable method of birth control for the study duration as suggested by the investigator.
Subjects were excluded from the study if they had a history of clinically significant disease in the last 12 months, allergy or significant history of hypersensitivity or idiosyncratic reactions or intolerance to any food or excipients. Patients who had positive outcomes in breath alcohol and/or urine drug screening test and had medical conditions that may jeopardize their health or confound the study results were also excluded from the study. A detailed list of additional exclusion criteria is provided in Supplementary Table S1.
2.3. Study Procedure, Treatment, and Administration
Post-screening, subjects were kept at the study facility for at least 12 hours prior to dosing on Day 1 and until 3 hours after dosing on Day 8. Lunch, snacks, and dinner were provided at 4-, 8-, and 12-hour post-dosing respectively, on all treatment days except on Day 8. On Days 4 and 5, no treatment was administered, and all 3 meals were provided at appropriate intervals. Water intake was prohibited for an hour before dosing until 2 hours post-dose and was allowed ad libitum 2 hours post-dose. Only standardized meals were allowed during the confinement period.
The study investigated the effect of 4 different nutritional supplements in healthy subjects under fasting conditions. On each dosing day (from Day 1 to Day 8), all subjects received a randomized treatment after a supervised overnight fast for at least 10 hours. This included 1 serving of the reference dextrose monohydrate (Risidex; Treatment R) with 250 mL of water on Days 1, 6, and 8, the comparator DSN powder (Glucerna SR powder; Treatment C) with 373 mL of water on Day 2; 2 flavors of investigating DSN powder (Prohance D) in chocolate and vanilla flavor (Treatment A and B, respectively) with 378 mL of water each on Day 3 and Day 7 respectively after reconstitution. No treatment was administered on Days 4 and 5 for the subject’s convenience. The washout period between consecutive dosing was at least 24 hours. Subjects were instructed to swallow the entire content of administered dose within 12 minutes. Treatment compliance was assessed through an examination of the oral cavity by a physician.
The 2 investigational DSN powders (Treatments A and B) were developed by Sun Pharmaceutical Industries Limited, Mumbai, India, [37] the comparator DSN powder (Treatment C) was developed by Abbott Healthcare Private Limited, India [38] and the reference food formulation (Treatment R) was developed by Roquette Riddhi Siddhi Private Limited, India. The nutritional information of the test (Treatment A and B) and comparator (Treatment C) products are presented in Table 1, and a detailed list of ingredients is presented in Supplementary Table S2.
![]()
Table 1. Nutritional information of Treatments A, B and C.
*Available Carbohydrate was calculated as (Total Carbohydrate − Dietary Fiber − FOS); g: grams; kcal: kilo calories; µg: microgram; mg: milligram; µgRE: microgram retinol equivalent; mgTE: milligram equivalent of d-tocopherol.
2.4. Blood Sampling
A total of ~24 mL of blood was collected from each subject. Of this, 10 mL was collected during screening to perform the routine haematology, biochemistry, and serological assays; 4 mL for pre-study laboratory investigations, ~4.8 mL (including ~2.4 mL discarded blood) for capillary blood glucose evaluation and 5 mL for post-study evaluation. On each dosing day, 8 blood samples were collected including the pre-dose blood samples using the finger prick method. An approximate volume of 0.05 mL blood was collected 5 minutes and 0 minutes before dosing followed by 15-, 30-, 45-, 60-, 90- and 120-minute post-dose.
2.5. Endpoints
The primary endpoint was the mean GI of Treatments A, B, and C in healthy adult subjects under fasting conditions for up to 120 minutes post-dosing. The secondary endpoint was the assessment of safety for all administered treatments in terms of reported adverse events (AEs) and serious adverse events (SAEs).
2.6. Assessments
Capillary blood glucose concentration was expressed as mmol/L using conversion factor 1 mg/dL = 0.0555 mmol/L. The mean GI of each treatment (IG,t) was generated using the incremental area under the curve (AUCi) method and was considered low if IG,t was ≤55, medium if IG,t ranged between 56 to 70, and high if IG,t was >70.
Safety was assessed by the investigator throughout the study. AEs were classified as mild, (defined as a transient event that did not interfere with daily activities); moderate (defined as an event that alleviated with simple therapeutic intervention, and which interfered with normal activities); or severe (defined as an event that required therapeutic intervention, and which interrupted daily activities). The relationship of AEs to the treatments was classified based on the causality assessment.
2.7. Statistical Analysis
A sample size of 14 healthy adults were deemed appropriate to achieve the study’s primary objective as it met the standards of the ISO 26642:2010 food products recommendation to determine GI [36] . The analysis included capillary blood glucose data from subjects who received all the 3 doses of Treatment R and at least 1 dose of the study treatment.
All individual blood glucose concentration data along with the descriptive statistics (such as N, mean, standard error [SE], standard deviation [SD], minimum, and maximum) was presented for each subject. The AUCi of the blood glucose response curve was plotted as the blood glucose values vs. time for all subjects. Clinical and vital parameters were summarized and reported descriptively.
In each subject, the IG,t (%) of treatments A, B and C were calculated by dividing the AUCi of the respective treatment by the average AUCi of Treatment R and multiplying by 100.
The GI of the treatment was calculated using the formulae:
where:
At was the AUCi of the Treatments A, B, C.
Aref was the mean AUCi of Treatment R of 3 days when Treatment R was administered.
The final GI of each treatment was expressed as
where:
was the mean GI value of subjects who completed the study.
was the standard error of the mean.
All assessments were performed on the per-protocol (PP) population which included all enrolled subjects who completed the study as per the protocol without any major protocol deviations or violations. Safety was assessed throughout the study period and the safety population included all enrolled subjects who received the test treatments.
All analyses were performed using statistical analysis software version 9.2 or higher.
3. Results
3.1. Demographics
A total of 14 healthy adult males were screened and enrolled in the study. The mean ± SD age of the subjects was 29.42 ± 4.46 years (range: 23 to 37 years), mean ± SD body weight was 61.06 ± 6.45 kg (range: 51.94 to 69.77 kg), and mean ± SD BMI was 22.0 ± 1.95 kg/m2 (range: 18.8 to 24.9 kg/m2). The baseline and demographic characteristics of all subjects were comparable. The demographic data is provided in Supplementary Table S3. The clinical and laboratory parameters were normal and were comparable among all subjects (Supplementary Tables S4-S6). No subject discontinued the study.
3.2. Capillary Blood Glucose Concentrations and Glycemic Index
The peak mean capillary blood glucose concentration for Treatment A and B reached a value of 6.1010 mmol/L and 6.4498 mmol/L, respectively, at 45 minutes post-dose, while for Treatment C, it peaked at a value of 5.9214 mmol/L at 60 minutes post-dose. Alternatively, for Treatment R, it was 8.4994 mmol/L on Day 1, 9.1932 mmol/L on Day 6 and 9.8354 mmol/L on Day 8, 45 minutes post-dosing, respectively. The detailed results are provided in Supplementary Tables S7-S12.
The mean ± SE GI of Treatment A was 33 ± 3, Treatment B was 35 ± 3 and Treatment C was 29 ± 5 respectively, Supplementary Table S13. All GI means were ≤55 and were considered low as per the ISO reference standard. The mean AUCi for all treatments and the reference is shown in Table 2.
![]()
Table 2. Incremental AUC (mmol min/L).
*Sample was not collected as the subject experienced vomiting after receiving Treatment C. AUC: Area under the curve; SE: Standard Error; Treatment A: Diabetic Care Powder 108 g (Chocolate flavor); Treatment B: Diabetic Care Powder 108 g (Vanilla flavor); Treatment C: Glucerna SR Powder 97 g (Vanilla flavor); Treatment R: Risidex (Dextrosemonohydrate) 55 g.
The mean AUC was lower for Treatments A, B, and C than Treatment R indicating less glycemic incursion in low GI products (Figure 2).
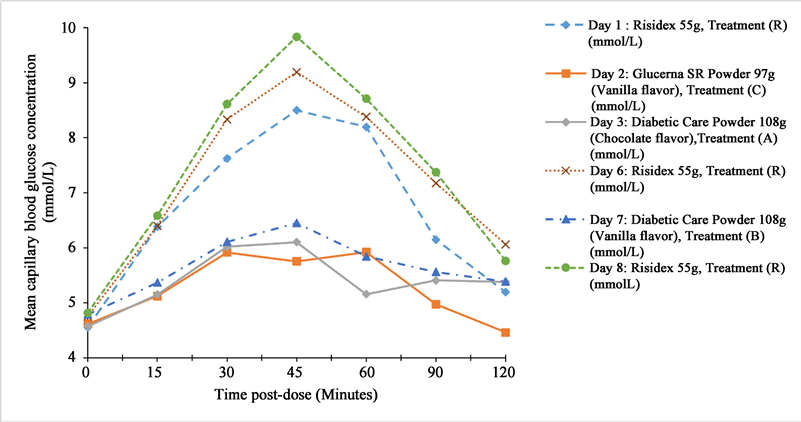
A, Treatment A (Diabetic Care Powder Chocolate Flavor 108 g); B, Treatment B (Diabetic Care Powder Vanilla Flavor 108 g); C, Treatment C (Glucerna SR Vanilla Flavored Powder 97 g); Treatment R, reference product (Risidex/Dextrose monohydrate 55 g).
Figure 2. Mean blood glucose concentration vs. time curve.
3.3. Safety
AEs were reported in 2 (14.3%) subjects. On Day 2, 1 subject vomited 20 minutes post-dose (Treatment C) and the event resolved in 48 minutes. High alanine aminotransferase and aspartate aminotransferase values were reported in the other subject beyond the follow-up period on Day 8 (Treatment R). The event was followed up and resolved within 9 days post the last dose. Both AEs were mild in intensity and considered unlikely by the investigator to be related to the treatments. No SAEs and deaths were reported in the study.
4. Discussion
Our study demonstrated that the DSN powders, when administered as a breakfast meal under fasting conditions in healthy Indian adults, had low GI. The AUCi of all 3 treatments was low with respect to the reference product, indicating appropriate glucose tolerance. The treatments did not alter the clinical parameters or laboratory profiles of the subjects and were well tolerated with only 2 reports of mild AEs that resolved without intervention. Hence, these findings suggest that the diabetes-specific nutritional powder could be used as a nutritional meal option in pre-diabetics and T2DM patients requiring management of blood glucose and body weight.
Globally, GI has been established as a measure of carbohydrate quality [22] and is classified as low (≤55), intermediate (>55 and <70) or high (≥70) as per the Food and Agriculture Organization and World Health Organization, 1998 [39] . With established evidence of the benefits associated with low GI diets in T2DM patients, considering the GI of food is an important parameter of dietary advice in such patients. Low GI diets have been implicated in the management of HbA1c levels, decrease in lipids and weight loss in obese individuals [40] . Additionally, a low GI diet has also been shown to improve postprandial glucose concentration and insulin in diabetic patients [41] [42] . The International Carbohydrate Quality Consortium (ICQC) recommends a low GI diet in the context of a healthy diet plan [43] . In India, dietary advice from the Indian Council of Medical Research (ICMR) for the management of T2DM recommends diets consisting of carbohydrates (55% - 60%) including cereals, mixed coarse grains, whole pulses, salads and soybeans; proteins (10% - 15%) and fats (20% - 25%) comprising < 7% of saturated fats, monounsaturated and polyunsaturated fatty acids (considered as healthy fats) [44] . The Indian Consensus Group for Prevention of Diabetes specifies a carbohydrate diet which provides 65% of daily energy. It includes 400 g of fruits, vegetables, and legumes, and 400 g of cereals, in conjunction with 25 g of soya bean or mustard or canola oils with moderate physical activity for the effective prevention of T2DM and the associated cardiovascular complications [45] . Although guidelines for dietary standards and management of T2DM exist, patient load, inaccessibility to registered dietitians/educators, and lack of robust education and awareness serve as barriers to the implementation of these strategies [46] . As a result, there is a need to address the existing challenges for uniform understanding and implementation of dietary guidelines for the management of T2DM.
In India, regional dietary variations, and the lack of awareness of the impact of diet on the management of T2DM, combined with a reluctance to adhere to dietary regimens due to sociocultural preferences, remain common [4] . As part of organized primary care facilities in India focusing on the quality of diabetes care, physicians and registered dietitians can counsel and sensitize patients with dietary measures for the prevention and management of T2DM by utilizing a shared decision-making approach [8] . Clinical evidence suggests that sustained counselling on diet management to patients has an impact on HbA1c, triglycerides, and body weight [47] . Medical nutrition therapy is a promising approach that provides evidence-based knowledge to assist clinicians and registered dietitians in customizing appropriate meal plans for diabetics [48] . Likewise, the effectiveness of low GI diets in improving glycemic control or HbA1c is well documented [49] [50] [51] [52] . Thus, as part of balanced meal planning for effective blood glucose control, the DSN powder used in our study with a low GI (<55), which consists of a balanced mix of maltodextrin, isomaltulose, whey protein, soy protein, minerals, and vitamins, could be of potential benefit in Indian patients with T2DM.
In view of increasing prevalence of T2DM world-wide, dietary intake plays crucial role in glucose control. From an intervention study, it was found that taking a low GI multi-nutrient supplement as replacement of breakfast by T2DM patients reduced glycated serum protein, HbA1c, increased their total plasma proteins, and helped maintain their fasting blood glucose (FBG), homeostatic model assessment for insulin resistance (HOMA-IR), blood pressure and body weight [53] . In a meta-analysis low GI/glycemic lead (GL) dietary patterns result in improvement of glycemic control and cardiometabolic risk factors beyond concurrent treatment in adults with Type 1 and 2 diabetes [54] . Thus, it seems that there are measurable health advantages associated with a low GI supplement in individuals with diabetes.
Our study design was aligned with the ISO 26642:2010 food products recommendation to determine GI in at least 10 subjects [36] . The main objective of the study was to determine the GI of diabetes-specific nutritional powder as per ISO 26642:2010E recommendations and thus, further studies are required to understand the effect and impact of this nutritional supplement in managing T2DM.
Our study had some limitations: the sample size of the study was small and limited to male subjects. Furthermore, the long-term effects of the low GI DSN on HbA1c should be assessed in future studies. Hence, the study rationale should be kept in mind while trying to interpret or generalize the study findings to a broader patient population in a real-life scenario.
5. Conclusion
A low GI and a low AUCi were observed for all the products administered in this study compared to the reference. The investigational DSN powders with their low GI could potentially function as diet replacements or supplements to achieve optimal blood glucose levels and body weight control in patients with T2DM who are unable to achieve optimal levels under a normal diet. Future long-term studies in India are needed to add to the growing evidence of the importance of low GI diets in maintaining blood glucose and managing body weight.
Data availability
Any additional declassified datasets generated and/or analyzed during the current study are available from the corresponding author on reasonable request and satisfactory justification.
Author Information
Kirti Patel is a full-time employee of Sun Pharmaceutical Industries Limited and Suyog Mehta, Deepak Bachani and Vinay Kudrigikar are full-time employees of Sun Pharma Laboratories Ltd.
Funding
Sun Pharmaceutical Industries Limited funded this study and the manuscript writing, editing, approval, and decision to publish.
Acknowledgements
The authors thank the participants and the study personnel involved in the study conduct. Support for partial data entry and analysis was provided by ActuReal Services and Consulting Pvt. Ltd. (ActuReal). Manuscript writing, editorial, and submission support for this article were provided by Lakshmi Hariharan and Md. Najeeb Ashraf of SciVoc Consulting Inc. on behalf of ActuReal.
Online Supplementary Material
![]()
Table S2. Summary of product ingredients (Treatments A, B, C and R).
A, Diabetic Care Powder 108 g (Chocolate flavor); B, Diabetic Care Powder 108 g (Vanilla flavor); C, Glucerna SR Powder 97 g (Vanilla flavor); R: Risidex powder.
N: Total number of subject enrolled; all enrolled subjects were male; SD: Standard deviation; CV%: Coefficient of variation.
![]()
Table S4. Summary of vital signs by day and time points.
BP, blood pressure; SD, standard deviation.
BP, blood pressure; SD, standard deviation.
AEBE: Air entry bilaterally equal; N: Total number of subjects in each category; n (%): number (percentage) of subjects in each category; PL: Plantar flexor.
![]()
Table S7. Summary statistics—capillary blood glucose concentration (mmol/L); (Day 1) Risidex (Dextrose monohydrate) 55 g, Treatment R (N = 14).
N: total number of subjects included in the analysis; *Average value of two pre-dose concentrations at −0.083 hr & 0.000 hr; SD: standard deviation; Min: minimum; Max: maximum; CV%: Coefficient of variation.
![]()
Table S8. Summary statistics—capillary blood glucose concentration (mmol/L); (Day 2) Glucerna SR Powder 97 g (Vanilla flavor), Treatment C (N = 13).
N: total number of subjects included in the analysis; *Average value of two pre-dose concentrations at −0.083 hr & 0.000 hr; SD: standard deviation; Min: minimum; Max: maximum; CV%: Coefficient of variation.
![]()
Table S9. Summary statistics—capillary blood glucose concentration (mmol/L); (Day 3) Diabetic Care Powder 108 g (Chocolate flavor), Treatment A (N = 14).
N: total number of subjects included in the analysis; *Average value of two pre-dose concentrations at -0.083 hr & 0.000 hr; SD: standard deviation; Max: maximum; Min: minimum; CV%: Coefficient of variation.
Table S10. Summary statistics—capillary blood glucose concentration (mmol/L); (Day 6) Risidex (Dextrose monohydrate) 55 g, Treatment R (N = 14).
N: total number of subjects included in the analysis; *Average value of two pre-dose concentrations at −0.083 hr & 0.000 hr; SD: standard deviation; Min: minimum; Max: maximum; CV%: Coefficient of variation.
Table S11. Summary statistics—capillary blood glucose concentration (mmol/L); (Day 7) Diabetic Care Powder 108 g (Vanilla flavor), Treatment B (N = 14).
N: total number of subjects included in the analysis; *Average value of two pre-dose concentrations at −0.083 hr & 0.000 hr; SD: standard deviation; Min: minimum; Max: maximum; CV%: Coefficient of variation.
Table S12. Summary statistics—capillary blood glucose concentration (mmol/L); (Day 8) Risidex (Dextrose monohydrate) 55 g, Treatment R (N = 14).
N: total number of subjects included in the analysis; *Average value of two pre-dose concentrations at −0.083 hr & 0.000 hr; SD: standard deviation; Min: minimum; Max: maximum; CV%: Coefficient of variation.
Table S13. Determination of GI as percentage ratio.
*Sample was not collected as subject experienced vomiting after receiving Treatment C. Ratio (%): Dividing the AUCi of either Treatments A, B or C by the average AUCi of Treatment R and multiplying by 100. Note: Average value of three administration of reference treatment (R) is used for ratio calculation. A: Diabetic Care Powder 108 g (Chocolate flavor) B: Diabetic Care Powder 108 g (Vanilla flavor) C: Glucerna SR Powder 97 g (Vanilla flavor); AUC: Area under curve; SE: Standard error.