Plasma Accumulations of Vitamin B6 from an Oral Dose in a New Reversible Model for Mouse Gut Injury and Regeneration ()
1. Introduction
The gut acts as the interface between food and the metabolic events that constitute the nutrition process. A characteristic key of the gut mucosa is rapid cellular turnover by multipotential stem cells present in the intestinal crypts. Such cells are able to proliferate with an ordered cellular migration route from crypts to villi, which includes differentiation and polarization, and finally apical cellular apoptosis and shedding [1,2]. Maintaining a normal epithelial intestine structure requires coordinated developmental and morphogenetic processes involving numerous molecules and regulatory metabolic signals.
Altering these processes leads to changes in gut mucosa which might, in some circumstances, lead to inflammatory bowel disease, often grouped into two categories, Crohn’s disease, and ulcerative colitis [3,4]. Furthermore, situations such as fasting [5], chronic alcohol consumption [6] as well as pathologies such as cancer [7] also lead to significant changes in fine gut morphology and function.
To understand the cellular and molecular events in mucosa derangement and repair that are involved in pathological issues collectively known as inflammatory bowel disease (IBD), many animal models are available [8]. Developed mainly in rodents, such models have been widely used to explore both the mechanisms involved as well as the ameliorating efficacy of inflammation in an effort to provide experimental support for human therapy to support alleged benefits to gut afforded by probiotics, prebiotics and drugs [9-13]. Currently available animal models require either oral or rectal administration of highly aggressive chemical compounds that give rise to the name of the model and have the advantage of triggering a rapid response that resembles the events involved in the pathologies indicated above. The most widely used models include: 1) trinitrobenzene sulfonic acid (TNBS); 2) dextran sulphate sodium (DSS); 3) oxazolone; 4) acetic acid; 5) iodoacetamide; f) metothrexate; 6) 4-chloro-7-nitro-2,1,3-benzoxadiazol (NBD-Cl) [14]. These models have been standardized [15] and used to investigate not only pathologies but also mucosa repair processes, absorption of drugs and dietary components, as well as the effects of prebiotics and probiotics. Nonetheless, it is important to note that said models do not work equally well when using the same substance, microbes, or nutritional preparation. Another model uses a toxin such as ricin that triggers important physiological effects [16]. Ricin intoxication produces severe cardiac, renal, intestinal and lung derangement [17-20], and is in fact considered a lethal bioterrorism weapon [21,22].
Ricin belongs to a family of enzymes known as ribosome-inactivating proteins (RIPs) that are widespread in plants, bacteria, algae and fungi [23,24], and which display anti-pathogen activity against insects [25] and viruses [26]. Ricin targets the rRNA and DNA of both eukaryotic and prokaryotic organisms [27]. RIPs promote specific cleavage of the N-glycoside linkage between A4324 and the phosphor-ribose backbone of 28 S rRNA from rat liver [28]. The intensity of the toxic effects of ricin seems to be dependent on the dose and how it is administered [18]. Plant species of the Sambucucaceae family contain ribotoxic lectins structurally related to ricin although much less toxic [25], namely nigrins [29, 30] and ebulins [31,32]. Nigrin isolated from elderberry bark (nigrin b) has approximately 4000 times less in vivo toxicity to mice than ricin [33]. In cultured animal cells, nigrin b also shows a noticeably lower cytotoxicity than ricin, in the range of 1600- to 108,000-fold, depending on cell types [34]. The varying cytotoxicity of nigrin b and ricin seems to be related to the different intracellular pathway used by both RIPs [35].
Our studies into the effects of nigrin b revealed that its intravenous administration to mice at sub-lethal concentrations only had reversible effects on the gastrointestinal tract; firstly, the small intestine, and afterwards the large intestine and stomach [36]. Under such conditions, nigrin promotes intestinal stem cell apoptosis or/and the proliferation progenitors present in crypts [36]. The effects of nigrin b offer us a model to study: 1) targeting stem cells and proliferation progenitors; 2) absorption of nutrients and drugs; 3) regeneration processes leading to gut recovery. The aim of the present research was to study vitamin B6 plasma accumulation after administration of an oral bolus of vitamin B6 in mice previously treated with a sub-lethal dose of nigrin b.
2. Materials and Methods
2.1. Animals
10-week-old female Swiss mice (30 - 40 g body weight) were obtained from our university facilities. Animals were housed in plastic cages in a temperature-controlled room, kept on a 12 h light/dark cycle, and given food (V1535-000 Ssniff Specialdiäten GmbH) and water ad libitum. Unless otherwise stated, each group comprised seven mice. The number of groups used is indicated below. Management of animals followed the guidelines of the European Communities Council (2010/63/EU) for laboratory animal care and experimentation.
2.2. Nigrin b Preparation
Nigrin b was basically prepared as reported elsewhere [29] although with certain modifications. Briefly, 100 g of dried elderberry bark was extracted with 1200 ml of extraction buffer containing 0.28 M NaCl and 0.005 mM sodium phosphate (pH = 7.5) overnight at 4˚C. After centrifugation to remove cell and tissue debris, the supernatant was subjected to affinity chromatography on acid-treated Sepharose 6B as reported previously [31] and the bound proteins were eluted with extracted buffer containing 0.2 M lactose. Fractions absorbing at A280 were collected, pooled and concentrated to 5 - 6 ml with Amicon using an YM10 membrane. The protein fraction was then subjected to gel filtration through Superdex 75 HiLoad 26/60 in buffer containing 0.4 M NaCl and 0.005 mM of sodium phosphate (pH 7.5). Fractions containing protein were collected, as were those of the central peak containing nigrin b. These were then pooled and extensively dialyzed against Elix-Millipore® water and stored at −20˚C until use. Purity was checked by polyacrylamide gel electrophoresis in the presence of sodium dodecyl sulphate (SDS-PAGE) as described elsewhere [37].
2.3. Intraperitoneal Nigrin b Treatment of Swiss Mice
The concentration of nigrin b in buffer containing 0.14 M NaCl and sodium phosphate (pH 7.5) was adjusted so that 100 µl administered to mice of approximately 30 g body weight resulted in a dose of 10 mg/kg of body weight. The dose was administered intraperitoneally.
2.4. Evaluation of Intestinal Damage
Nigrin b-treated animals were sacrificed at 24, 48, and 72 h after lectin administration. Mice were injected at either of the dorsal veins of the tail 1 h before sacrifice with 100 µl of 5% (w/v) Evan’s blue (Sigma-Aldrich Química S.L., Tres Cantos, Spain) sterilized by passage through a PVDF 0.22 μm syringe filter (Millipore Ibérica S.A.U., Madrid, Spain). The stomach, small and large intestines were surgically excised, washed with PBS, and the small intestine was divided into three similar sections. Tissue samples were immersed in dimethylformamide (SigmaAldrich Química S.L., Tres Cantos, Spain) for 12 h to extract the dye. To quantify vascular leakage, extract concentrations were measured at 620 nm in a Shimadzu® UV-1700 spectrophotometer (Izasa S.A., Alcobendas, Spain).
2.5. Myeloperoxidase
Myeloperoxidase activity was assayed using the o-dianisidine procedure as reported elsewhere [38]. Intestines were removed and washed with PBS. The small intestine was divided into three thirds and the large intestine was processed as a whole. Organs were minced on a plastic plate at 0˚C and placed in a 50 ml centrifuge tube and homogenized (16,000 rpm; Micra RT homogenizer) in 10% (w/v) buffer containing 50 mM potassium phosphate (pH 6.0), 0.5% hexadecyltrimethylammonium bromide. Extracts were then centrifuged at 3500 g for 60 min (4˚C) and the supernatants were used for enzymatic analysis. The assay was performed in a final volume of 3.12 ml containing 0.1 ml of the sample (10 mg of fresh tissue), 2.9 ml of potassium phosphate buffer (pH 6.0), 60 µl of o-dianisidine dihydrochloride, and 60 µl of hydrogen peroxide. Mixtures were incubated for 20 min at 20˚C, after which incubation was interrupted so as to add 100 µl of 2% (w/v) sodium azide, before the mixtures were then incubated for a further 10 min. Finally, A460 were measured at the times indicated in the figure legend.
2.6. Histological Analysis
Animals were transcardially perfused with 4% paraformaldehyde in phosphate buffer (0.1 M, pH 7.4) after anaesthesia by i.p. injection of a mixture of 10 mg/kg of ketamine (Ketolar, Parke-Davis) and 90 mg/kg of xilacine (Rompun, Bayer A.G.). Samples of lung, liver, kidney, stomach, and small and large intestines were taken and processed for paraffin embedding. Paraffin blocks were sectioned with a Minot microtome at 7 µm and slices were stained with hematoxylin and eosin. Observations were performed and photographs were taken with a Zeiss Axiophot photomicroscope.
2.7. Vitamin B6 Administration and Analysis
Vitamin B6 administration was assigned to one of four groups (six mice per group). Three groups were injected with 10 mg/kg body weight of nigrin b in PBS. 24 h, 72 h and eight days after nigrin b injection, a single dose (100 mg/kg) of vitamin B6 was administered by oral gavage in a water vehicle following an overnight fast to clean the gastrointestinal tract. Gavage volumes varied between 90 - 120 µl based on animal weight. The amount of time a drug is present at the maximum concentration in serum (tmax) was determined for vitamin B6 as 15 minutes after oral administration (unpublished data). At this time, mice were sacrificed by exsanguinations and blood was collected by cardiac puncture for vitamin B6 plasma concentration analysis. Blood samples were centrifuged, and the plasma was withdrawn and stored at −20˚C until analysis.
Vitamin B6 plasma concentrations were measured on an HPLC system (Shimadzu) equipped with a model series LC-10 ADVP pump with an FCV-10 ALVP lowpressure gradient unit, SCL-10 AVP system controller, GT-154 on line degasser, fraction collector Foxy jr. 1500, Rheodyne 7725i injector with a 20 µL loop and an SPD- 10 AVP UV-Vis detector. Separation and quantitation were performed at 30˚C on a 150 mm × 4.6 mm (i.d.) LunaTM RP 18 column (3 µm particle size) (Phenomenex) in conjunction with a C18 4 mm × 3.0 mm Security Guard Phenomenex pre-column. The mobile phase was a mixture of methanol and 0.05 M ammonium acetate 25:75 (v/v). The flow rate of 1.0 ml/min was maintained, and the column effluent was monitored continuously at 219.6 nm. Data acquisition was performed on class-VP software. The assay had a variation coefficient (C.V.) of below 7%, and a sensitivity of 0.7 mg/l. Each plasma sample was measured in duplicate.
2.8. Other Procedures and Statistical Analysis
Protein concentration was determined by the method of Kalb and Bernlohr [39]. Data analysis was carried out using the SIMFIT package 6.0.24. (W.G. Bardsley, University of Manchester). For pharmacokinetic analysis, the best fitting line was achieved using the two exponential functions:

Goodness of fits was obtained according to the results, analysis of residuals, and the Durbin-Watson test, as well as Shapiro-Wilks and Akaike AIC stats. All data were expressed as mean ± standard deviations (SD). A p value < 0.05 was considered to be statistically significant using the t-test between the two means for unpaired data.
3. Results
3.1. Nigrin b Isolation
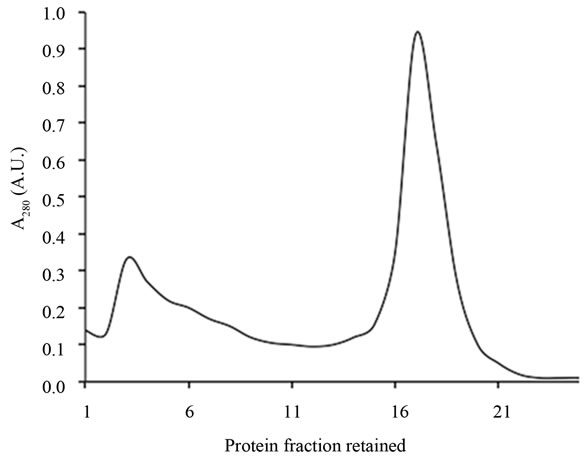
In the present research, we used elderberry bark dried at room temperature with renewal of air until dryness and constant weight (32% final dry weight). Using dried bark is an improvement on the previous procedure and reduces bark handling and processing. We chose isolation by affinity chromatography to isolate only those molecules able to bind D-galactose residues and thus achieve maximum activity. As shown in Figure 1(a), the three D-galactose binding proteins present in bark were bound to the AT-Sepharose 6B and eluted with a buffer containing lactose. The eluted mixed proteins were further resolved by Superdex 75 chromatography into the three lectins; SNA-I, nigrin b, and SNA-II (Figure 1(b)). The yields from 100 g of dried bark for this specific prepara-
 (a)
(a) (b)
(b)
Figure 1. Chromatography patterns of the isolation of elderberry bark lectins. Elderberry bark extracts were subjected to affiniy chromatography on acid-treated Sepharose 6B (a) Lectins were then resolved by Superdex 75 chromatography (b) as indicated in the experimental section.
tion were 3.3 mg of SNA-I, 5.5 mg of nigrin b and 6.5 mg of SNA-II. In addition to their D-galactose binding ability, the three proteins exhibited good red blood cell agglutination activity, in agreement with previous findings [29]. The values were 20, 0.4 and 38 µg/ml for nigrin b, SNA-I and SNA-II respectively. As shown in Figure 2, with the exception of SNA-I, which contained a small amount of nigrin b, they were essentially pure as judged by SDS-PAGE. The present results indicate that the modified protocol for nigrin b isolation heralds an improvement on previously reported procedures which used frozen elderberry bark [29,40].
3.2. Effects of Nigrin b Treatment on Body Weight and Intestine Length
Intraperitoneal injection of 10 mg/kg body weight of nigrin b promoted a reduction in body weight as early as 24 h after nigrin b treatment (data not shown). The maximum was achieved 72 h after nigrin b administration, with a 14% reduction in the body weight of mice. Thereafter, the treated mice began to recover and, after eight days, the weight was roughly the same as at the start of the treatment. The weight reduction profile was very similar to that reported previously for the TNBS mice model [15,41]. A significant reduction in voluntary food intake was observed between 12 and 48 h (data not shown). This might be linked to reduced food intake and injury-dependent intestinal epithelial cell shedding. Derangement triggered by nigrin b treatment was associated with a substantial reduction (10.5%) in small intestine
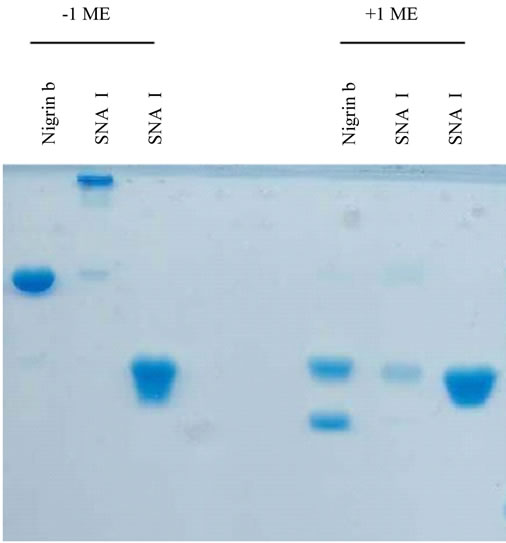
Figure 2. SDS-PAGE of the lectins isolated from elderberry bark. Proteins isolated by Superdex 75 chromatography were analyzed as indicated in the experimental section. The amount of protein per well was: 16 µg nigrin b; 15 µg SNA-I; 19 SNA-II.
length, which was already evident 24 h after nigrin b administration (Figure 3). Twenty-two days after nigrin b treatment, small intestine length recovered to control value. There were no significant effects on the large intestine (data not shown).
3.3. Evan’s Blue Staining
Agents that trigger gut mucosa injury might lead to gross derangement and bowel ulceration. These disruptive effects may be revealed by the accumulation of Evan’s blue in damaged tissue [42]. We therefore investigated whether the damage promoted by nigrin b treatment in the small intestine would be reflected in the accumulation of Evan’s blue. As shown in Figure 4, nigrin b treatment promoted significant stain absorption as early as 24 h, reaching a maximum at 48 h, and declining close to control animal levels after 72 h. However, these effects
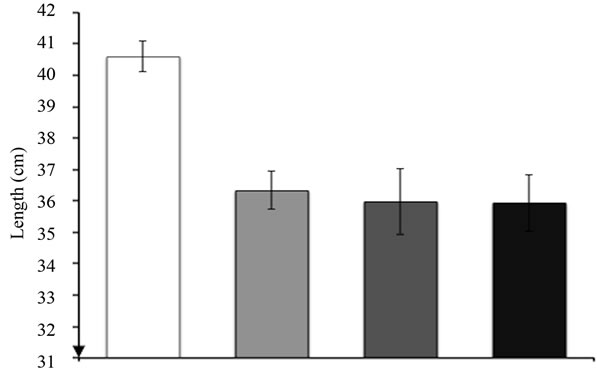
Figure 3. Effects of nigrin b administration to mice on small intestine length. The bars indicate the standard error of the mean.
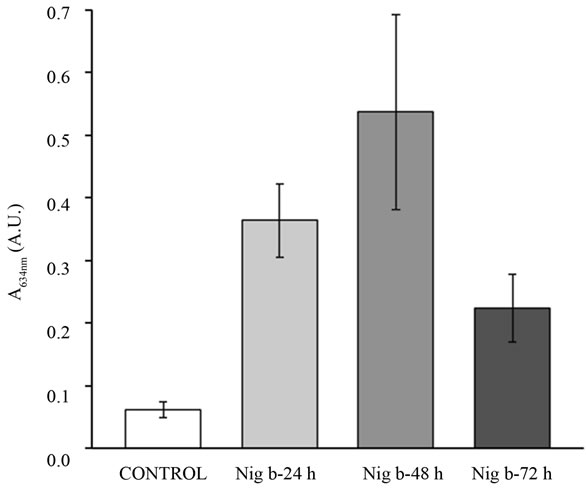
Figure 4. Effects of nigrin b administration to mice on the uptake of Evan’s blue. Values are ex-pressed as units of A634 from the dye retained by the tissue. Bars indicate the standard error of the mean.
were fully reversible, since eight days after treatment, recovery was complete (data not shown).
3.4. Myeloperoxidase Activity
As shown in Figure 5, myeloperoxidase activity of the small intestine increased with nigrin b treatment. The maximum was reached 24 h after nigrin b administration, then declining before recovering to control value eight days after administration. Myeloperoxidase activity in the large intestine was lower than in the small intestine, remained unaffected up to 72 h, and declined eight days after nigrin b administration. After 22 days, values were normal.
3.5. Histological Analysis
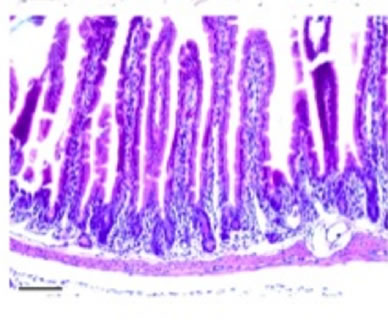
Histological analysis of all the organs studied revealed lesions in the small intestine only, these consisting of time-dependent derangement of intestinal mucosa (Figure 6). Twenty-four hours after nigrin b administration the crypt epithelium was seen to display a high number of injured cells. These cells showed shrinkage, increased cytoplasmic eosinophilia, and apoptotic body formation. Lesion intensity varied along the intestine. Villi were well preserved on most of the surface, although in some areas they were lost. Enterocytes appeared flattened and widened, most likely as a compensatory mechanism to allow the few remaining cells to cover a larger surface of mucosa than in control animals. Forty-eight hours after nigrin b treatment the crypts had recovered from damage, and showed well-formed new crypts. Eight days after nigrin b injection, the small intestine had fully recovered (data not shown).
3.6. Determining Vitamin B6 in Plasma of Nigrin b-Treated Mice
Vitamin B6 analyses in plasma were carried out at maximum wavelength following the previously described method [43]. The calibration curve (n = 6) obtained by peak area versus drug concentration was linear over the 500 - 10,000 ng/ml range, and the correlation coefficient (r) was above 0.999. The equation of the calibration plot was y = 5038.5x + 2355.9 for pyridoxine in plasma. Quantitation limit, accuracy, repeatability and precision were found to be satisfactory (data not shown). No statistical differences were found between the vitamins doses administered (Figure 7), although at 100 mg/kg of vitamin B6, plasma concentration looked higher. For this reason, we chose 100 mg/kg of vitamin B6 as the oral bolus to be studied in the nigrin b model. As shown in Figure 8, 24 h after injection of 10 mg/kg body weight of nigrin b, mice accumulated half the amount of their control counterparts. In contrast, 72 h after nigrin b injection, vitamin B6 uptake had recovered almost fully,
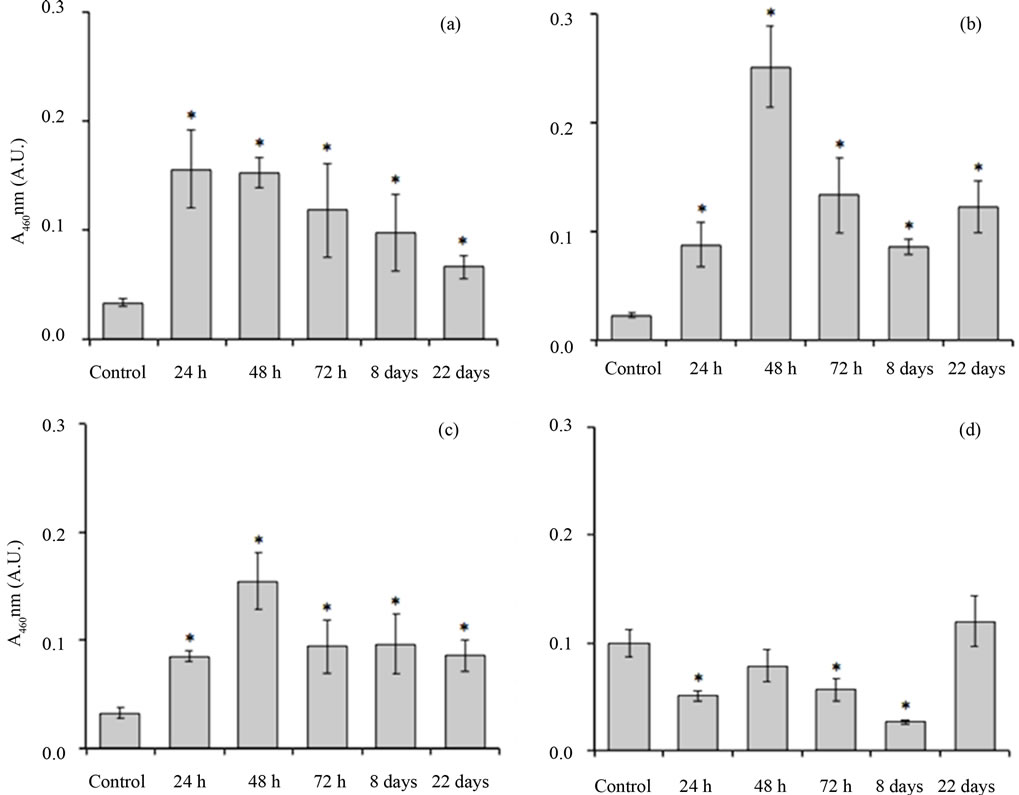
Figure 5. Effects of nigrin b administration to mice on the myeloperoxidase activity of the duodenum. Segments of intestines as indicated under Materials and Methods were ground and myeloperoxidase activity was determined. (a) First third of the small intestine; (b) Second third of the small intestine; (c) Distal third of the small intestine; (d) Large intestine. Values are expressed as units of A460 per 10 mg of fresh tissue. The bars indicate the standard error of the mean. *mean p < 0.05 vs. control.
 (a)
(a) (b)
(b)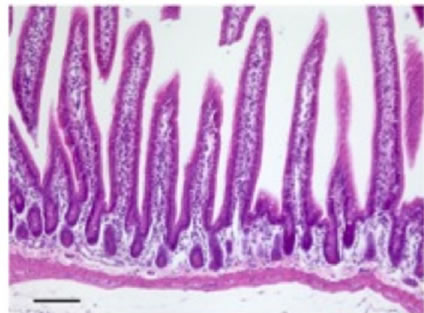 (c)
(c)
Figure 6. Sections of small intestine in a control animal (a) 24 (b); and 48 (c) after IP injection of 10 mg/kg body weight nigrin b. The Lieberkühn crypts are almost destroyed at 24 hours after nigrin b administration and the villi are well preserved. After 48 hours, the crypts had recovered. The bar represents 100 µm.
and recovery was complete eight days after injection. Basal concentration of vitamin B6 from dietary sources was lower than the detection limit of the HPLC procedure used here.
4. Discussion
To determine the effects of individual food components on gut health, particularly so-called functional foods as well as complex food mixtures, several mouse models have been developed [14,15]. Both chemical and ricin models promote undesired toxic effects which are some times irreversible. In order to ascertain whether the nigrin b model might prove valuable for exploring absorption processes, we apply the transient toxic effects of nigrin b
Figure 7. Plasma concentration of vitamin B6 to mice after a single oral bolus of 100, 50 and 25 mg/kg body weight of pyridoxine hydrochloride. The bars indicate the standard error of the mean. *mean p < 0.05 vs. control.
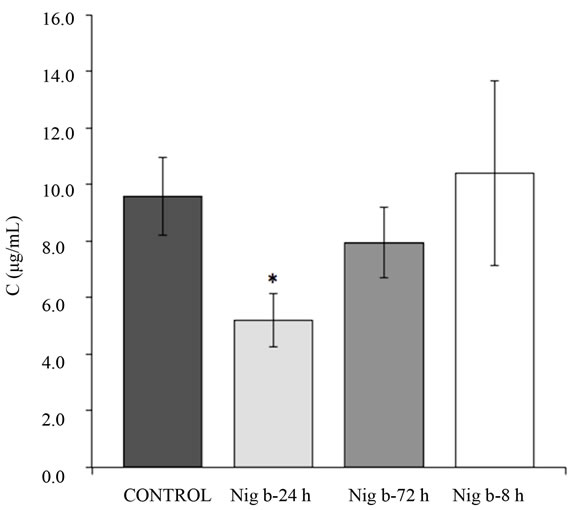
Figure 8. Plasma concentration of vitamin B6 to mice after their treatment with 10 mg/kg body weight of nigrin b i.p. Mice were given an oral dose of 100 mg/kg body weight of vitamin B6. The plasma concentration of vitamin B6 was assayed as indicated in the Materials and Methods Section. The bars indicate the standard error of the mean. *mean p < 0.05 vs. control.
on mice to analyse vitamin B6 uptake, using nigrin b prepared from dried elderberry bark to simplify the procedure. Affinity chromatography ensured that all the protein molecules retained by the AT-Sepharose 6B were active. The protein obtained has the same apparent Mr as the nigrin b isolated from wet frozen elderberry bark, as previously reported [29], and retains full red blood cell agglutination activity and mouse toxicity.
The current view is that the supply of vitamin B6 to plasma has two components, one which is dietary in origin, and a second which is microbial in origin in the colon [44]. Vitamin B6 uptake is performed by specific carrier-mediated mechanisms in both the small [44] and large intestines [45]. Our results indicate that plasma accumulation of vitamin B6 from a large oral bolus is greatly reduced (nearly 50%) 24 h after nigrin b i.p. administration. Such a reduction is consistent with a significant decrease in the number of crypts compared to control animals (Figures 6(a) and (b)), which also seems compatible with the recovery from remnant stem cells. Under these conditions, only the small intestine crypts and not the villi showed significant derangement. The shortening of the epithelium associated to nigrin b-promoted derangement would contribute to intestinal surface reduction and thus most probably also to the number of carrier molecules in mucosal cells. 48 h after nigrin b administration, crypts and vitamin B6 plasma levels recover to control values (Figure 6(c)). These results support our hypothesis that vitamin B6 uptake is highly active in the small intestine crypts when the vitamin is administered orally as a bolus. Under such conditions, the contribution of the large intestine to vitamin B6 uptake would be considerably lower than that of the small intestine component.
At the time the nigrin b effect on vitamin B6 uptake reached its maximum, lectin was not detectable at all in plasma after one hour when analysed by Western blotting and immunodetection (data not shown). This suggests that lectin quickly disappears after nigrin b signalling on target cells, although apoptotic effects have already been induced, persist and are evident some time later. Such an assumption is supported by the shortening of the small intestine and the myeloperoxidase profile 24 h after nigrin b administration.
Gut derangement is promoted by crypt cell death which, after differentiation, will further migrate and replace detached cells at the villi. Specific damage to these cells by nigrin b might be due to the presence of some kind of specific receptor or anchor for nigrin b in the target cells, in contrast with their neighboring cells and in general with other tissues and organs that apparently remain unaltered following nigrin b treatment. Action is exerted from the serous side to the luminal side. This contrasts with chemical models in which the aggressive compounds are administered orally or rectally, meaning that injuries must be exerted from the luminal side.
As shown in the present study, the effect of nigrin b promoting non-lethal derangement of the small intestine mucosa was reversible and therefore proves useful in absorption studies. From the standpoint of safety, the nigrin b model is also very useful due to the reduced biohazard risks associated with the handling and use of said lectin compared to other toxic proteins such as ricin and Shiga-like proteins [46]. Further work will apply our model to study the uptake of other nutrients and the intestinal digestion of complex foods.
5. Conclusion
The present results support nigrin b administration as a model for injury-regeneration of mice gut, and may prove useful in studying processes linked to intestinal absorption and regionalization of nutrients or drugs whose transport, like vitamin B6, depends on carrier-mediated processes. This opens up new avenues for exploring the nature and implications of the specific toxicity of nigrin b on intestinal crypt cells involved in intestine regeneration and how this can impact nutrient uptake and accumulation in plasma. Furthermore, our findings complement the findings obtained with chemical models.
6. Acknowledgements
This study was supported by grants from the Regional Government of Castilla y León [Junta de Castilla y León] (GR106-Regional Education Ministry and Regional Health Ministry) and UVa-GIR to T.G., the Complutense University UCM/CAM research group 950247 as well as MAT2010-21621 C02-01 from the Ministry of Innovation and Science (Spain) to D.C. We also wish to thank J.E. Basterrechea, U.L. Santiago and T. Rodríguez for technical assistance, and Philip Jaggs for manuscript correction.