Comparison of Bacterial Profiles of Fish between Storage Conditions at Retails Using DGGE and Banding Pattern Analysis: Consumer’s Perspective ()
1. Introduction
Seafood consumption is becoming increasingly popular due to the presence of high quality proteins, poly-unsaturated fatty acids, and vitamins [1,2]. Most nutrients are well maintained in cases where only mild cooking or none at all (e.g. traditional Japanese styles of sushi and sashimi) is involved. However, undercooked or raw fish pose health risks due to potential pathogen contamination from water or secondary contamination during harvesting, processing and handling [3]. Hwang et al. [4] reported that fish sold in traditional markets had higher fecal coliforms than fish from supermarkets. However, the cleanest fish were those from fishing piers without any postharvesting processing. Several studies reported that the fish became contaminated by skin-penetration during delivery or handling in groceries [5]. In Hong Kong, from 1997 to 1999, over 10% of sushi and sashimi samples were contaminated with pathogens (i.e., Vibrio parahaemolyticus, Staphylococcus aureaus, Salmonella, and Listeria monocytogenes) [6]. In the United States, an outbreak of salmonellosis involving 89 individuals was reported due to the consumption of sushi [7].
Tuna and salmon are the most commonly consumed seafood and often consumed as raw [8], so it is significant to obtain the baseline information of bacterial community profile that could impact fish quality and public health about these two fish types. Polymerase chain reaction—denaturing gradient gel electrophoresis (PCR-DGGE) is known to be a reliable, reproducible, rapid and inexpensive method that is based on conserved sequences of gene amplification. Compared to traditional culture methods, PCR-DGGE is able to detect more phylogenetically distinct microbial populations in evaluating microbial flora and reduces the variations between the samples from the same sources or replicates of a single sample [9]. It has been widely applied in estimating microbial diversity and monitoring the shift of microbial structure in various environmental or food samples [10]. It is a useful approach for identification of environmental microbial flora in fish and recently was used to study microbial flora in modified-atmosphere-packaged Atlantic cod and intestinal bacterial flora in rainbow trout [11,12]. In the current study, we used this technique to investigate the differences in bacterial communities between the most commonly used storage practices (fresh vs frozen) for the raw-consumed fish.
The aim of our study was to determine bacterial community profiles between two storage conditions (frozen vs fresh) in salmon and tuna at the stage of consumer’s purchasing using PCR-DGGE and banding pattern analysis. One challenge was to efficiently remove the fish cell mass which could hinder bacterial DNA extraction and PCR amplification of 16S rRNA gene. To overcome this, we used a somatic cell releasing agent to eliminate the interference from the fish matrix during the separation of the bacterial community DNA. The conditions of PCR and DGGE were optimized to make this approach more efficient in detecting the bacteria in fish samples. This information will be helpful for consumers to evaluate the potential risks of eating raw fish.
2. Materials and Methods
2.1. Fish Sample Preparation
Fish samples, including 13 fresh salmon samples, 12 fresh tuna samples, 4 frozen salmon samples and 4 frozen tuna samples, were collected from 5 different supermarkets in and around Columbus, Ohio. Each of the fish samples was wild-caught. Fresh samples were defined as the fish that were stored at 0˚C - 4˚C (on the ice or in the refrigerator) regardless of packaging type while the fish were fully packaged. Those sold at –20˚C (in the freezer) were considered as frozen samples. Fish samples were transported to the lab on ice and analyzed within 1 hour after collection. Ten-gram of each fish sample was mixed with 90 ml of peptone water (0.85% NaCl w/v and 0.1% peptone w/v), then homogenized in Stomacher 80 (SEWARD, Worthing, West Sussex, UK) for 2 minutes. In order to examine microbial biota from the perspective of potential human health risks, an enrichment step at body temperature was used to simulate an intestinal tract system. For this, a non-selective medium was used to minimize the shift of the bacterial community [13]. Two milliliters of the homogenized fish samples were added to 50 ml of modified TSB (FISHER SCIENTIFIC, Waltham, MA) with 0.1% yeast extract (pH = 7.3). The samples were then cultured in a shaking incubator at 37˚C overnight. Aseptic technique was maintained during all sample collection and processing activities.
2.2. Bacterial Community DNA Extraction
Three milliliters of the enriched cultures were collected and centrifuged at 120× g for 1 minute to remove food residues. Bacterial pellets were formed by centrifugation at 10,000× g for 2 minutes. In order to separate bacterial DNA from the remaining fish cells efficiently, the pellet was mixed with 100 μl somatic cell releasing agent (SRA, New Horizons Diagnostics Corp., Columbia, MD) [14] and held for 5 minutes at room temperature. After centrifugation at 10,000× g for 2 minutes, the pellet was washed once with phosphate buffered saline (PBS) (FISHER SCIENTIFIC, Waltham, MA) to remove any remaining fish debris. Bacterial cells were collected by centrifugation at 10,000× g for 2 minutes and DNA was extracted using a QIAamp DNA Mini Kit (QIAGEN, Valencia, CA) according to the manufacturer’s instructtion.
2.3. PCR Amplification of 16S rRNA Genes
The V3-region of the 16S rRNA gene of bacteria was amplified using two universal bacterial 16S rRNA gene primers BA338f (5’-ACT CCT ACG GGA GGC AGC AG-3’) and 518r (5’-ATT ACC GCG GCT GCT GG-3’). When used in DGGE, a 40bp GC clamp was added to the 5’ end of primer BA338f [9]. The total PCR reaction volume was 50 μl, which included 2.5 μl of bacterial DNA, 5 μl of 10 × PCR buffer (QIAGEN, Valencia, CA), 10 μl of Q solution (PCR enhancer, QIAGEN, Valencia, CA), 0.5 μl of each forward and reverse primer from 100 μM primers stocks, 1.5 μl of 50 mM MgCl2, 1 μl of 10 mM dNTPs, 0.2 μl of Taq polymerase (approximate 1U, INVITROGEN, Carlsbad, CA) and 28.8 μl of sterilized distilled water. PCR amplification was conducted using a MutiGene Thermal Cycler (LABNET, Edison, NY) under the following conditions: 94˚C for 3 minutes; 30 cycles of 92˚C for 1 minute, 55˚C for 30 s, 72˚C for 1 minute; and final extension at 72˚C for 10 minutes. The PCR product was confirmed by agarose gel (1.0%) electrophoresis and the gel was stained using ethidium bromide (1 μl·100·ml–1).
2.4. Denaturing Gradient Gel Electrophoresis (DGGE)
The amplified 16S rRNA gene products were separated using a DCode System (BIO-RAD, Hercules, CA) and a density gradient gel consisting of 8% polyacrylamide (37.5:1) with a 30% - 70% denaturant gradient at 60˚C for 18 hours. Gel images were captured using a Molecular Imager Gel Doc XR System (BIO-RAD, Hercules, CA). The DGGE banding profiles were analyzed using the BioNumerics software (BIOSYSTEMATICA, Tavistock, Devon, UK) as described by Hovda et al. [11] The gel images were first normalized to correct any gel smiling or uneven band migration by comparison with two external reference lanes. The DGGE banding profiles were analyzed using Pearson’s coefficient and the Neighbor-Joining algorithm [15].
2.5. Sequencing Analysis of the Selected DGGE Bands
The unique bands were excised from the gels with a sterile scalpel under UV transillumination, and the gel slices were placed into 30 μl of nuclease-free water and held at 4˚C for 24 hours. Three microliters of the supernatant were used as the template for PCR with the same conditions described above, without GC-clamp in the forward primer. After confirmation with agarose gel (1.0%) electrophoresis, the PCR products were purified with a QIA quick PCR purification kit (QIAGEN, Valencia, CA) and further sequenced with the non-GC clamp forward primer, BA338f, using ABI Prism 3730 DNA analyzer (APPLIED BIOSYSTEMS, Foster City, CA). The process was done in the Plant-Microbes Genomics Facility at The Ohio State University (http://pmgf.biosci.ohio-state. edu). The sequences were compiled with a Sequence Scanner v1.0 (APPLIED BIOSYSTEMS, Foster City, CA) to check for accuracy and their taxonomic identifycation was determined by comparing with reference sequences in the GenBank database using the BLAST search program [16].
3. Results
3.1. Bacterial 16S rRNA Gene Extraction and PCR Amplification
Bacterial genomic DNAs were extracted from fish samples and then separated using 1% agarose gel electrophoresis stained with ethidium bromide. Genomic DNA with a large molecular weight was observed in the upper region of the gel. However, the quality of the DNA was not good enough for further analysis (Figure 1(A) Lanes 2 and 3). In order to obtain higher quality bacterial genomic DNA, SRA was used to remove fish cells. The PCR results showed that the use of SRA was advantageous in obtaining high quantity bacterial DNAs from the fish samples (Figure 1(A)). Without SRA treatment, the level of primary PCR products was low (Figure 1(B)). After the SRA treatment, clearer bacterial DNA bands were observed and a sufficient 16S rRNA gene product could be obtained (Figure 1(B)).
3.2. Bacterial Banding Pattern Analysis
The DGGE gel pattern of the bacterial community from the salmon and tuna are summarized in Figure 2. Bacterial community bands obtained by DGGE using the denaturant range from 30% to 70% are presented in Figures 2(a) and (b). From these, the bands with high G + C% were separated completely. The fresh samples generated more bands than the frozen fish samples. The average number of bands obtained from the PCR product of the fresh fish samples was over 20, while that of the frozen fish was only 12. Since the bands at the low denaturant concentration area were not separated out, the same PCR products were analyzed again using DGGE with the denaturant range from 30% to 50% in order to

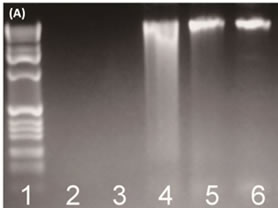
Figure 1. (A) The use of SRA for efficient bacterial DNA extraction from fish samples. The lanes 5 and 6 show enhanced recovery of bacterial DNA. Lane 1: DNA ladder; Lane 2: salmon; Lane 3: tuna; Lane 4: positive control; Lane 5: salmon (SRA); Lane 6: tuna (SRA); (B) The use of SRA for improved quality of PCR amplification of bacterial community 16S rRNA gene from a fish sample (~180 bp). Lane 1: Marker; Lane 2: positive control; Lane 3: salmon; Lane 4: tuna; Lane 5: salmon (SRA); Lane 6: tuna (SRA).
recover the low G + C% amplicons. During this procedure, we lost some of the lanes (Lane 4 of salmon and Lane 9, 10, 12 of tuna in Figure 2(b)), so only 16 lanes of salmon and 13 lanes of tuna were shown in Figures 2(c) and (d), respectively. Then, 12 additional bands were recovered (band 22 - 33 in Figures 2(c) and (d)). Narrowing the denaturant gradient (from 30% - 70% to 30% - 50%) enabled us to maximize the collection of different and representative bands from these fish samples.
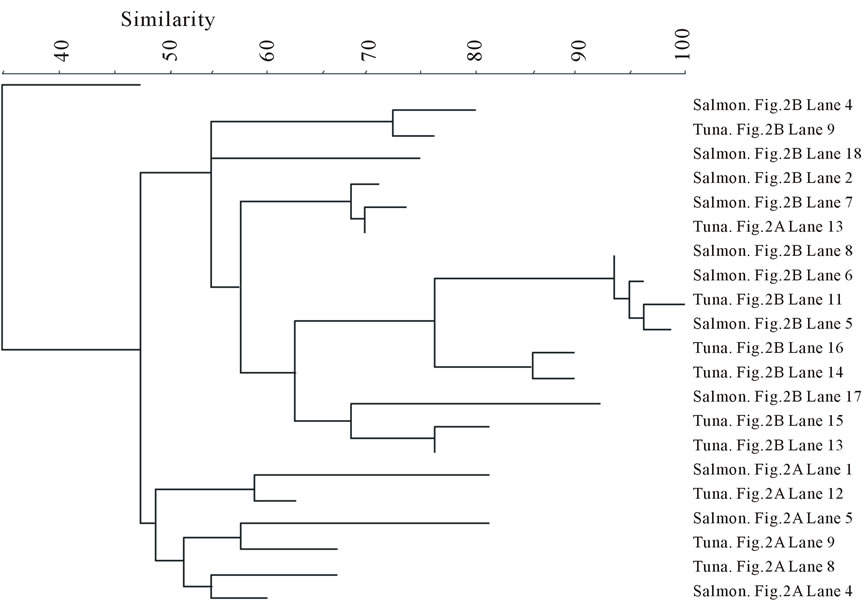
The DGGE bands were analyzed by BIONUMERICS software. The results are summarized between the fish types in Figure 3 in the form of band-comparison dendrogram. The banding pattern analysis shows that the bands from the frozen samples were tightly clustered in both fish types. In contrast, the bands from the fresh samples of both fish types did not seem to be clustered as a group although they were aggregative.
The bands were also compared by storage conditions and the dendrograms are illustrated in Figure 4. The banding profiles from the fresh fish samples were not distinctly clustered by each fish type and no significant clustering phenomenon was observed (Figure 4(a)). In contrast, the bands from the frozen samples were clearly separated depending on the fish type: salmon vs tuna (Figure 4(b)).
3.3. Bacterial Identification
To determine bacterial taxonomic identification, 94 bands were directly sequenced [11]. Sequences were analyzed by comparing with most closely related bacterial 16S rRNA sequences from the NCBI database. The analyzed sequences from the excised bands which showed high similarity (>95%) to the reference sequences were summarized in Table 1. Serratia ureilytica (Figure 2(a) band 5), Lactococcus plantarum (Figure 2(a) band 8), Haemophilus piscium (Figure 2(b) band 21), Carnobacterium maltaromaticum (Figure 2(c) band 23), Pseudomonas
 (a)
(a)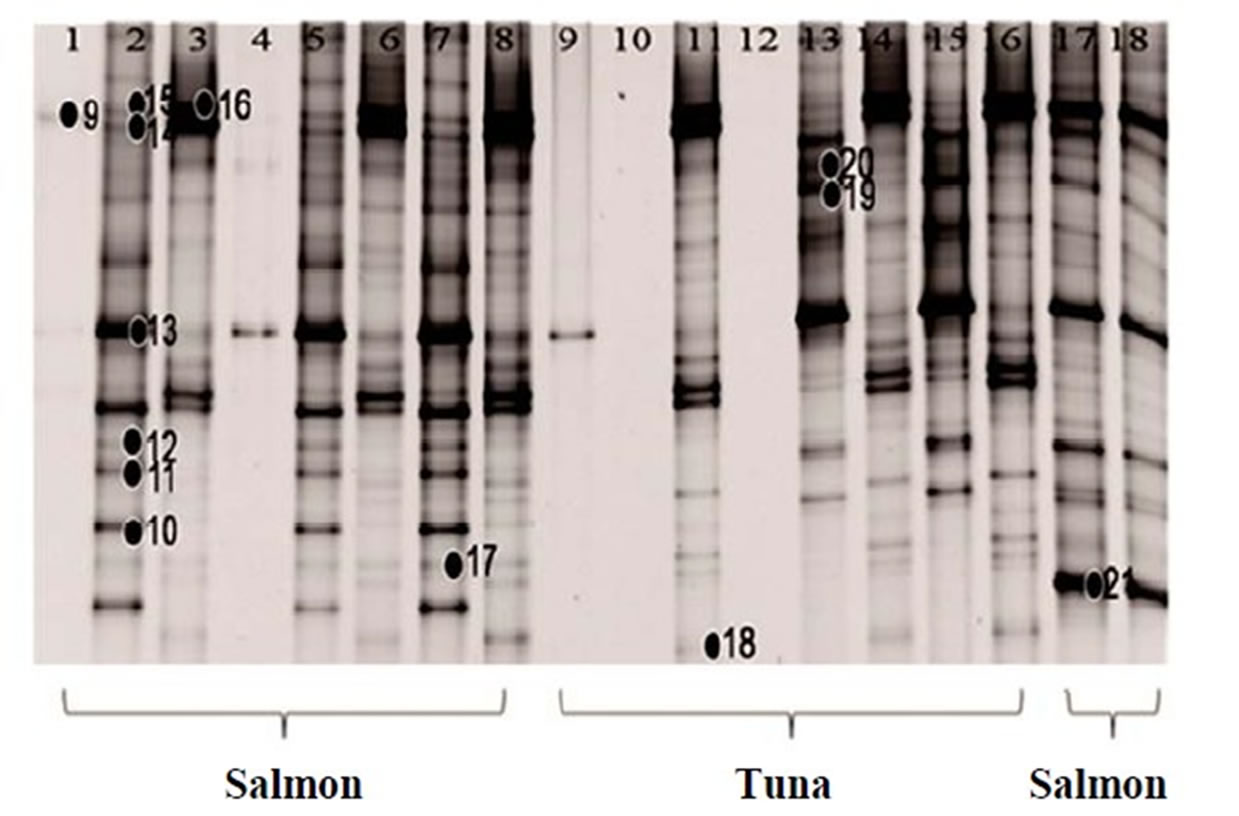 (b)
(b) (c)
(c)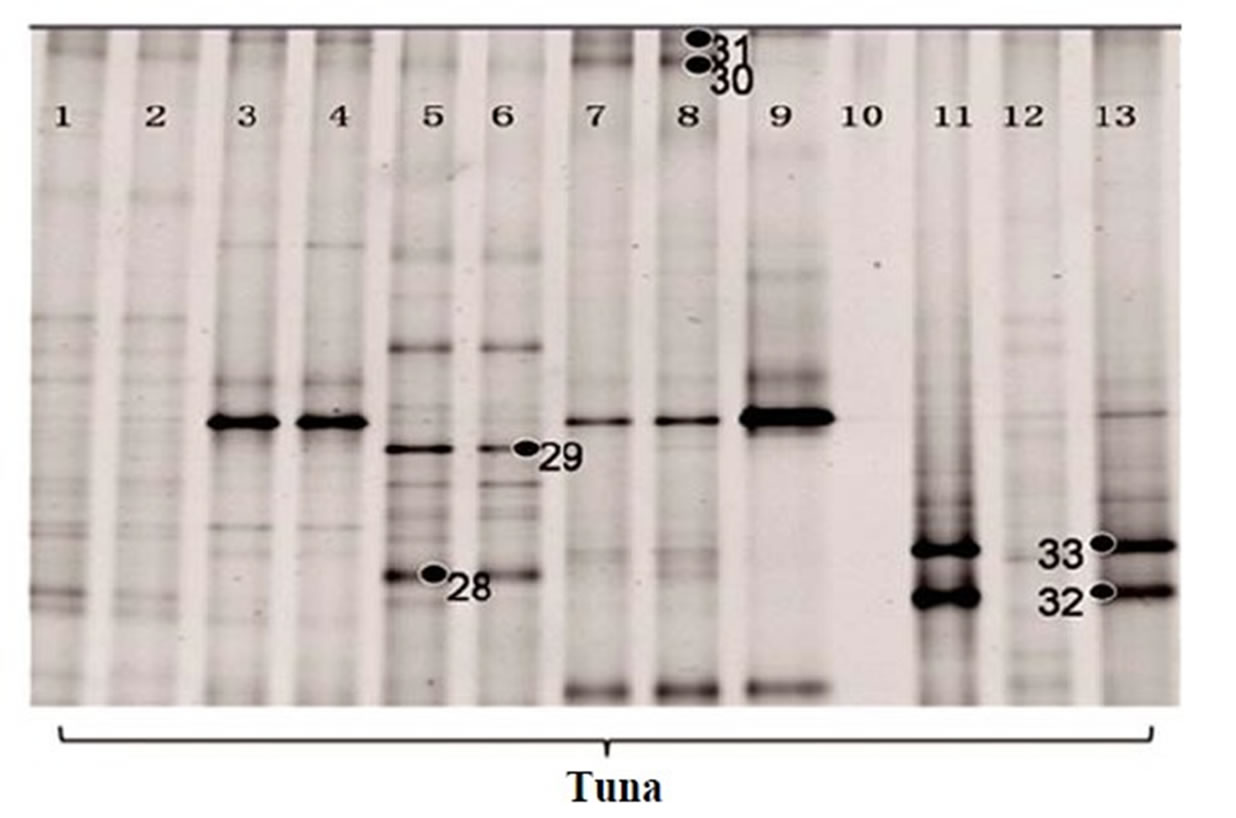 (d)
(d)
Figure 2. 16S rRNA gene DGGE profile (bands marked with ● were selected for sequencing). (a) The first set of 16S rRNA gene DGGE profile using 30% - 70% denaturant range (Lanes 1, 4 and 5 are fresh salmon samples; Lanes 2, 3, 6, 7 are frozen salmon samples; Lane 8, 9, 12, 13 are fresh tuna samples; Lanes 10, 11, 14, 15 are frozen tuna samples); (b) The second set of 16S rRNA gene DGGE profile using 30% - 70% denaturant range (Lanes 1 to 8 and Lanes 17, 18 are fresh salmon samples; Lane 9 to 16 are fresh tuna samples); (c) The first set of 16S rRNA gene DGGE profile using 30% - 50% denaturant range (all salmon); (d) The second set of 16S rRNA gene DGGE profile using 30% - 50% denaturant range (tuna).
vranovensis (Figure 2(c) band 24) and Aerococcus viridans (Figure 2(c) band 25) were the predominant bacteria found in the fresh salmon samples. In the fresh tuna samples, various bacterial species were found, such as Brochothrix thermosphacta (Figure 2(a) band 4), Lactococcus plantarum (Figure 2(a) band 8) and Edwardsiella ictaluri (Figure 2(b) band 13). Acinetobacter baumannii (Figure 2(a) band 9; Figure 2(c) band 27; Figure 2(d) band 32), Oceanospirillum beijerinckii (Figure 2(b) band 14), Plesiomonas shigelloides (Figure 2(a) band 1) and various Shewanella species (Figure 2(a) band 7; Figure 2(b) band 11, band 15, band 17) were detected in the fresh salmon and the fresh tuna.
In general, frozen fish samples showed less bacterial diversity in DGGE analysis. The predominant bacteria in frozen salmon were Kluyvera intermedia (Figure 2(a) band 2), Serratia quinivorans (Figure 2(a) band 3), Pseudomonas vranovensis (Figure 2(c) band 24), and Aeromonas viridans (Figure 2(c) band 25). Serratia ureilytica (Figure 2(a) band 5), Carnobacterium viridans (Figure 2(a) band 6), and Vagococcus salmoninarum (Figure 2(d) band 29) were the most prevalent bacteria in frozen tuna.
4. Discussion
4.1. Bacterial DNA Extraction
All the fish samples were collected from supermarkets and the bacterial load was expected to be low since the retailers should guarantee the safety of the products they sold. As expected, little bacterial DNA was obtained when extracted from the fish samples without any preenrichment. We used a simple enrichment step in order to increase bacterial quantity and obtain successful PCR products. It may favor the growth of certain group of bacteria [43]. However, one of our aims was targeting bacterial community profile and bacteria of concern (e.g. pathogens) from a consumer’s perspective, not focusing
 (a)
(a)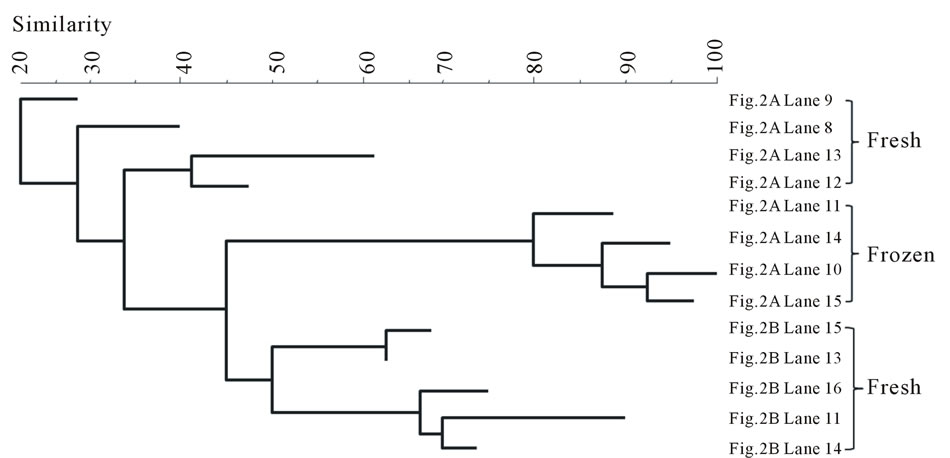 (b)
(b)
Figure 3. Banding pattern analysis of bacterial community by band-search algorithm and bands comparison among the same fish type. (a) Salmon; (b) Tuna.
on the ratio of bacterial species in the whole bacterial population.
Another challenge was to obtain bacterial DNA for successful PCR from a complex matrix, such as food and environmental samples, because there are inhibitory components which cannot be eliminated easily [44]. Thus, extraction and separation of bacterial community DNA from the fish matrix is a critical step for successful amplification of bacterial DNA. Somatic cell releasing agent (SRA), which consists of non-ionic detergents and surface active agents, can lyse somatic cells without cleaving bacterial cells [14]. SRA has been used to remove non-bacterial cells in environmental applications when determining bacterial loads [45]. Results indicate that SRA is an effective reagent in eliminating fish cells, which was likely the primary source of contamination in total bacterial DNA extraction (Figure 1(A) Lanes 5 and 6; Figure 1(B) Lanes 5 and 6).
4.2. Bacterial Community Structure and Species Diversity in Fish
Overall, the fresh samples demonstrated more bacterial diversity than the frozen samples. The amplified PCR products from the fresh samples had more bands separated by DGGE. This indicates that some bacteria lost viability during freezing. Nevertheless, freezing, as a selective factor, was observed to favor the growth of other bacterial species (Aerococcus viridans, Kluyvera intermedia) or have little influence on the survival of some species (Carnobacterium viridans, Enterococcus faecalis, Enterococcus mundtii, Serratia ureilytica, Vagococcus salmoninarum). The fresh fish samples were not clustered according to fish type (Figure 4(a)), indicating that the fish samples could become contaminated with various bacteria through multiple pathways, which may be highly relevant to the cultivation or post-harvesting handling. This would result in random and nonspecific bac-
 (a)
(a)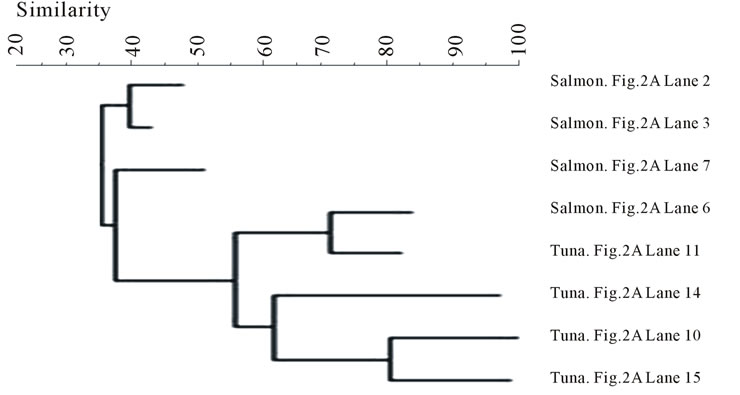 (b)
(b)
Figure 4. Banding pattern analysis of bacterial community by band-search algorithm and bands comparison among the same storage condition. (a) Fresh; (b) Frozen.
terial diversity. However, after freezing, some bacteria were inactivated by low temperature, leaving similar surviving bacteria to appear in the same fish type (Figure 3). Within the frozen samples, the bacterial identities were clustered by fish type (Figure 4(b)), except that only one frozen salmon sample was clustered with the frozen tuna samples. This may indicate that the composition of microbial communities were more influenced by after-harvest practices than the original environmental contamination and freezing reduced the species differences of bacterial community in the fish samples.
4.3. Bacterial Sources and Possible Health Risks
Several species found in this study are spoilage bacteria. Carnobacterium maltaromaticum, a lactic acid bacterium, is commonly distributed in marine or river water environments and can tolerate low temperature. C. maltaromaticum is also a fish pathogen and has been isolated from spoiled chilled seafood [46]. Brochothrix thermosphacta is a common psychrotrophic spoilage microorganism, which has been found in meat, poultry, and fish products, and is recognized as the main bacteria causing “off-flavors” [20,47]. Many strains have been confirmed as human pathogens and/or aquatic life pathogens. Aerococcus viridans is a nosocomial pathogen, which may cause respiratory or urinary tract infections and fatal diseases, and is commonly penicillin-resistant [37,48]. Acinetobacter baumannii is an important opportunistic pathogen; multi-drug resistant strains frequently cause nosocomial outbreaks [49]. Plesiomonas shigelloides, a

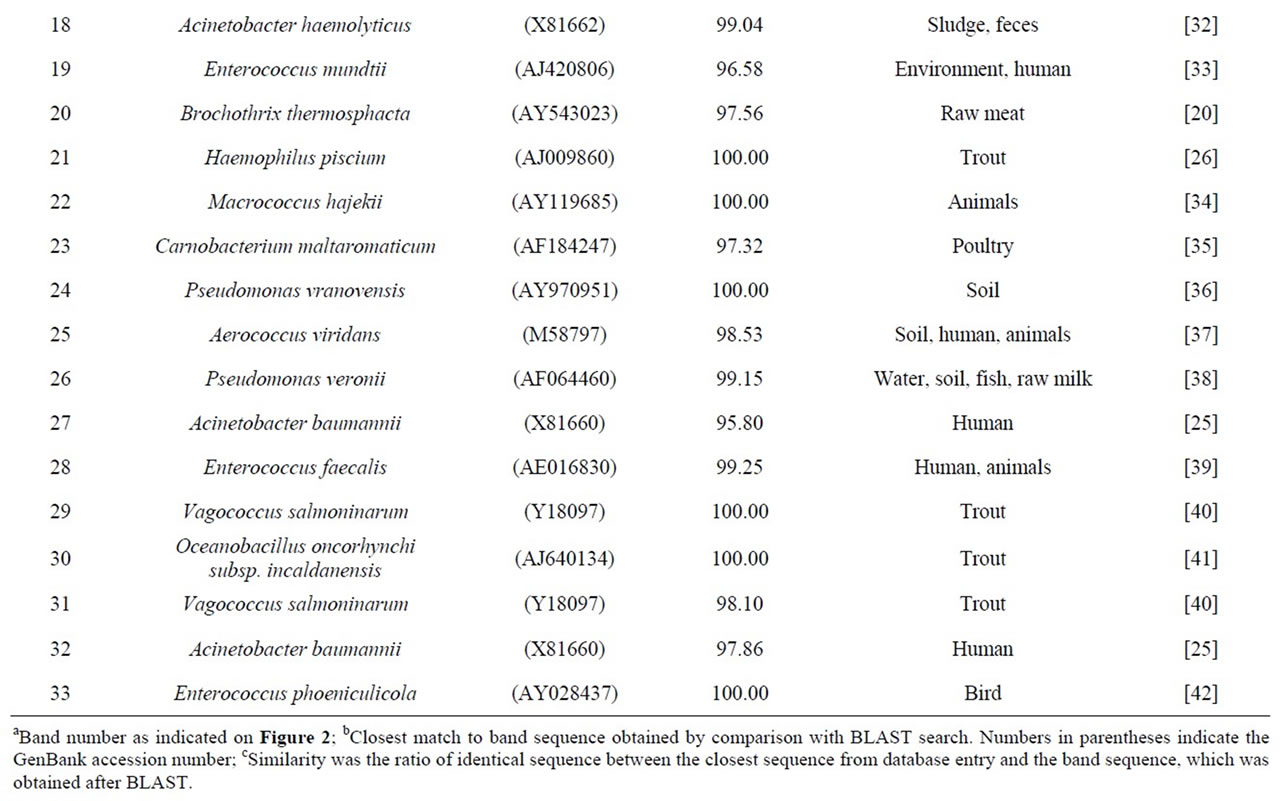
Table 1. Identification of bands obtained by PCR-DGGE based on the V3 region of 16S rRNA and the closest sequence match of known bacteria in other references.
gastrointestinal pathogen, may induce “travelers’ diarrhea” [17]. Edwardsiella ictaluri, a fish pathogen, causes enteric septicemia of catfish (ESC) [50]. Haemophilus piscium may lead to trout ulcer disease [26]. Shewanella spp are commonly isolated from marine fish and the marine environment [23,29]. Shewanella putrefaciens is an opportunistic pathogen, which causes soft tissue infection and bacteremia in human [51]. Serratia ureilytica, first isolated from water, can utilize urea and metabolize chitin-containing marine life by producing proteases and chitinase, leading to shellfish spoilage [21,52].
Harmful bacteria were also detected in frozen samples, though with less frequency than in fresh fish. Carnobacterium viridans, a facultative anaerobic psychrophilic bacteria, has been identified in packaged sausage in other studies and this bacterium causes spoilage and green discoloration [22]. Vagococcus salmoninarum, a fish pathogen, may cause hyperaemia and haemorrhage in gills and viscera [40,53]. Enterococcus faecalis is a primary human fecal contamination indicator for microbial source tracking (MST). Enterococcus faecalis is also reported to induce most enterococcal infections, includeing endocarditis, bacteremia, urinary tract infections, and intra-abdominal infections [39].
Pseudomonas spp. are ubiquitous in the environment. Pseudomonas vranovensis has been isolated from soil and Pseudomonas veronii from water [36,38]. Several Pseudomonas species are spoilage bacteria or pathogens, but no cases indicated that the two species detected in this study have ever induced food spoilage or foodborne disease. Kluyvera intermedia is very common in surface water and soil, as well as from human sources [18].
Some waterborne bacteria are frequently found in fresh fish, such as C. maltaromaticum, P. shigelloides, E. ictaluri, O. beijerinckii, Shewanella spp., and S. ureilytica. Furthermore, microorganisms such as K. intermedia, Enterrococcus spp., Lactococcus spp. and Pseudomonas spp. are widely distributed in the environment. Thus, fish might have acquired these bacteria from various pathways: water, harvesting, transportation, storage, etc. Banding pattern analysis showed the bacterial community from frozen fish samples were clustered clearly in accordance with the fish types (Figure 4(b)), but the bacterial community from both types of the fresh fish were mixed together (Figure 4(a)). This implies that freezing acts as a selective pressure by inactivating some microorganisms while favoring others that are more resistant to temperature stress in each type of fish, which make the bacterial community of the frozen fish samples more dependent on the fish types. Some waterborne bacteria were still detectable in frozen fish, such as C. maltaromaticum, S. quinivorns, O. oncorhynchi subsp. Incaldanensis, S. japonica and V. salmoninarum. Others, such as A. viridans, Enterococcus spp., K. intermedia and M. hajekii may be from water or fish processing. As shown in the analysis of bacterial community, storage conditions appear to be highly significant in the shift of species composition of the bacterial community found in fish samples. Some pathogens, such as Vibrio, Salmonella, or Listeria, that usually cause seafoodborne outbreaks were not detected in this study. It may be because the samples were collected from supermarkets where good handling is practiced in most steps. Another reason might be the limitation of DGGE in detecting bacterial community from the food samples since not all the bands were successfully sequenced. Out of the 94 bands that were sequenced, some of them could not be accurately confirmed since the gene similarity was below 95% when compared with the Genebank database. The identification results from these bands were not included in this study.
5. Conclusion
Somatic release agent (SRA) was used to remove the fish matrix for efficient extraction of bacterial DNA and 16S rRNA gene amplification. This was much more effective than the traditional multiple centrifugation method. PCRDGGE was an easy and feasible technique to analyze the bacterial population of fish samples. Banding patterns and sequencing results indicated that the bacterial diversity differs between fish types and is affected by storage conditions. Spoilage bacteria and pathogens from fish samples were mainly from the environments (e.g. water or soil); however, human factors, such as post-harvesting processing, were considerable. Recommendations for food handlers and retailers are using appropriate sanitizers for minimizing microbial contamination from harvesting to retail chain.
6. Acknowledgements
The authors thank Jonathan Lutz for his help in editing the manuscript, Minseok Kim and Jill Stiverson for their kind support in experiments and data analysis.