Study on the Leaf Traits of Aus Rice Varieties in Various Soil Moisture Levels ()

1. Introduction
Water deficit is a major problem of growing rice, especially in low rainfall season (Usman et al., 2013) [1] . According to the IRRI (2005) [2] , water deficit is one of the major constraints to rice cultivation and production. Rice is more susceptible to drought than any other crops. It is estimated that the world needs to produce 40% more rice to feed the population by 2025 (FAO, 2002) [3] .
The leaf area is an important trait which is related to plant canopy photosynthetic and dry matter production. Leaf is the main light harvesting organ. Biswal and Kohli (2013) [4] observed a positive correlation between leaf traits and yield under drought. Zubaer et al., (2007) [5] stated that the interaction effect of different moisture levels and rice genotype of leaf area per hill at all growth stages was significant. They also reported that at booting stage, the highest leaf area was found and the leaf area was reduced with the reduction of moisture levels. It was also reported that the reduced soil moisture levels produced lower leaf area which might be due to inhibition of cell division of meristematic tissue under water starved condition Aggarwall and Kodundal, (1988) [6] and Hossain, (2001) [7] . Anthocyanin content was increased under water stress condition. Leaf accumulates anthocyanins under drought conditions and the colour increased as the intensity of water deficit condition. Scott (1999) [8] stated that anthocyanin were water soluble pigments found in all plant tissues. Krol et al., (1995) [9] and Burger and Edwards (1996) [10] found that anthocyanins had been located in the root, shoot and leaves. Anthocyanins had been found in or just below the upper epidermis of leaves and often appear at specific developmental stages found that anthocyanins usually appear red in leaf cells, but depending on their chemical nature and concentration, the vacuolar pH, and interactions with other pigments, they can result in pink, purple, blue, orange, brown, and even black leaf colors.
It was also reported that the exposure of plants to drought stress substantially decreased the leaf water potential, relative water content and transpiration rate, with a concomitant increase in leaf temperature (Siddique et al., 2001) [11] . It was reported that although components of plant water relations are affected by reduced availability of water, stomatal opening and closing is more strongly affected by the extent of moisture supply. Under water stress condition RWC were significantly reduced. RWC declined with increasing drought stress. Relative water content of leaves is higher in the initial stages of leaf development and declines as the dry matter accumulates and leaf matures. RWC is related to water uptake by the roots as well as water loss by transpiration. Zulkarnain et al., (2009) [12] also observed that the relative water contents of different rice varieties were similar under the well-watered condition. However, RWC declines progressively in stressed plots with the development of severe water deficit. They also reported that the tolerant has relatively higher water content than the other varieties, even after 10 days of exposure to soil drying. Sinclair and Ludlow (1985) [13] proposed that RWC is a better measure for plant’s water status than thermodynamic state variables (water potential, turgor potential and solute potential). Severe water stress may result in the arrest of photosynthesis in leaf, disturbance of metabolism and finally the death of plant (Jaleel et al., 2008c) [14] . Hence, water stress management strategies need to be taken for better yield and improved varieties that are more resilient to abiotic stresses. Considering the above mentioned facts, the present research work was undertaken to achieve the following objectives to study on the leaf traits of aus rice varieties in various soil moisture levels.
2. Materials and Methods
The experiment was conducted at the Plant Physiology Laboratory (central laboratory) and Agricultural research field of Agricultural Botany, Sher-e-Bangla Agricultural University, Dhaka-1207, Bangladesh under polythene shed controlling the intrusion of rainfall during the period from March to July 2014.
2.1. BRRI Materials
Three BRRI materials as BRRI dhan55 (V1), BR6976-2B-15 (V2) and tolerant check Hashikalmi (V3) were collected from Genetic Resource and Seed Division, Bangladesh Rice Research Institute.
2.2. Methods, Design and Treatment
Seven drought conditions were used as treatments that started from 20 days of seedling age. The pot experiment was done with Randomized Complete Block Design (RCBD). Three replications, three genotypes and seven irrigation treatments (63 pots) were used.
T0 = Irrigated continuously throughout the experimental period (control).
T1 = Drought condition during 7 days, when the age of the seedling was 20 days.
T2 = Drought condition was applied for second 7 days, when the age of the seedling was 35 days.
T3 = Drought condition was applied for third 7 days, when the age of the plant was 55 days.
T4 = Drought condition was applied for fourth 7 days, when the age of the plant was 75 days.
T5 = Drought condition was applied for fifth 7 days, when the age of the plant was 95 days.
T6 = Drought condition was applied for sixth 7 days, when the age of the plant was 115 days.
2.3. Seed Sowing
Before sowing seeds of uniform size and shape of each genotype were treated with Bavistin 5 gm for 20 minutes. The solution was prepared by dissolving 5 g of Bavistin in 1/2 liter of water. Cured seeds were place in the Petridis with water (Plate 1). Pre-soaked sprouted seeds were sown on March, 2014 in earthen pots under the rain protected polyethylene shade.
2.4. Pot Preparation and Fertilizer Management
Earthen pots of 38 cm × 25 cm in size were used and filled up with 10 kg sandy loam soil. The soil of the experimental area was sandy and sandy loam. The soil of the pot was fertilized uniformly with 0.9, 0.8, 0.8 g urea, triple super phosphate and muriate of potash corresponding to 160-150-150 kg urea, triple super phosphate and muriate of potash per hectare respectively (BRRI, 2008) [15] .
2.5. General Observation of the Experiment
After seedling establishment, three uniform and healthy seedlings were allowed to grow per pot. The sprouted seeds were normally irrigated for ensuring normal growth. Water stress was imposed for seven days, when the age of the plant was 20, 35, 55, 75, 95 and 115 days.
2.6. Detailed Procedures of Recording Data
Different leaf trait parameters are leaf area, dry weight of leaf, number of leaf, SPAD reading, stomatal conductance ( leaf temperature, leaf humidity), specific leaf area (SLA), specific leaf weight (SLW), leaf weight ratio (LWR), relative water content (RWC).
Leaf Area
Ten leaves were selected from plant samples and their length and breadth were measured and was multiplied by a factor of 0.75 (Yoshida, 1981) [16] . Leaf area was measured with the following formula:
where, k = adjustment factor (0.75),
l = length of a leaf blade,
w = breadth of a leaf blade.
The Leaves were packed with brown paper and oven dried for 72 hours at 72˚C. Dry weight of leaves was recorded.
Dry Weight and Number of Leaf
Leaf dry weight were collected and counted number of leaf.
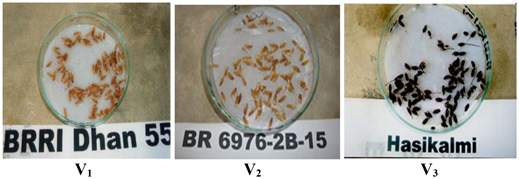
Plate 1. Cured seeds of V1 (BRRI dhan55), V2 (BR 6976-2B-15) and V3 (Hashikalmi) were place with water in the Petridish.
SPAD Reading
SPAD reading was recorded with SPAD meter.
Stomatal conductance (leaf temperature and leaf humidity).
Stomatal conductance (leaf temperature, leaf humidity) were measure by porometer at 8.00 am and at 12.00 am in all genotypes.
Specific leaf area (SLA), specific leaf weight (SLW), leaf weight ratio (LWR).
Specific leaf area (SLA), specific leaf weight (SLW), leaf weight ratio (LWR) were calculated with the following formula -
Relative Water Content (RWC)
RWC was determined to give indication on the plant water status under drought condition. The fully developed the leave of each genotype were carefully collected at anthesis. Immediately after cutting at the base of lamina, leaves were sealed within plastic bags and quickly transferred to the laboratory. Fresh weights were determined immediately or within 2 h after excision. Turgid weights were obtained after soaking leaves in distilled water in test tubes for 16 to 18 h at room temperature (about 20˚C) and under the low light conditions of the laboratory. After soaking, leaves were quickly and carefully blotted dry with tissue paper in preparation for determining turgid weight. Dry weights were obtained after oven drying the leaf samples for 72 h at 70˚C. The fresh, turgid and dry weights of the leaves were used to calculate the relative water content of leaves Ghannoum et al., (2002) [17] as follows-
Extraction of Anthocyanins
According to Mehrtens et al., (2005) [18] anthocyanins were extracted from rice leaves. In the study, total anthocyanins were extracted from rice leaves using methanol and 1% HCL. Just after collection fresh sample were grounded finely with mortar and pastel. After grinding, samples were incubated overnight at room temperature in extraction buffer. 0.5 g finely ground sample place in 15 ml centrifuge tube and 60 ml of methanol were added with 1.6 ml HCL. Homogenates/extracts were centrifuged at 16,000 g for 15 min and absorption of the extracts was determined at 530 and 657 nm by spectrometer. Then, anthocyanins were quantified according to the formula proposed by Mehrtens et al., (2005) [18] as follows: QAnthocyanins = (A530 ? 0.25 × A657) × M−1; QAnthocyanins: amount of anthocyanins, A530: absorption at 530 nm wavelength, A657: absorption at 530 nm wavelength, M: fresh weight (g) of the tissues (60 ml MEOH and 1.6 ML 37%
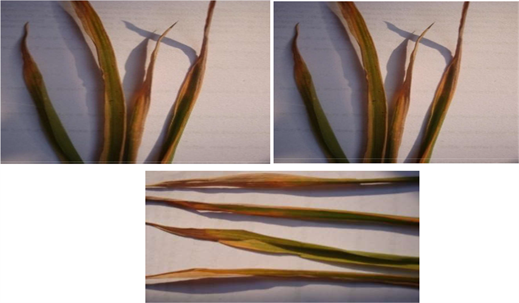
Plate 2. Red color leaf (anthocyanin content) of different rice genotypes after water stress conditions.
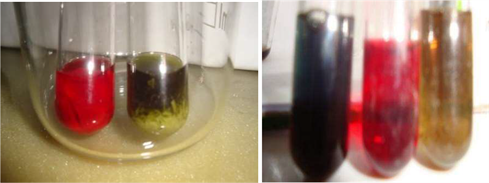
Plate 3. Leaf anthocyanin analysis of different rice genotypes under water stress conditions.
HCL) (Plate 2 and Plate 3).
2.7. Statistical Analysis
The data were analyzed and the means were separated by DMRT at 5% level of significance using the statistical computer package program MSTAT-C (Russell, 1986) [19] .
3. Results and Discussion
The objectives of the study were to assess the effects of different duration of water stress on leaf traits of different rice genotypes and the results of this experiment have been presented in the form of tables and figures along with necessary discussion in this chapter.
3.1. Leaf Area
Leaf area of different rice genotypes under drought condition have been shown in Tables 1-3. Significant differences were found among the varieties, the treatments and interaction effect for the characters of leaf area. In case of varietal effect the highest leaf area found was 44 cm2 in Hashikalmi followed by 39.03
![]()
Table 1. Varietal effect of leaf area, no of leaf and specific leaf area (cm2/g) of three rice genotypes under drought condition.
Values followed by some letter (s) indicate significantly different from each other by DMRT at 5% level.
![]()
Table 2. Effect of drought treatment on leaf area, number of leaf and specific leaf area (cm2/g) of three rice genotypes under drought condition.
Values followed by some letter (s) indicate significantly different from each other by DMRT at 5% level.
![]()
Table 3. Interaction effect of variety and drought treatment number of leaf, leaf area and specific leaf area (cm2/g) of three rice genotypes under drought condition.
Values followed by some letter (s) indicate significantly different from each other by DMRT at 5% level.
cm2 in BRRI dhan55 and the lowest was 38.33 cm2 in BR 6976-2B-15 (V2). In case of treatment effect the highest leaf area found was 44.11 cm2 in control (T0) and the lowest found was 38 cm2 in T1. In case of interaction effect the highest leaf area found was 46.86 cm2 in V3T6 and the lowest was 20.99 in V1T3, V3T3. Due to drought stress the highest leaf area was found in Hashikalmi followed by BRRI dhan55 the lowest was in BR 6976-2B-15.
In this study, leaf area varied significantly under water stress condition. The results of the experiment have the similarity with the results of Eastham et. al., (1984) [20] who reported that leaf expansion is most sensitive to water stress and leaf growth can be drastically reduced. Kusaka et al., (2005) [21] found that development of optimal leaf area is important to photosynthesis. Kramer and Boyer (1995) [22] also mentioned drought stress suppresses leaf expansion, tillering and midday photosynthesis and reduces photosynthetic rate and leaf area due to early senescence. The leaf growth was more sensitive to water stress in wheat than in maize and sunflower Vigna unguiculata Manivannan, (2007 and 2008) [23] . Water stress greatly suppresses cell expansion and cell growth due to the low turgor pressure. Water deficit stress mostly reduced leaf growth and in turn the leaf areas in many species of plant like Populus (Wullschleger et al., 2005) [24] and soybean (Zhang et al., 2004) [25] .
3.2. Number of Leaves per Plant
Numbers of leaves per plant of different rice genotypes under drought condition have been shown in Tables 1-3. Significant difference among the genotypes, the treatments and interaction effect for the character number of leaf was found. In this study, (varietal affect) the highest number of leaf found was 48.72 in Hashikalmi and the lowest found was 37.61 in BR 6976-2B-15 (V2) under drought condition. In case of treatment effect the highest no of leaf found was 49.44 in T0 and the lowest was 37.61 in T1. In case of interaction effect the highest no of leaf found was 49.38 in V1T0 and the lowest was 35.33 in V2T3 and V3T3.
In this study the highest number of leaf was found in Hashikalmi and the lowest was found in BR 6976-2B-15 (V2) under drought condition which was significantly different among the genotypes. The results of the experiment has agreement with the results of Zubaer et al. (2007) [5] who stated that the number of leaves per hill varied significantly under different moisture levels, the highest number of leaves was found in 100% FC. At booting stage, Binadhan 4 produced the highest number of leaves per hill followed by Basmoti.
3.3. Specific Leaf Area (SLA)
Specific leaf area of different rice genotypes under drought condition have been shown in Tables 1-3. Significant difference among the genotypes, the treatments and interaction effect for specific leaf area was found. In case of varietal effect, the highest specific leaf area found was 196.0 (cm2/g) in V3 (Hashikalmi) and the lowest specific leaf area found was 186.6 (cm2/g) in BR6976-2B-15 (V2). In case of treatment effect the highest specific leaf area found was 198.3 cm2/g in T0 and the lowest specific leaf area was 184 (cm2/g) in T2. In case of combination effect the highest specific leaf area found was 195.2 (cm2/g) in V1T0 and the lowest specific leaf area found was 179 (cm2/g) in V2T2.
The results have similarity with et.al. (2004) [26] who stated that drought stress significantly decreased SLA in severe water stress, this adaptive mechanism of cowpea to water stress helps in reducing water loss from the evaporative surfaces.
3.4. SPAD Reading from Vegetative to Maturity
SPAD reading of different rice genotypes under water stress duration have been shown in Tables 4-6. SPAD reading was recorded from the flag leaf of all tillers and average value was taken during the growth period after 7 days interval from vegetative to maturity. Significant different among the genotypes, the treatments and interaction effect for SPAD value. In case of varietal effect the highest SPAD value found was 35.73 in Hashikalmi (V3) followed by 35.27 in BRRI dhan55 (V1) and the lowest SPAD value found was 34.25 in BR 6976-2B-15 (V2). In case of treatment effect, the highest SPAD value found was 35.45 in T0 and the lowest SPAD value was 33.20 in T6 which were not significantly different among the treatment. In case of combination effect (variety and treatment) the highest SPAD value found was 38.88 in V1T0 and the lowest SPAD value was 32.13 in V2T6.
SPAD value represents the greenness of the leaf. In this study, SPAD value was recorded from the flag leaf of all tillers and the average value was taken during vegetative to maturity. At vegetative stage SPAD reading was recorded around 35 to 39. SPAD value was recorded ranging from 37 to 39 BRRI dhan55 during anthesis. After anthesis SPAD value slightly increased and then gradually decreased with advanced towards maturity. In this study, due to drought conditions the highest SPAD value was found in V3 Hashikalmi followed by BRRI dhan55 (V1) and the lowest SPAD value was found in BR 6976-2B-15 (V2) which was not significantly different among the genotypes. This result has similarity with the result of Zhang and Kirkham (1996) [27] who advocated that decreased of chlorophyll content during drought stress depending on the duration and severity of drought level. Decreasing of chlorophyll content in plants such as Paulownia imperialis (Astorga, 2010) [28] , bean (Beinsan et al., 2003) [29] was reported under drought stress.
3.5. Relative Water Content (RWC) of Flag Leaf
The relative water content of leaf of different rice genotypes under water stress duration have been shown in Tables 4-6. There was a significant difference among the genotypes, and the interaction effect for relative water content. In case of varietal effect the highest relative water content was found 95.2% in BRRI dhan55 followed by 90% in Hashikalmi and the genotypes BR 6976-2B-15 (V2) had the lower RWC found was 80.18% under drought condition which was significantly different among the variety. In case of treatments effect T0 had shown the higher RWC content (99.1) while lower RWC found was 90.2. In case of interaction affects V1T0 had higher RWC 121.4 in V3T0 and lower RWC 71.52 in V2T6 under water stress condition.
In this study, under water stress condition RWC declined. RWC were reduced in various genotypes at different growth stage. RWC was determined to give indication on the plant water status under drought condition. Among the genotypes BRRI dhan55 (V1) had higher RWC content while genotypes BR 6976-2B-15 (V2) had lower RWC. Drought stress significantly reduced RWC due to higher evaporation and water stress. The relative water content of leaf depends on the moisture content of the soil and the water absorbing capacity of the root. RWC of different crops was the highest in the morning and gradually decreased. The results has the similarity with the results of Chowdhury et al., (1985) [30] stated that relative water content (RWC) values of seven genotypes at three different growth stages water stress significantly reduced RWC in the morning (8:00 am) and also at noon (1:00 pm). Several researchers reported that RWC of different crops was the highest in the morning and gradually decreased thereafter (Paul and Aman, 2000) [31] . Zulkarnain et al., (2009) [12] stated that the relative water contents of different rice varieties were similar under the well-watered treatment on different measurement occasions and it declined progressively in stressed plots with the development of severe water deficit. The differences among the rice varieties in terms of the rate of decline in the leaf RWC could also be associated with the variations in other physiological responses to water stress, such as reduction in stomatal conductance. Kumar et al., (2014) [32] was found a significant difference in RWC among different rice varieties between drought stress and irrigated treatment.
![]()
Table 4. Varietal effects of SPAD value, RWC and leaf dry weight of rice genotypes under water stress.
Values followed by some letter (s) indicate significantly different from each other by DMRT at 5% level.
![]()
Table 5. Effect of drought treatment on SPAD value, RWC and leaf dry weight of rice genotypes under water stress.
Values followed by some letter (s) indicate significantly different from each other by DMRT at 5% level.
![]()
Table 6. Interaction effect of variety and drought treatment on spade value, RWC and leaf dry weight of three rice genotypes under water stress.
Values followed by some letter (s) indicate significantly different from each other by DMRT at 5% level.
3.6. Leaf Dry Weight
Leaf dry weight of different rice genotypes under drought condition have been shown in Tables 4-6. There was a significant difference among the genotypes, the treatments and interaction effect for leaf dry weight. In case of varietal effect the highest leaf dry weight found was 0.26 g in BRRI dhan55 followed by 0.25 in V3 (Hashikalmi) and the lowest leaf dry weight found was 0.23 in BR 6976-2B-15 (V2). In case of treatment effect the highest leaf dry weight found was 0.21 in T0 and the lowest leaf dry weight content found was 0.17 in T5, T5 which was significantly different among the treatments. Combination effect of variety and treatment the highest leaf dry weight found was 0.26 in V1T0 and the lowest was 0.12 in V2T1.
Liu et al. (2004) [26] stated that drought stress significantly decreased plant total dry mass, but the proportion of changes differed among root, stem and leaf, whereas leaf dry mass ratio was decreased.
3.7. Anthocyanin Content of Leaf
Anthocyanin content (QAnthocyanins = (A530 − 0.25 × A657) × M−1) of different rice genotypes under drought condition have been shown in Figure 1. Here the highest anthocyanin content was found in 0.464 in BRRI dhan55 (V1) followed by 0.402 in Hashikalmi (V3) and the lowest found was 0.305 in V2 (BR 6976-2B-15). Anthocyanin content was increased under water stress condition. The lowest anthocyanin content was 0.0062 which was well water green color leaf.
In the study, anthocyanin content was increased under water stress condition. Leaf accumulates anthocyanins under drought conditions and the red color
![]()
Figure 1. Anthocyanin content of three rice genotypes under water deficit conditions.
increased as the intensity of water deficit increased. Under drought condition BRRI dhan55 (V1) produced more anthocyanins followed by Hashikalmi (V3) to survive plant against stress conditions. This results has the similarity with the results of Scott (1999) [8] who stated that anthocyanin were water soluble pigments found in all plant tissues due to stress condition. Andersen and Jordheim (2006) [33] reported that anthocyanins usually appear red color in leaf cells due to stress condition, but depending on their chemical nature and concentration, the vacuolar pH and interactions with other pigments, they can result in red, pink, purple, blue, orange, brown, and even black leaf colors. Krol et al., (1995) [9] and Burger and Edwards (1996) [10] also mentioned anthocyanins had been located in the root, shoot and leaves. Anthocyanins had been found in or just below the upper epidermis of leaves. Davies (2004) [34] published the articles that coloration have assumed red foliage to be the outcome of the production of anthocyanins on plant.
The mechanism of Anthocyanin content
Anthocyanins are polyphenol compounds a group of polyphenolic pigments found in nature, which contribute vivid colors to many fruits and vegetables, Anthocyanins slowly degrade over time and mechanisms causing degradation. In order to understand the mechanistic changes, different techniques were employed to understand Anthocyanins transformations.
Anthocyanins act as photo protective light screen, quenching excess photons and, thereby, mitigate photo inhibitory and photo-oxidative damage (Steyn et al., 2002) [35] and Merzlyak et al., (2008) [36] . Anthocyanins neutralize reactive oxygen and nitrogen species compounds ascorbic acid and α-tocopherol do (Wang et al., 1997) [37] . Anthocyanins are synthesized from the flavonoid biosynthetic pathway derived from the general phenylpropanoid pathway. Flavonoids play important roles in plants, such as pigmentation, plant reproduction by recruiting pollinators and seed dispersers and by stress protection. Anthocyanins scavenging free radicals and reducing the oxidative stress. Anthocyanins act as H-atom donator or as single electron transfer. Anthocyanin molecules will change their color depending upon the pH of their environment Fossen et al., (1998) [38] . Anthocyanins are photo protective agents which shade and protect the photosynthetic apparatus by absorbing excess visible and UV light and scavenging free (Guo et al., 2008) [39] .
Anthocyanins have a higher antioxidant activity than other flavonoids, due to their positively charged oxygen atom (Kong et al., 2003) [40] . The antioxidant activity of anthocyanins depends on the degree of hydroxylation at the B-ring as well as the type and extent of acylation and glycosylation (Sadilova et al., 2006) [41] . Hydroxylation at the B-ring enhances antioxidant capacity (−OH > −OCH3 >> −H), therefore the antioxidant capacity of anthocyanins decreases in the order of Dp > Pt > Mv = Cy > Pn > Pg (Pojer et al., 2013) [42] . Furthermore, glycosylation reduces the free radical scavenging ability of anthocyanins compared to their aglycone forms, by decreasing their hydrogen-donating, metal-chelating and electron delocalizing abilities (Zhao et al., 2014) [43] . Finally, acylation of glycosyl moieties may partly circumvent the negative effect of glycosylation (Lachman and Hamouz, 2005) [44] . In summary, antioxidant activity increases with the number of hydroxyl groups in the B-ring and decreases with the number of glycosyl groups attached to the A and C ring. The latter effect is less severe when the glycosides are acylated.
The photo protective role of anthocyanins is seen in juvenile expanding leaves, because anthocyanin accumulation correlates with development of photo stability (Drumm-Herrel & Mohr, 1985) [45] . Anthocyanins are thought to act as osmoregulators under drought stress, because many drought-tolerant plant species contain anthocyanins (Chalker-Scott, 1999) [8] . In turn, plant tissues containing anthocyanins are usually rather resistant to drought (Chalker-Scott, 1999) [8] . Consistently, drought stress decreases chlorophyll concentration.s Furthermore, soluble protein concentrations are reported to decrease under drought stress Moran et al., (1994) [46] and Parry et al., (2002) [47] .
3.8. Stomatal Conductance
Stomatal conductance of different rice genotypes under drought condition have been shown in Figure 2 to Figure 3. In the study, stomata conductance decreased in the varieties of rice after drought condition. Before stress the highest stomatal conductance was 1502.7 (µmol/m−2s−1) in BRRI dhan55 followed by 1490.5 (µmol/m−2s−1) in Hashikalmi and the lowest was 861.4 (µmol/m−2s−1) in BR6976-2B-15. After stress the highest stomatal conductance was 187.5 (µmol/m−2s−1) in BRRI dhan55 followed by 173.7 (µmol/m−2s−1) in Hashikalmi and the lowest was 135.1 (µmol/m−2s−1) in BR6976-2B-15.
In the study, stomatal conductance declined in case of all varieties of rice under drought condition. After stress condition stomatal conductance was highest in BRRI dhan55 followed by Hashikalmi and lowest in BR6976-2B-15. In case of treatment effect before water stress stomatal conductance was high and gradually decreases under drought condition. At the beginning of this experiment stomata conductance of 1st to 3rd stress was high in all the genotypes and gradually
![]()
Figure 2. Stomata conductance before and after stress of three rice genotypes under drought condition.
![]()
Figure 3. Stomata conductance at 15 DAS (1st), 35 DAS (2nd), 61 DAS (3rd), 81 DAS (4th), 101 DAS (5th), 121 DAS (6th) days drought condition stress of rice genotypes.
declined as the intensity of water deficit increased and then in recovery stage conductance was increased. Stomata conductance of different rice genotypes was decreased under drought condition. The results conform to the results of Hirasawa (1999) [48] who showed that stomata conductance decreased in all the varieties of rice as the intensity of water deficit increased. Rice is a notoriously drought-susceptible crop due in part to its rapid stomatal closure and little circular wax during mild water stress. Zulkarnain et al. (2009) [12] reported that the decline in stomatal conductance was faster after 6 days of stress development than under well-watered condition. Stomatal conductance of MR220 and MUDA declined more rapidly than in other varieties.
3.9. Leaf Temperature
Leaf temperature of different rice genotypes under drought condition has been different in Figure 4. The lower leaf temperature was at 8.00 am and at 12.00 am leaf temperature was high in all the genotype under drought condition. In the morning leaf temperature was (33.2 - 33.6)˚C in BR6976-2B-15 followed by Hashikalmi and BRRI dhan55 comparatively low and gradually increased in the noon 12 am (34.4 - 34.7)˚C under water stress condition. Leaf temperature was higher in drought stressed plant than in well-watered plants. Leaf temperatures of Hashikalmi were lower than that of BR6976-2B-15. The plants that showed a lower leaf temperature also showed a higher photosynthetic rate. Higher leaf temperature also showed a lower photosynthetic rate. So, under drought condition leaf temperature was higher and before drought condition leaf temperature was lowest. The results would compare with Siddique et al. (1999) [11] who reported that leaf temperature in drought stressed plant were higher than in well-watered plants at both vegetative growth and anthesis growth stages. Lower leaf temperature was associated with a higher photosynthetic rate. Leaf temperatures of Sonalika and Kalyansona were significantly lower than that of C306.
3.10. Leaf Humidity (%)
Leaf humidity of different rice genotypes under water stress condition have been shown in Figure 5. Before water stress condition leaf humidity was high in all varieties. At the starting stage of water stress treatment the leaf humidity was higher which gradually decreases after water stress treatment. Leaf humidity was depended on severity of water stress and duration of water stress condition. The results conform to the results of Liu et.al., (2004) [26] who stated that drought stress significantly decreased specific leaf area can be used to estimate the reproductive strategy of a particular plant based upon light and moisture (humidity)
![]()
Figure 4. Effect of leaf temperature before and after drought stress of three rice genotypes.
![]()
Figure 5. Effect of water stress on leaf humidity of leaf at before and after stress of three rice genotypes.
levels, among other factors.
3.11. Specific Leaf Weight (SLW)
Specific leaf weight (SLW) is defined as the mass of leaf dry matter per unit of leaf area. SLW also expressed the thickness of leaf. Specific leaf weight (SLW) of different rice genotypes under water stress condition have been shown in Figure 6. The plant with higher SLW (thick leaf) possesses more mesophyll cells for photosynthesis. SLW gradually increased with decreasing soil moisture content. But there were no significant difference among the treatments in those genotypes. The highest specific leaf weight (SLW) found was 6.88 mg/cm2 in BRRI dhan55 and the lowest SLW found was 6.15 mg/cm2 in BR 6976-2B-15 (V2).
![]()
Figure 6. Effect of water stress on specific leaf weight (SLW) of three rice genotypes.
4. Conclusion
Considering the above statement, water stress mostly reduced leaf growth. It was revealed that BRRI dhan55 and Hashikalmi showed the relatively higher leaf area and specific leaf area, comparatively higher leaf investment and relative water content of leaf under water stress condition. Water stress significantly reduced RWC due to higher evaporation resulting from increased temperature. Leaf accumulates anthocyanins under drought conditions and the red color increased as the intensity of water deficit increased. Stomatal opening and closing is more affected by water stress. Based on the above discussion, it was revealed that, under various water stress conditions BRRI dhan55 and Hashikalmi are suitable for cultivation in drought-prone areas of Bangladesh.
Acknowledgements
We thank anonymous reviewers for their kind review of the manuscript. This research was supported by Sher-e-Bangla Agricultural University Research System (SAURES) and HEQEP (Higher Education Quality Enhancement Project) for providing financial support to conduct the research work.
Authors’ Contributions
This work was carried out in collaboration among all authors. Author HSJ conducted the research work. KUA designed and supervised the study and edited the manuscript. Author HSJ managed the literature searches and JKB collected genotypes from Genetic Resource and Seed Division, Bangladesh Rice Research Institute. All authors read and approved the final manuscript.