Origin of Erosion and Hydraulic Problems of the San Roque Underground Arched Culvert Channel and Its Relationship with the Maximum Flow Rate and the Maximum Permissible Velocity ()
1. Introduction
In Mundo et al. [1] the document describes in great detail the number of components of a UACC. They are generally made up of three elements: foundation, stirrups, and the semicircular arch, however, Figure 1 shows other elements. In Mexico, as in many Latin American countries, the UACC is used to drain rain and untreated wastewaters of a city.
The UACC in Mexico is more of a problem than a solution because they are permanent sources of contamination. Inside those structures live multiple faunas
that spread harmful diseases, such as rodents, cockroaches, and mosquitoes. Rodents are transmitters of a huge variety of zoonotic diseases [2]. The Chagas disease (American Trypanosomiasis) is typical of the American Continent (AC in its English acronym), and it has become a global problem due to migration. Rats (Rattus rattus) are natural reservoirs of this disease. It is also possible that cockroaches contribute to the Chagas disease spread because they feed off of triatomine bugs, carriers of the parasite [3]. Rats and cockroaches come from the UACC and get inside homes, contaminating the space. When they move around or eat human food, they pollute with bacteria (especially salmonella), protozoan cysts, viruses (especially coxsackievirus), and Aspergillus fungus, which they transport after being in contact with feces in the sewages that serve as their refuge [4]. On the other hand, mosquitoes (Aedes, Anopheles, Culex) reproduce abundantly in calm waters and untreated residual waters. They transmit dengue, dengue hemorrhagic fever, chikungunya disease, and malaria, which can be mortal.
The UACC can be a permanent source of fetid smells due to toxic gases from untreated wastewaters such as methane, ammonia, chlorine dioxide, hydrogen chloride, hydrogen sulfide, nitric oxide, and ozone. These gasses not only contaminate the environment and the surrounding residential areas but also irritate the eyes and throat of people who live close to a UACC.
However, the greatest danger of living close to a UACC is the constant risk of collapse due to structural failure by an earthquake or flood, as shown in [1]. Actually, in Mexico, thousands of people live in vulnerable areas. More than 900 people live over the UACC in the Verdiguel river in Toluca. In just a small 4 km stretch over the UACC in Zacatecas live more than 2000 people (in the historical center of the city), while in the San Roque UACC in Tuxtla Gutierrez city, 655 people live in the risk areas around the structure. All the UACC mentioned before have suffered collapses in some sections, most of them associated with structural problems and floodings, among other reasons: lack of maintenance, severe erosion problems, abrasion cavity formations (due to excessive flow speed in the OCH), and missing hydraulic capacity. In order to analyze hydrological risks and floods, in this research the following methodology was used: its study of rainfall in the last 50 years in the basin, was analyzed the probability of distribution by the Gumbel method, it constructed Intensity-Duration-frequency curves (IDF). The IDF curves were constructed from 5 to 500 años, because is the best technical recommendation for heavily populated cities. Finally, the water flows for different IDF were estimated with the rational method. The maximum speeds allowed in the UACC were calculated with the Manning-Strikler.
2. Background
A section of the San Roque UACC collapsed on September 2nd, 2016. A portion of the street (50 meters approximately) built with hydraulic concrete broke and brought down a residential home that was just above the UACC while ten surrounding houses suffered severe structural damage (Picture 1). The runoffs generated from a 102 l/m2 rain caused this disaster [1].
A couple of years later, another small section of the San Roque UACC caved in due to heavy structural damage (Picture 2). The collapse happened right beside Fray Matías de Córdoba elementary school in Tuxtla Gutierrez city. Fortunately, the incident didn’t cause any harm to students, adjacent houses, and pedestrians.
Pérez et al. [5] studied a section of the San Roque UACC formed by a vault covered of reinforced concrete and a reinforcing concrete beam that crosses the UACC. The reinforcing concrete beam is a support element for the concrete slab above it for a street intersection. Both, the vault covered of reinforced concrete as the beam have carbonation and severe corrosion in the reinforcement steel
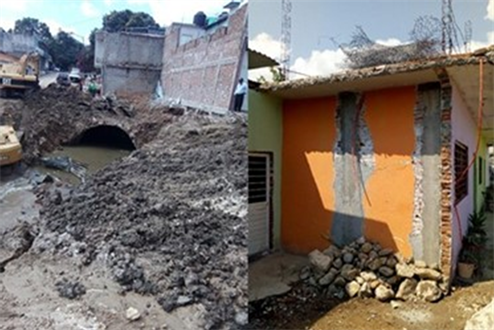
Picture 1. Collapsed house and damaged house on September 2nd, 2016.
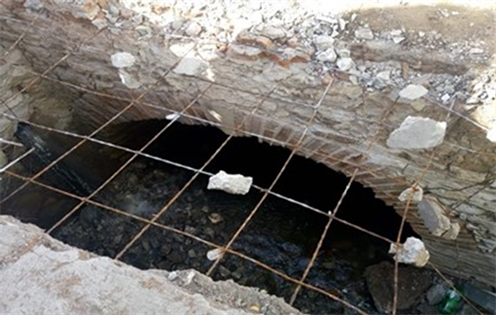
Picture 2. The collapsed site, next to an elementary school.
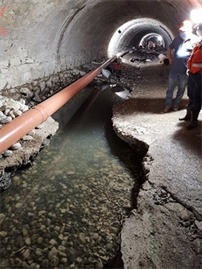
(Picture 3). Pérez et al. [5] also reported that in the collapse area and its surroundings the materials of UACC present diverse pathologies. In the studied UACC section and the reinforcing concrete beam [5] observed runoffs and water infiltrations through several fissures and cracks, in the reinforced concrete’s coating, which provoked degradation, efflorescences, and calcium hydroxide leaching. Reinforced steel in the concrete (longitudinal and transversal) showed visible corrosion and was exposed in the open, with material detachment typical of the areas without coating and crystallized alkaline leachates. In the reinforced concrete beam that goes through the UACC, at the (0 + 145) chain (145 meters from the CA’s discharge into the Sabinal’s main channel hydraulic), Pérez et al. [5] noticed the most severe structural damage, such as exposed steel structure and partial cracking (Picture 3).
Pérez et al. [5] confirmed that the lack of maintenance of the San Roque UACC is evident, which is why there are such notorious failures in materials like breaking and detachment in many sections of the structure. They also noted that the segment built with brick masonry showed a slight deterioration of materials due to gas emissions from untreated residual wastewaters, such as methane, ammonia, chlorine, chlorine dioxide, hydrogen chloride, hydrogen sulfur, nitric oxide, and ozone. Despite all that, the overall brick masonry was in a stable condition, with just a few areas with saltpeter stains, erosion and soft surfaces (due to excess humidity) with efflorescences in the form of crystallized salts. They observed blotches that formed because of a chemical reaction with water, fungus, and bacteria, even moss in the stones as a result of the permanent humidity.
The San Roque UACC does not have any severe damage in its structure except for erosión and depth hole formation, which it will discuss later in the paper. However, the UACC is the cause of structural problems in some houses built around it. Picture 4 shows some homes nearby the UACC that present slight damage such as small cracks, while one of them displays more severe structural issues. This house is built just above the San Roque UACC, and due to its
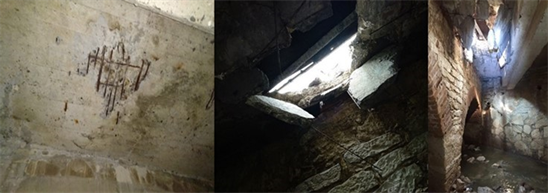
Picture 3. Corrosion, carbonation of materials in the collapsed area of the UACC (0 + 145).
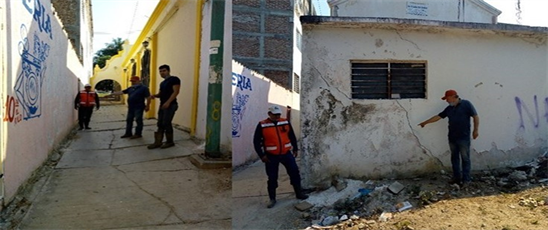
Picture 4. House with severe structural damage and slight sinking in the UACC’s adjacent constructions.
structural damage and the danger it represents for the families that live nearby, it must be demolished.
One of the great difficulties that UACC have in Mexico, regardless of the constructive and structural issues, is the erosion, which is described below.
3. Hydraulic Problems
The first sections of the San Roque UACC were built over 50 years ago when the population in Tuxtla Gutierrez was several times smaller than today. The city began growing exponentially in the 80s, and as a consequence, the construction companies deforested many green areas to build living spaces. These deforestation processes have transformed the hydrographs of San Roque’s micro-basin (Figure 2). Nowadays, the runoffs towards the lower area are much more significant and with less concentration-time (tc).
Flow rate’s estimations (Q) for different return periods done with the exposed equation of [6] are shown in Table 1:
(1)
The flow rates shown in Table 1 are superior to the ones estimated for the San Roque UACC 50 years ago, which is why the structure cannot transport currents associated with a return period equal or greater than five years, as shown below. In many sections of the UACC, its geometric area increases and decreases in the
![]()
Figure 2. Sabinal river sub-basin and San Roque micro-basin (in red) [7].
![]()
Table 1. Flow rate estimated with the rational method.
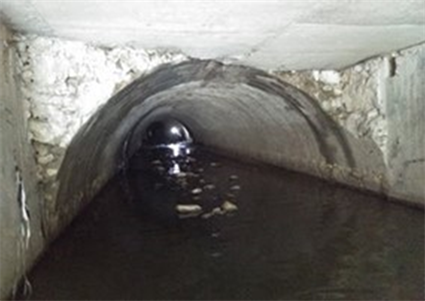
flow’s direction, as opposed to good hydraulic design. Picture 5 shows a reduced geometric area that is prone to clogging due to the accumulation of solid residues. There are many sections in the San Roque UACC as the one depicted in Picture 5, which are no longer apt to transport the flow rates shown in Table 1.
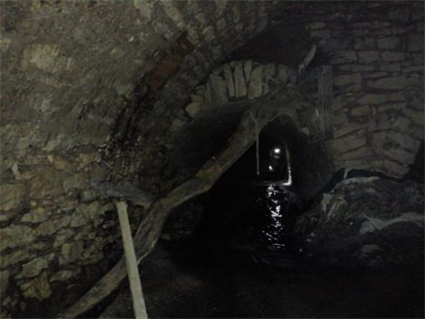
As mentioned before, the San Roque UACC was built in sections, at different municipality managements. These circumstances facilitated that the structure was made with different materials, with sections constructed with brick masonry, others with stone masonry, and some covered with reinforced concrete which are unfavorable for the adequate hydraulic operation of the OCH for the following reasons: 1) The hydraulic transitions were not built as theory dictates. 2) The structure’s conditions generate unnecessary changes in hydraulic areas, flow velocity and flow rates, and 3) There are various segments with minimal geometric sections where trash and solid waste accumulate and obstruct the the flow rate. The structure does not have hydraulic transitions, so the water crashes directly into the walls, generating high energy loss (see the straight angles at the top of the arch in Picture 6).
Besides the energy loss, water crashing straight into the UACC structure can cause recirculation areas with high turbulence, which is conducive for erosion and abrasion cavity formation. The UACC should have been designed with hydraulic transitions, as shown in Figure 3, taking into account the theoric recommendations indicated in Equation (2), to decrease the energy loss, turbulence, minimize erosion and prevent the depth hole formation.
Picture 5. Hydraulic reductions where solid residue accumulates.
Picture 6. UACC without hydraulic transitions.
(2)
In Equation (2), L is the longitude of the hydraulic transition, b1 is the amplest wide section of the OCH, b3 is the least wide section of the OCH and 12˚30' is the OCH recommended angle (Figure 3).
The UACC has different Mannings’s n throughout its length. The different Manning's n for brick masonry, stone masonry, and reinforced concrete cause hydraulic changes in the UACC as demonstrated in the following example. Let’s assume a constant flow rate (Q) in a rectangular OCH made with three different materials. The rectangular OCH has a Q = 10 m3/s, b = 5 m and S0 = 0.001 and is built with: 1) Poor and rough finish concrete (n = 0.020) as the one observed in Picture 7; 2) Rough concrete (n = 0.017) and 3) Brush finish concrete (n = 0.012). With these data, the hydraulic simulations were performed using the Manning equation [8]. The result is shown in Table 2.
(3)
where Q is the flow rate (m3/s), n is the OCH rugosity, Ah is the section’s hydraulic area (m2), Rh is the OCH (m), and S0 is the OCH slope.
Table 2 shows that when the base of the OCH has a rough concrete, the hydraulic depth increases 21.31%, and the area increases 21.24% compared with a OCH with a brush finish concrete. However, if the OCH is poor and rough finish concrete, as shown in Picture 7, the increment in hydraulic depth and area is close to 30%.
Thus, the concrete’s quality and finish in the UACC has great relevance in the behavior of hydraulic depth and can increase or decrease the hydraulic areas, which in turn increases or decreases the water it transports. A low-quality rough concrete surface diminishes the possibilities of the UACC to transport the maximum flow rates (Qmax) it should.
Picture 7. Poor and rough finish concrete [9].
![]()
Table 2. Comparison of: y (m), Ah (m2) and v (m/s) in a z = 0.
The roughness of “n” facilitates the San Roque UACC to work as a full pipe with a flow rate slightly under its maximum capacity. These circumstances can endanger the capability of the UACC (which is already very limited) for large flow rates when extraordinary floods occur in the micro-basin.
However, one of the most relevant hydraulic problems of the San Roque UACC are changes of the cross section in the direction of flow rates (upstream to downstream). To show this, Table 3 presents five chains located between 0 + 000 (entrance) and 1 + 341.29 (exit).
As it is seen in Table 3, at 200 meters upstream from its entrance, the UACC has a cross section of 11.86 m2 but, at 280 meters from that point in the chain (0 + 480), the cross section is 8.73 m2, which means it decreases more than 26%. Then the cross section increases again and, in subsequent sections not shown in Table 3, it continues to decline and increase alternatively.
It should be noted that at 480 meters upstream of the entrance (0 + 480), the San Roque UACC has its most considerable hydraulic reduction (8.73 m2) in all its length. However, the Qmax that can go through the opening is of 59.55 m3/s because, specifically in this section, the UACC slope is very high (S0 = 0.0419). It must consider that the flow rate is erosive in that section (almost 7 m/s), which is why that section is prone to erosión and abrasive cavity formation because the UACC bottom is poor and rough finish concrete, (low-quality concrete). The real issue in the San Roque UACC happens at the 0 + 981 chain, where two
![]()
Table 3. Chainings and hydraulic sections (upstream to downstream).
adverse conditions converge, a small slope (S0 = 0.0033) and a cross hydraulic section reduced of 9.41 m2. The Qmax that can go through that point is 18.77 m3/s, which is the maximum flow rate the channel can transport through its 1300 meter long structure. With a current higher than 18.77 m3/s, the channel starts working as a full pipe and this means that the UACC operation laws are no longer working under OCH but under gauge pressure.
The flow rates and water velocity shown in Table 3 were calculated with the Manning-Strickler Equation (see Equation (3)). The ne (n equivalent) was calculated with the Horton equation [10], because the hydraulic sections of the UACC are made of different materials.
(4)
where PN is a partial wetter perimeter, P is a total wetter perimeter. Thus, according to the values shown in Table 3, in the sections related to the chains 0 + 200, 0 + 480, and 1 + 240, there are flow speeds greater than the maximum permissible velocity, prone to provoke erosion in the channel bottom, notably when the UACC works close to its maximum capacity. There are many similar sections as these throughout the San Roque UACC.
4. Hydraulic Erosion
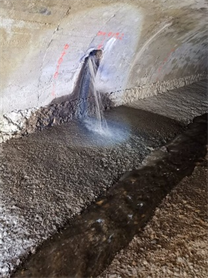
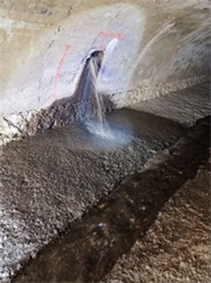
The hydraulic erosion and the abrasion provoke cavities in the natural hydraulics channels or concrete hydrauli channel, as the cavity shown in Picture 8, which was formed by the erosive force of the water.
The Erosion
Erosion is defined here as the progressive disintegration of a solid by abrasion, cavitation or the action of chemical elements. Abrasion or abrasive erosion here is understood as surface erosion produced be water driven rigid particles (in UACC can be found particles and solid elements between 5 and 20 cm). The
Picture 8. Erosion and cavity in the San Roque UACC.
momentum of a solid particle is mainly defined by its mass, velocity and angle of attack. Velocity and angle result from the water flow field. The degree of hardness of a particle compared to the one of the concrete surface and the shape of a particle then predetermines the specific rate of abrasion caused by one single particle.
Thus, the amount of dynamic contacts per unit time, i.e. the particle concentration and also the particle shape and size distribution has to be considered [11]. The erosion starts when the tractive force of water (associated with the flow velocity vector in that specific point) is greater than the resistive force of a ground particle or concrete masonry. When the water flow exceeds the maximun permissible velocity in the OCH, it generates a higher traction force than the resistive force of the particles that compose the channel bottom. As an example, suppose a water flow over a channel in an erosive phase: around a particle in the process of erosion forms a differential of pressures due to the flow speed being higher in the lower part of the particle, and the pressure is low, while in the upper side of the particle the flow speed is low but the pressure is high, according to the water velocity profile in OCH or full pipe (Figure 4).
When the water’s tractive force is larger than the particle resistive force, it generates a dominant horizontal force that starts the movement of a particle at the channel bottom. But if at the same time, there is a negative differential pressure in the axe “y” then occur and lifting force that move the particle in suspension on flow direction.
Thus, the water’s tractive force makes the particle begin its movement. The particle also lifts when the gravitational force is lower than the particle’s weight (otherwise, it drags the particle away). With the tractive and lifting force generated by the water flow, the detachment, drag, and erosion of material begins, which in turn transforms the eroded point turning it into small, elongated cavities that, with time and continuous water action, turns into a large cavity (see Picture 8 and Picture 11).
On the other hand, Manning roughness generates a different hydraulic behavior compared with a smooth surface. For example, excessive roughness, as shown in Picture 8 and Picture 9, enables the inclusion of air, high turbulence, abrasions, channel bottom erosion, formation of small cavities when water flows in a supercritical hydraulic regime.
![]()
Figure 4. Acting forces on a soil particle.
Picture 9. Repaired cavities around May and June, 2019.
When high-speed water gets in contact with the material underneath the concrete layer (when maximum flow and high flow-velocity occurs), the cavities grow disproportionately (Picture 8). It is during the rainy season when the cavities formation problem takes a turn for the worse because of v and Q increments. Cavities formation is random, but it takes only one rainy season to have a severe problem, that can compromise abutments, foundation, and the UACC structure.
5. Maximum Permissible Velocity
The UACC should not be designed to work under the full pipe hydraulic law for the following reasons: 1) The design must not restrict water flow; 2) It must avoid manometric pressures inside the UACC; and 3) It has to take into consideration shocks and abrasions generated by the impact of solid waste such as gravel, sharp slabs, or rocks. The hydraulic laws that rule the operation in a UACC are the free surface hydraulic channel fundamental equations (HCFE). The HCFE equations between two arbitrary sections of a canal are the following. Law of continuity [8]:
(5)
Law of energy conservation [8]:
(6)
Law of momentum [8]:
(7)
To estimate Q in the UACC, it can use Equation (3), that between two hydraulic sections can be re-written as:
(8)
where ne in Equation (8) is the equivalent n of the Manning equation, and it must be calculated with Equation (4) (due to the diverse materials in different sections of the UACC). The hydraulic area (Ah) must be less than the geometric area (Ag), which is an essential condition to apply Equations (5)-(8).
(9)
Water velocity (v) in Equations (5)-(8) is one of the most relevant variables in the HCFE, and it depends directly on the equivalent roughness (ne), the hydraulic radius, and the channel’s slope. Most of the UACC sections have a steep slope, so the hydraulic flow regime remains supercritical even in small flow rates, which means:
(10)
As it can see in Table 3, with considerably large flow rates related to a 2 year return period, the San Roque UACC reaches in most of its sections speeds higher than 4 m/s that lift sediment, remove heavy materials, and erode concrete. All this without even considering the biggest risk: when the San Roque UACC works as a full pipe. When the San Roque UACC works as a pressure pipe, with flow rates higher than 18 m3/s, the risks increase exponentially. The abrasive material it transports (fine sand, thick sand, small, medium, and large stones, sharp slabs, rocks), as well as solid residues, cause abrasions and cavities formation in the UACC. The maximum water velocity reached inside the San Roque UACC recommend in the specialized literature, exceeds the maximum permissible velocity for culvert-arch channels with concrete bottom. Even if there are not enough recent investigation works about the topic, in Table 4 it can see the maximum permissible velocity suggested by diverse authors for simple concrete (with a regular concrete finish and good concrete finish) channels.
So, according to the values in Table 4, the maximum permissible velocity in the San Roque UACC should be between 3.88 and 4.4 m/s, when it works as an open channel. However, the UACC transports abrasive material, maximum permissible velocity should not go over 3 m/s. The maximum permissible velocity it can calculate with Equation (11):
![]()
Table 4. Maximum permissible velocity for concrete.
*This kind of concrete can be used for structural purposes, for example, a house slab. It is not common to use it in channel floors. The average resistance of plain concrete is 150 kgf/cm3. Authors note.
(11)
Table 5 shows the maximum water velocity recommended in tunnels while. But nevertheless hand, in order to determine the maximum permissible velocity, it has to take into consideration Mosonyi’s suggestions [14] (Table 5). On the other The Indian Central Water Commission, suggest the next recommendations [15]: channels working as a full pipe flow must be protected with a layer of water-resistant concrete.
However, the US Army Corps of Engineers (Table 6) suggests that the maximum permissible velocity in tunnels (pipes) must be one that does not jeopardize the structure, for example: 1) that do not provoke cavitation and 2) that does not cause abrasive erosion with the sediment it carries. It must consider that in full pipe flow, and under certain circumstances (for example, lousy finishes and excess of rugosity in the channel’s bottom and walls), erosion and cavities may happen when the speed is equal to or greater than 8 m/s.
On the other hand, the CBIP [16] concluded that in channels that transport abrasive material, the maximum allowed speed must be 3 m/s.
However, the CWC [15] suggests (after a thorough bibliographic revision) that the maximum flow rate allowed in tunnels and pressure pipes depends on the type and quantity of abrasive material it transports. If the water transports suspended abrasive material, the maximum speed should reduce to 2.5 m/s.
Considering the steep slopes and supercritical flow that runs inside UACC is must conclude it is prone to cavities formation (see Picture 10 and Picture 11). The combination of high-velocity flows (that exceeds the maximum speed allowed, see Equations (5), (8), and (11)) plus the inadequate material of the canal bottom (simple, rough concrete without quality finish) increase the chance of cavities formation in the structure, especially in rainy seasons.
The factors that most influence concrete abrasive erosion are: water-cement factor, compressive strength, modulus of elasticity and fracture energy [11].
![]()
Table 5. Maximum permissible velocity in tunnel [14].
![]()
Table 6. Maximum permissible velocity in tunnel [17].
![]()
Picture 10. Large cavities in the in the San Roque UACC [18].
![]()
Picture 11. Extensive cavities [18].
6. Conclusions
When engineers build UACC over rivers: 1) limit the federal area, 2) destroy natural habitats and the benefits the river and its bank give to their environment, and 3) and as well as a wide range of functions, described in [1]. Also, the UACC is a permanent source of contamination due to urban solid residues and untreated wastewater they transport, and the wildlife that resides and reproduces inside, such as rodents, cockroaches, and mosquitoes, which also spread multiple diseases to humans. However, the biggest danger UACC present for society is the risk of structural collapse, because many families live in vulnerable zones. In Mexico, several UACC has collapsed [1]. Some of those are the Verdiguel channel in Toluca, Estado de Mexico, where more than 2000 people live close to the CA. Also, the Zacatecas UACC in the historic downtown, where 2000 people live in a risk area that spans 4 km, and the San Roque UACC in Tuxtla Gutierrez, where almost 655 people live in the risk zone.
This document presents the hydrological estimations of the San Roque micro-basin and the hydraulic analysis of the UACC. Thus, it is evidence that the maximum flow rate the San Roque UACC can transport is 18.77 m3/s, while, the micro basin has runoffs of more than 20 m3/s for a Tr of 5 years. This means the UACC does not have the hydraulic capacity to conduct flow rates larger than 18.77 m3/s. Although the estimates of flow (Q) were made with an indirect method, the Rational Method used is widely used in small basins in Mexico and its estimates are acceptable.
On the other hand, it determined there is a permanent risk of erosion and cavity formation in the UACC due to two main reasons: 1) Bad quality of the channel’s bottom (simple rough concrete) and 2) Flow velocities that exceed the maximum permissible velocity inside. The sections with large cavities in the UACC have an enormous risk of collapse, due to extraordinary runoffs, erosion, and changes in the hydraulic function (from open channel to full pipe) as it happened on September 2nd, 2016.
As can be proven, reviewing the specialized literature, there is very little research that studies the problem of UACC due to collapse and floods. Addressing the UACC, from the point of view of collapse due to floods is a novelty, both from the hydrological as hydraulic (maximum permissible velocity). Thus, this work contributes to demonstrate that: 1) the San Roque UACC channel does not have the hydraulic capacity to transport flow rates associated with return periods equal to or greater than five years, 2) the cavities will continue to appear unless the channel bottom is adjusted for maximum permissible velocity of 3 m/s, or 3) the channel bottom is substituted by high resistance and quality, simple concrete, that can withstand water velocity close to 7 m/s.
Acknowledgements
Special thanks for the revision and translation of this article to Arch. Laura Montserrat Mundo Navarro.