Pediatric Hypertension (HTN) Assessed by Various Methods: A Study among Pediatric Inpatients in University Hospital Gabriel Touré (UH-GT) ()
1. Introduction
High blood pressure (HBP) commonly hypertension (HTN) as a risk factor is of big concern, qualified as public health problem in adult population in developed and more in developing countries [1] [2] [3]. It is known for decades that a correlation among child blood pressure and adult pressure exist [4] [5] [6]. Some factors are related to development of hypertension such low birth weight, prematurity [7] [8] [9] [10]. Studies showed that there is an increase in children blood pressure in developed countries [11] [12], whereas some developing countries didn’t show that [13]. It is therefore necessary to check for HBP as earlier as possible, up 3 years old for most authors.
Opposed to adult blood pressure which is estimated based on a single reference value, HBP for children is estimated using many references [14] [15] [16]. All these methods need either height, sex, age, percentiles of blood pressure or calculation blood pressure standard deviation. Unlike for adults with just reading the blood pressure level, it is not easy to measure children blood pressure as it needs to know other parameters like height, age, etc. and they must be quiet enough to proceed with the measurement.
HBP prevalence in pediatric population is estimated to be low [17] [18]. This prevalence ranged from 2.9% to 5.6% in Chetla (India) [19]. Data from African continent revealed prevalences of 4.9% for primary school children [20], 11.4% systolic and 8.1% diastolic, 3.9% combined HTN in Tanzania [21]. Previous Malian studies in cardiology department found prevalence of 11% and 2.25% [22] respectively based on reference values from the Fourth Report on the Diagnosis, Evaluation, and Treatment of High Blood Pressure in Children and Adolescents [14] and those of the French Society of pediactric Nephrology [15]. In general population, HTN prevalence was 6% for children aged 5 to 17 years [23].
There are few publications on HTN in pediatric area. We therefore conducted this study to estimate the extension of HTN among children and looking for associated factors.
2. Methods
This study was conducted as cross sectional in pediatric department of the University Hospital Gabriel Touré (UH-GT) in Bamako from August 2015 to Mai 2016, involving children from 3 to 16 years.
Included were all patients admitted to the general pediatric unit in the pediatric department by whom blood pressure could be assessed. Excluded were new born.
Blood pressure was assessed using the references released by the National institutes of health in the United States (14), those of the French Society of Pediatric Nephrology [15] and standard deviation (SD).
Briefly for the French Society of Pediatric Nephrology HBP is defined for blood pressure percentiles over 97.5 and for the National Institute of Health over 90th percentile as stated in the following table.
*National high blood pressure education program working group on high blood pressure in children and adolescents.
Based on z-score, HBP is defined for blood pressure > 2z. The latter was calculated using the following the formula below with
being the value,
the mean of the sample and s the standard deviation:
We used the auscultation method with appropriate cuff adapted to the child’s upper arm.
We got for each arm 3 blood pressure measures taken children seated or lying on the back and mean blood pressure was calculated and used for the evaluation of the pressure level. The interval between the arms with the higher blood pressure was considered for the study.
Socio-demographical (age, sex), parental cardiovascular risk factors and clinical data (blood pressure, labor tests including blood glucose, urea, serum creatinine, proteinuria, hematuria) were collected anonymously on a formulary and then inserted in a Microsoft Access Database. Analysis was done using “IBM SPSS for Windows, version 18” (IBM Corp., Armonk, N.Y., USA) with Chi-square test for categorical variables and analysis of variance for quantitative variables as well as a logistic regression.
3. Results
The study involved 154 patients (Boys:girls = 56.5:43.5) aged 3 to 16 years. Patients of 11 years and older made 57.1% of the sample (Diagram 1). Most patients suffered from severe malaria (35.1%, glomerular and heart diseases with respectively 16.2% and 9.1%.
Comparing means in ANOVA-Test (not shown) for age, weight, height, systolic and diastolic blood pressure gave no statistical difference between boys and girls. Diagram 2 shows these different values.
The global proportion of hypertensive patients was 27%, 39% and 5.2% respectively based on references of the French society of nephrology, those of the 4th report of the NHBPEP and standard deviation (Diagram 3).
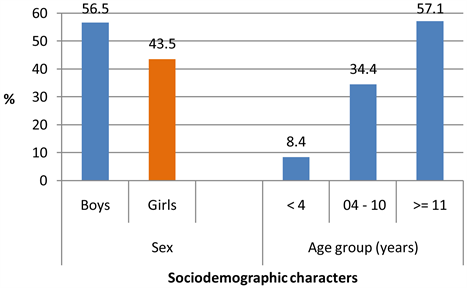
Diagram 1. Sociodemographic characters of the sample of 154 pediatric patients for the high blood pressure study in the UH-GT.
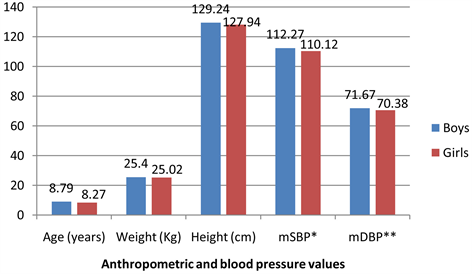
Diagram 2. Anthropometric and blood pressure values of the sample of 154 pediatric patients for the high blood pressure study in the UH-GT. *mSBP: mean systolic blood pressure. **mDBP: mean diastolic blood pressure.
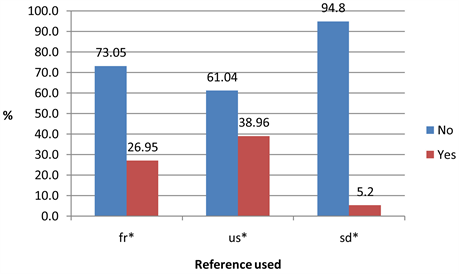
Diagram 3. Proportion of high blood pressure measured by various methods in the UH-GT.
3.1. Blood Pressure Based on the Reference of the French Society of Nephrology (Table 1)
Boys had 9.2 versus 7.1 and 2.1 versus 0.7% for girls respectively for level 2 and 3 systolic hypertension; the corresponding values for diastolic hypertension were 5 and 9.2% respectively for level 2 and 3. Girls had lower values except for diastolic hypertension with 6.4 versus 5% for boys. Those differences didn’t reach statistical significance. The same trend was observed for the age groups with hypertensive patients in age group 4 - 10 years without statistical significantly difference.
3.2. Blood Pressure Based on the Reference of the 4th Report of the NHBPEP (Table 2)
There was a trend with boys being more hypertensive (2.6 versus 1.3 and 14.3 versus 13.0% respectively for systolic pre-hypertension and stage 1 - 2 hypertension, the p value remaining not statistically significant (p = 0.745). Diastolic values were 5.2 versus for pre-hypertension and same value of 14.3 for hypertension stage 1 - 2 (p = 0.504).
Patients aged 4 up to 10 years showed a higher proportion of hypertensive patients as well for systolic as for diastolic hypertension.
3.3. Blood Pressure Based on Z-Score (Table 3)
Girls had a higher proportion of systolic and diastolic hypertension with 2.6 versus 1.9% for boys, p-value remaining not significant at 0.456. The same proportions were found for systolic and diastolic hypertension.
Patients aged 11 years and older had a higher proportion of systolic hypertension with 2.6% whereas those between 4 and 10 years showed more hypertensive patients with 2%.
3.4. Factors Associated with Hypertension (Table 4 & Table 5)
Looking for associated factors for hypertension the logistic regression found no
![]()
Table 1. Blood pressure description based on the French society of nephrology of the sample of 154 pediatric patients for the high blood pressure study in the UH-GT.
Level 2: “Confirmed HTN” if BP > 97.5th percentile + 10 et < 97.5th percentile + 30 mm; Level 3: “immediately threatening HTN” if BP > 97.5th percentile + 30 mmHg Hg.
![]()
Table 2. Blood pressure description based on the references of the 4th report of NHBPEP of the sample of 154 pediatric patients for the high blood pressure study in the UH-GT.
Prehypertension 90 - <95th or if BP exceeds 120/80 mmHg even if below 90th percentile up to <95th percentile; Stage 1 95 - 99 + 5 mmHg; Stage 2 > 99th percentile + 5 mmHg.
![]()
Table 3. Blood pressure description based on the standard deviation of the sample of 154 pediatric patients for the high blood pressure study in the UH-GT.
![]()
Table 4. Logistic regression using the references of the french society of Nephrology of the sample of 141 pediatric patients for the high blood pressure study in the UH-GT.
![]()
Table 5. Logistic regression using the references of the 4th report of the NHBPEP of the sample of 154 pediatric patients for the high blood pressure study in the UH-GT.
predictor for hypertension using pressure cut-offs values based on the French society of nephrology and those of the 4th report of the NHBPEP (Table 4 and Table 5).
4. Discussion
Our study was the first to handle high blood pressure comparing the most 2 methods to assess blood pressure in pediatric area. As these tools have been developed for different populations we used Z-score as the third method to appreciate blood pressure.
Our findings give rise to the following comments:
- High blood pressure proportions are very different according to the methods. The reference method of the 4th report of the NHBPEP found the highest proportion of hypertensive children with 39% much than using French references. The standard deviation method found the lowest proportion of high blood pressure patients, only 5.2%, concordant with a previous study in general population which found 6% hypertensive children in Bamako [22]. As using the Z-score is not very easy in clinical practice, large data on our patients are necessary to establish gender and age specific cut-off values for our population. Even the first two methods are not ideal to check up essentially due to their origin from high-income countries with a very different setting; it is possible to use them for follow up.
- The proportion of hypertensive children is high and of concern, but might be overestimated probably due to the stressful environment and also the proportion of glomerular and heart diseases in the sample. It is also maybe not sufficient to multiply blood pressure measures on the same inpatient in order to create an adaptation, pressure values should be assessed far from an hospitalization. This could explain why we found a small proportion in a study on ambulant patients in 3 consecutive visits [22].
- Using the Z-score gives proportions which are very close to each other or both diastolic and systolic hypertension meaning there is less discrimination using Z-score in this form.
- Many factors have been described as associated with hypertension like overweight, obesity [24] [25], parental HTN [26] or various anthropometric measures [27] or in previous studies [22]. In this study factors associated with hypertension were not statistically significant.
- HBP prevalence measured using the standards of the French Society of Nephrology was higher than that of the 4th report of the NHBPEP. By the best of our knowledge, there is no study that compared these two methods on the same sample.
- Our findings put in light the need for close follow up of these children as many studies have demonstrated a tracking of blood pressure in youth to adulthood [4] [28], the presence of organ damage even in this age group [29] [30].
- Our next step is to establish population-based cut-off values for blood pressure and try to find a simplified equation for assessment of blood pressure. This will allow an early detection and therefore proper management of detected high blood pressure pediatric patients.
Limits
Main limitation of this study was the availability of only blood pressure and a few set of labor tests. Electro- and echocardiography i.e. were not available due to the high costs and also the fact that ECG material was not adapted for most children.
5. Conclusion
Children must be checked for hypertension to avoid organ damage and later cardiovascular complications. Blood pressure assessment should be preferably done on outpatients allowing an attenuation of the role of the stressful hospitalization environment. Blood pressure measure is always complex leading to an underestimate of its true prevalence and the risk of later complications.
Acknowledgements
To the staff of the Pediatric Department for successful collaboration.