Cardiovascular Risk Factors (CVrf) in Rural and Urban Areas Mali: Data from the Step 2013 Survey ()
1. Introduction
Cardiovascular risk factors (CVrf) have been established for several decades and are becoming increasingly prevalent with a significant amount of data in the world and in Africa [1] - [6] . Classically, some of them are called unmodifiable, others as behavioral [7] . In Mali, traditional CVrf like hypertension, diabetes, dyslipidemia, obesity, smoking have been studied extensively in hospital studies for theses, but few data have been published [8] [9] [10] . In addition, data from extra-hospital population studies are rare or old [11] [12] . There is therefore a need to update the data beyond the usual administrative reports provided by the Department of Health. We therefore carried out this study to study the traditional CVrf in rural and urban areas.
2. Materials and Methods
We conducted a cross sectional population-based study, which data stemmed from the 2013 STEPS survey in urban and rural areas. This approach has been described by the World Health Organization (WHO) [13] .
Sampling and data collection
The study sample is based on the last STEPS-Survey which was conducted in 2013 with 2102 subjects aged from 15 to 65 years of whom 1543 (73.4%) lived in urban and 559 (26.6%) in rural areas.
It was conducted in administrative units known as “Communes” and within each commune in towns/villages.
A two stage cluster sampling method was used to select subjects from urban and rural areas. First clusters were obtained among “Communes” in the three involved regions and second clusters from “Quartiers” within these “Communes”. Households were then randomly selected and all eligible adults in the household were interviewed, underwent physical exam and measurements were taken.
The sample size was calculated using the formula:
with n = sample size, Z = 1.96, p = 40% = 0.40, q = 1 − p = 0.6, i = 3% = 0.03, d = 2.
A total of 30 Clusters as given bellow were obtained:
Data collection:
Following data were recorded for each study participant:
- Sociodemographic characteristics,
- 3 blood pressures and heart rate measures in 5 min interval, using their mean as systolic, diastolic blood pressure respectively SBP, DBP and heart rate (HR)
- Fasting/postprandial glycemia,
- Weight in kilogram (Kg), height in centimeter (cm) allowing to calculated body mass index (BMI) in Kg/m2 as Weight (Kg) divided by Height (cm) squared.
- Waist circumference (WC), Hip Circumference (HC) all in cm
- ratio Waist-to-Hip (rWH) as WC in cm divided by HC in cm
Teams of three medical staff personal were built and trained to use the survey formulary and to perform measurements during household visit (and second visit in case household members were not present). Each subject was interviewed and from him different measures were obtained according to guidelines of the WHO STEPS approach for chronic disease surveillance [13] .
Interviews were performed by medical personal and focused on socio-demographic characteristics, lifestyle, cardiovascular risk factors, personal and family history of cardio-vascular diseases or other chronic illnesses.
Height was measured without shoes to the nearest centimeter with subject stand on the footplate with back against stadiometer rule.
Weight was measured to the nearest 0.1 kg on an electronic scale with the subject wearing light clothing and no shoes.
Waist circumference (WC) and Hip circumference (HC) was measured with a stretch-resistant tape that is wrapped snugly around the subject, but not constricting.
WC was measured at the midpoint between the lower border of the rib cage and the iliac crest with the subject being light clothed.
HC was measured around the widest portion of the buttocks.
We used for blood pressure measurements an apparatus with a medium and large cuff size and performed measures at rest, the subject in sitting position on the right arm. The mean of the two blood pressure readings was used for each subject in this study. A third measure was performed in some cases if blood pressure values were borderline.
Definitions
Education level was graded as followed:
- Level 0: no school attending
- Level 1: school attending for 1 - 6
- Level 2: school attending for 7 - 9
- Level 3: school attending for 10 - 12
- Level 4: school attending for 12 and more years
Hypertension was defined as systolic blood pressure (SBP) ≥ 140 mmHg and/or diastolic blood pressure (DBP) ≥ 90 mmHg or self-reported use of antihypertensive drug irrespective of measured blood pressure [14] .
Mean arterial blood pressure (mBP) was calculated with this formula:
General obesity was defined by body mass index (BMI) and further central obesity through the waist circumference (WC) [15] [16] .
BMI served to define weight disorders as following:
- Underweight (UW): <18.5
- Normal weight (NW): ≥18.5 and <24.99
- Overweight (OW): ≥25.00 and <29.99
- Obesity (OB): ≥30.00
Based on waist circumference, OW was defined as WC ≥ 90 cm and ≥80 respectively for men and women and central OB as waist ≥ 102 cm for men and ≥88 cm for women [16] .
For the ratio Waist-to-Hip (rWH) Men with a rWH 0.90 - 0.99 and women with a rWH 0.80 - 0.84 were classified as overweight, while men with a rWH ≥ 1.00 and women with a rWH ≥ 0.85 were classified as obese [16] .
Diabetes was assessed with a glucometer (one-touch ultra Bayer®), fasten or postprandial with cutting values of resp 1.26 and 2 g or the use of antidiabetic medicine.
Data analysis:
Sociodemographic data and continues variables were described and the results presented in tables with statistical tests (Chi2 or Fisher dependent of your applicability).
Then we carried out a logistic regression analysis with setting (rural or urban) as dependent factor. We then used for this analysis potential predictors age, sex, education level, obesity based on BMI, WC, rWH, smoking, alcohol consumption, HTN and diabetes.
References for the logistic regression were age group < 30 y, education level ≤ 9, No smoking, No alcohol consumption, No HTN, No Diabetes and normal weight for BMI, WC and rWH. p-value < 0.05 was considered statistically significant.
The SPSS software version 20 was used for data analysis.
3. Results
Description of variables
Means for quantitative variables are presented in Table 1. Weight, height, WC and HC showed statistically significant differences. These four parameters were all higher in urban area with 69.77 Kg, 169.13 cm, 85.98 cm and 97.26 cm compared to 66.27, 165.42, 81.46 and 93.23 in rural area (p < 0.001). The other continuous variables did not differ significantly.
Among the socio-demographic characteristics, gender and educational level differed significantly. There was more female in rural area and educational level was higher in urban area (Table 2).
Obesity based on BMI and WC circumference was higher in urban areas with 16.20% and 31.20% compared to 9.20% and 21.60% in rural areas (p < 0.001).
rWH-based obesity was higher in rural areas with 50.80% versus 44.20% in urban (p = 0.009) (Table 2).
Alcohol consumption was more prevalent with 6.7% in urban area against 3.7% in rural (p = 0.009) (Table 2).
Apart from smoking and hypertension, prevalence for cardiovascular risk factors increased up to 59 years and regressed after (Diagram 1).
From all CVrf obesity (based on BMI, WC and rWH) was more common in female sex with the highest value for obesity based on rWH (Diagram 2).
Tobacco smoking had an almost ten times higher prevalence in male sex (24.4%) versus 2.7% in female sex (Diagram 2).
Prevalence for Hypertension was 25.4% in male sex and 22.8% in female sex (Diagram 2).
![]()
Table 1. Description of continues variables in rural and urban setting.
SBP: systolic blood pressure, DBP: diastolic blood pressure, HR: heart rate, SD: standard deviation.
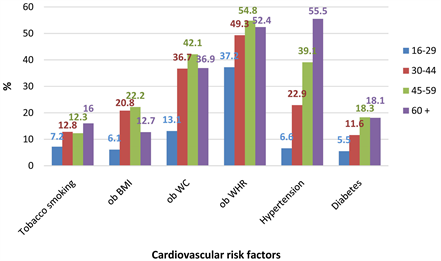
Diagram 1. Cardiovascular risk factors by age group in the 2013 STEP survey in Mali. ob BMI: obesity based on BMI, ob WC: obesity based on waist circumference, ob WHR: obesity based on the ratio waist to hip.
![]()
Table 2. Sociodemographic characteristics and CVrf in rural and urban setting in the 2013 STEP survey in Mali.
*school attending in years.
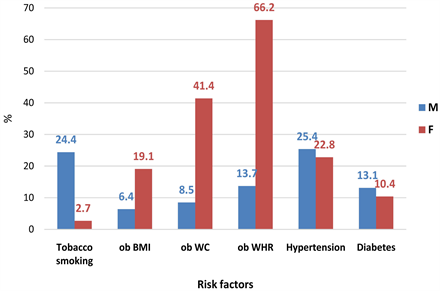
Diagram 2. Cardiovascular risk factors by gender in the 2013 STEP survey in Mali. ob BMI: obesity based on BMI, ob WC: obesity based on waist circumference, ob WHR: obesity based on the ratio waist to hip.
Logistic regression
The regression analysis was first performed using setting as dependent variable for the entire sample and found sex, education level, obesity based on WC and WHR statistically significant with following odd ratios and confidence intervals: (Table 3):
- Female sex: 0.691 and CI [0.512 - 0.931] (p = 0.015)
- Education level with ≤9 as reference
10 - 12: 2.172 and CI [1.599 - 2.952] (p < 0.001)
12 +: 2.211 and CI [1.287 - 3.797] (p = 0.004)
- WC with OR of 2.338 and IC [1.689 - 3.237] (p < 0.001)
- WHR with OR 0.683 and IC [0.517 - 0.904] (p < 0.001)
Association for age group was significant but not stable.
We further performed logistic regression using always setting as dependent variable for each sex.
For female education level, tobacco smoking, WC-based and WHr-based obesity reached statistically stable significance with following results (Table 4):
- Education level with ≤9 as reference
10 - 12: 2.198 and CI [1.449 - 3.335] (p < 0.001)
12+: 5.340 and CI [1.802 - 15.822] (p = 0.003)
- Tobacco smoking: 0.334 and IC [0.151 - 0.738] (p = 0.007)
- WC with OR of 2.698 and IC [1.881 - 3.871] (p < 0.001)
- WHr with OR 0.582 and IC [0.415 - 0.815] (p < 0.001)
Same logistic regression procedure performed with men found only diabetes (OR 0.579 and CI [0.346 - 0.971], p = 0.038) statistically significant (Table 5). Association with education level was not stable.
![]()
Table 3. CVrf predictors rural area as reference.
*school attending in years.
![]()
Table 4. CVrf predictors among women, rural as reference.
*school attending in years.
![]()
Table 5. CVrf predictors among men, rural as reference.
*school attending in years.
4. Discussion
We conducted a community-based study, the first of its kind on a large sample of urban and rural subjects.
Prevalence
Tobacco use with a prevalence of 10.80% is high but still below prevalence in other African countries [17] and in most countries outside Africa [17] [18] [19] . Unlike Chockalingam [20] , we found no significant difference between rural and urban. Freeman et al. [21] underlined large reductions in tobacco smoking prevalence from 1980-2012. In that study in supplement data tobacco smoking prevalence seems to be constant around 10%.
Obesity in general was more important in the female sex and in urban areas as found by Ziraba [22] , Garcia et al. [23] . Based on the BMI, there was no significant difference in our sample compared to Ziraba [22] . Sartorius [24] emphasized the increasing prevalence of obesity especially in the female sex. This study did not allow us to verify this trend in the Malian population.
Hypertension and diabetes constitute a burden for African countries [25] [26] [27] [28] . According to Mohsen and Damasceno [29] , Mali will be in the intermediate prevalence range between 20% - 30%.
Global diabetes prevalence of 11.4% is of big concern with near same prevalence in rural and urban setting. This prevalence is higher than those published by Hall et al. [30] .
Logistic Regression
Results from the logistic regressions could be interpreted as following:
- In the whole sample only obesity was statistically significant in comparing urban and rural dwellers, with raised waist circumference more prevalent in urban and raised rWH more prevalent in rural area.
- Among female: tobacco smoking was less prevalent in urban setting like in India [20] . But rural urban pattern have been described as inconsistent [30] [31] . WC-based obesity was more than twice and half in urban setting as found in others studies [32] while data are opposed about rural urban pattern in neighbour lands [33] . But generally obesity seems to be more prevalent in urban area [33] . Opposed to WC-based obesity rWH-based obesity was more prevalent in rural area.
- Among male: Diabetes the only risk factor with statistically significant association was more prevalent in rural area. Diabetes pattern in rural and urban areas are variable [34] , so that further studies in Mali are necessary to confirm our finding and to further look for differences between rural and urban dwellers if such differences exist.
5. Strengths and Weaknesses of the Study
We provided prevalence data on a sample from the general population collected according to the WHO STEP wise approach. Data presented in this form were not available to the best of our knowledge.
Lipids level was not available in this sample primarily for financial constraints. Having that would permit a better calculation of the cardiovascular risk according to most of the standards. Nonetheless we provide first order data which could lead to further studies with more in deep analysis for better planning of strategies against CVrf.
6. Conclusion
Traditional cardiovascular risk factors have high prevalence in this study and need to be monitored with larger studies. Female predictors were raised waist circumference in favour of urban and tobacco smoking and waist-to-hip ratio in favour of urban dwellers. Male diabetes was the only predictor we found.
Acknowledgements
To Dr. Nazoum Diarra, who led for years the non-communicable disease section at the Ministry of Health for giving us opportunity to publish these data.