Origin and Distribution of Heavy Minerals in the Surficial and Subsurficial Sediments of the Alluvial Nile River Terraces ()
Received 22 November 2015; accepted 13 December 2015; published 17 December 2015

1. Introduction
Heavy minerals are defined as high density minerals, which have specific gravities of 2.9 g∙cm−3 or higher [1] . About 56 translucent species of heavy minerals are described by [2] and have been regarded as indicators of sediment sources [3] .
The heavy mineral assemblage in sediments usually reflects their parent rocks as well their origin. Thus, over the last two decades, specific heavy minerals including zircon, monazite, garnet, tourmaline, apatite, rutile, and Ti-Fe oxide minerals have been widely used to decipher the provenances of marine and Nile river sediments in terms of their unique varietal characteristics [4] .
According to [5] the factors which influence the assemblage of the heavy minerals include weathering at different stages between the original source rocks and sedimentary environments, mechanical abrasion during transportation, physical sorting and diagenetic processes during buried. Furthermore, laboratory errors caused by heavy mineral separation during sample preparation could influence the heavy mineral assemblages.
The percentage of zircon, tourmaline and rutile (ZTR index) in the non-opaque heavy mineral is important to assess the mineralogical maturity of the sediments [6] . Sediments which have highest concentrations of ultrastable heavy minerals indicate the most mature mineral composition.
Many researchers mention that the study of opaque minerals provides little information about the origin of the sediments. Therefore, we discuss and propose that this study should be focused on non-opaque heavy minerals assemblages [5] and [6] .
The aim of this study was to identify the non-opaque heavy minerals assemblage of the surficial and subsurficial sediments in the Nile terraces at Khartoum North, Sudan in an attempt to refer them to their origin.
2. Materials and Methods
2.1. Study Area
The investigated area is part of the perilagoonal belt located in the northeastern part of Khartoum North, Sudan between the River Nile at Khartoum North, lies between latitudes (451437N to 453478N and longitudes 1747982E to 1750070E, and extending eastwards till the piedmont plain (Figure 1). Ideally, the study area received sediments from Ethiopian plateau and is not restricted to local sources. These sediments are interbedded with various metamorphic rocks, mostly gneiss and schist in addition to igneous rocks [7] .
The study area belongs within the semi arid climatic zone [8] . The average annual rainfall varies from 100 - 225 mm. Mean maximum temperature of the hottest months (May and June) is 40˚C and 42˚C, respectively. Mean minimum temperature of the coldest month (January) is 13˚C - 16˚C. According to the American System of soil classification, the soils of the study area belong within Entisols and Aridisols soil orders [9] .
2.2. Soil Sampling
Transect of 3 profiles (total of 10 representative sediment surface and subsurface samples) was collected from three Nile River terraces at Khartoum North, Sudan (Figure 1). Samples 1, 2 and 3 represent the very recent (first terrace) Nile terrace soils. Samples 4, 5 and 6 were collected from the second Nile terrace, while samples 7, 8, 9 and 10 were collected from the intermixing of the alluvial plain and the piedmont. Samples 1 (0 - 30 cm), 4 (0 - 18 cm) and 7 (0 - 15 cm) were surficial sediments, while samples 2 (30 - 80 cm), 3 (80 - 130 cm), 5 (18 - 50 cm), 6 (50 - 90 cm), 8 (15 - 40 cm), 9 (40 - 70 cm) and 10 (70 - 120 cm) were subsurficial sediments. The reason for selected 70% of subsurficial sediments to avoid the bias to surficial sediments and to decrease the errors in case if the surficial sediments has been accumulated with Aeolian, particularly at the intermixing of alluvial plain and piedmont.
2.3. Global Positing System and ArcGIS
All samples were located using a global position system (GPS, Model 12 XL Garmin), and map of the study
![]()
Figure 1. The study area and sites of the soil samples.
area was created using Arc GIS software version 10.2 (Arc GIS, Esri, USA).
2.4. Samples Preparation and Analysis
In the laboratory, soil samples were spread to air dry at room temperature, ground using wood pestles and mortars and sieved to pass 2 mm sieves. Then, samples < 2 mm were oven dried at 50˚C to insure the complete dryness.
2.5. Grain Size Analysis
For grain size distribution, samples were treated with 10% HCl to destroy calcium carbonate, using H2O2 to remove organic matter, washed with distilled water to remove soluble salts and dispersed chemically with Calgon (Sodium hexameta phosphate), and mechanically with a dispersion machine. The Hydrometer method was used to determine the clay and silt fraction, while sand fraction was obtained by subtraction from 100%. The textural class was obtained using textural triangle [10] .
2.6. Determination of Sand Fractionations
The sand fractionation was done using the appropriate set of sieve (0.063 - 1.0 mm). The sediments and suspension were quantitavely transferred from the 1 liter sedimentation cylinder through a 63 micrometer sieve. The sediment onto the 63 micrometer screen was washed using a wash bottle or gentle stream of water. The sand fraction on each sieve was transferred to a tarred beaker or aluminum weigh dish, oven dried at 105˚C for 24 hr, and each sand fraction weighed for second times. Individual sand separates were calculated as a percentage of the < 2 mm whole soil sample. Total sand was calculated as the sum of the sand separates [9] .
2.7. Heavy Minerals Analysis (Non-Opaque Minerals)
According to [2] , about 150 g of each representative sample was treated with 10% HCl to remove CaCO3 and 15% H2O2 to remove O.M (60˚C - 70˚C for 15 minutes). The analysis of heavy minerals were carried out into three steps; 1) separation of very fine sand (VFS) and fine sand (FS) fractions (0.063 - 0.125 mm and 0.125 - 0.25 mm), respectively: The sediments and suspension were quantitatively transferred from the 1 liter sedimentation cylinder through a 0.063 mm sieve, washed with tap water, then sand fraction on 0.063 - 0.125 mm and 0.125 - 0.25 mm were used for magnetic separations; 2) separation of the magnetic from non-magnetic heavy minerals using potassium polytungstate solution with a density of 2.85 gcm−3: 1g subsamples of VFS and 1.5 g of FS fractions were placed individually in centrifuge tubes, then centrifuged at 3000 rpm for 15 minutes [11] . Two groups of funnels with filter papers were prepared to receive the heavy and light minerals, washed 3 times to recover the heavy liquid, and the last wash was performed with alcohol to ensure that all heavy liquid was cleaned from the heavy minerals and 3) identification, characterization and calculation the different heavy minerals using a polarizing microscope: Heavy mineral grains separated from VFS were mounted on a glass slide using Canda balsma (RI = 1.5). Heavy mineral analyses were carried out in the Central petroleum Laboratory, Ministry of Energy, Sudan.
2.8. Calculation of Zircon, Tourmaline, Rutile (ZTR Index):
The three ultrastable minerals (i.e. zircon, rutile and tourmaline) were used to calculate the ZTR index of the sediments (i.e. their mineralogical maturity). The ZTR for each of the selected samples was calculated using the following equation: 
where: N.O = Non-opaque minerals, Z = Zircon, T = Tourmaline and R = Rutile.
This equation is referred to as [6] scheme. From the calculated percentage, ZTR < 75% implies immature to sub-mature sediments; ZTR > 75% indicates mineralogically matured sediments.
2.9. Statistical Analysis
Descriptive statistical analysis includes; mean, standard deviation, skewness and kurtosis were used for grain size, while mean and standard deviation were used for non-opaque heavy minerals. All statistical analyses were performed using SPSS software version 16.0 (SPSS Inc, USA).
3. Results and Discussion
3.1. Grain Size Distribution and Textural Class
Table 1 summarizes the grain size distribution and the textural class of the sediment samples of the investigated area. Results revealed that 50% of the total samples were predominantly of silt and values ranged from 11.9% to 59.52% with an average of 34.64%, sand was dominant in 40% of total samples and values ranged between 14.06% to 52.15% with an average of 32.51%, whereas; silt was found to be dominant only in 10% of samples and values ranged from 24.04% to 52.61%, with an average of 32.85%. Sand sized sediments were obtained to be mostly dominant in the samples from second terrace and the intermixing of the alluvial plain and piedmont. These results could be due to addition of fine sand by Aeolian depositional. Whereas, silt sized were found to be mostly dominant in the first and intermixing terraces. The results for textural class showed that the studied samples belong within 7 classes namely; silty clay loam, clay loam, sandy clay loam, sandy clay, clay, silt loam and loam.
3.2. Descriptive Statistical Parameters of the Grain Size
The descriptive statistical analyses of the grain size are presented in Table 2. The mean grain size values of samples ranged from 2.34 to 8.84. The standard deviation values varied from 0.24 to 6.13, which indicate very
![]()
Table 1. Percentage of grain size distribution (clay, silt and sand) in the sediment samples.
*United State Department of Agriculture.
![]()
Table 2. Descriptive statistical parameters for the grain size in the studied sediment samples.
*Standard deviation.
well sorted to extremely poorly sorted samples. Overall, most samples in the study area falls within very poorly sorted to extremely poorly sorted samples. These results indicate that the energy of the depositing was not sufficient enough to enhance the degree of sorting to separate the sand fractions into different classes. These findings were in agreement with [12] . The skewness results of all studied samples indicate strongly negative skewed to strongly positive skewed and values ranged from −0.81 to 0.92. These results indicate that the sediments samples are dominated by fine and coarse sand fractions. These results are disagreed with [13] , who mention that the river sands are usually positively. The kurtosis values varied from 0.16 to 3.01, which indicate very platykurtic to extremely leptokurtic. In fact, 70% of the studied samples varied from mesokurtic to very leptokurtic and valued ranged from 0.96 to 2.87. Similar results were obtained by [2] . According to [14] , results of skewness and kurtosis of the studied sediments suggest that fluvial and Aeolian sediments are the dominant environments in the investigated area.
3.3. Non-Opaque Heavy Minerals
The microscopic inspection of the Nile terrace sediments samples showed that the non-opaque heavy minerals included: zircon, tourmaline, rutile, garnet, sillimanite, and andalusite ( Plate 1 ).
1) Zircon is the most abundant ultrastabile minerals, its grains are found as rounded and subrounded shape, pale and dark colored, different sizes and inclusions ( Plate 1(b) and Plate 1(d) ), and observed in all sediments. Rounded zircon grains were identified in the sediments of the first and intermixing terraces with range from 2% - 15%, while subrounded/angular zircon grains were observed in the soil of the three terraces with range from 3% - 47.36%. The mean content of zircon in the sediments from first, second and intermixing terraces were; 32.79%, 8.52% and 5.23%, respectively. The distribution of zircon in all sediments shows irregular abundance throughout the entire depth, but decreased far away from the Nile course (Figures 2-5). Presents of rounded and sub rounded zircon may indicate a relatively long distance of transport as well relatively strong reworking and probably most coming from igneous or metamorphic rocks derived from the Ethiopian plateau. These findings were in agreement with [12] .
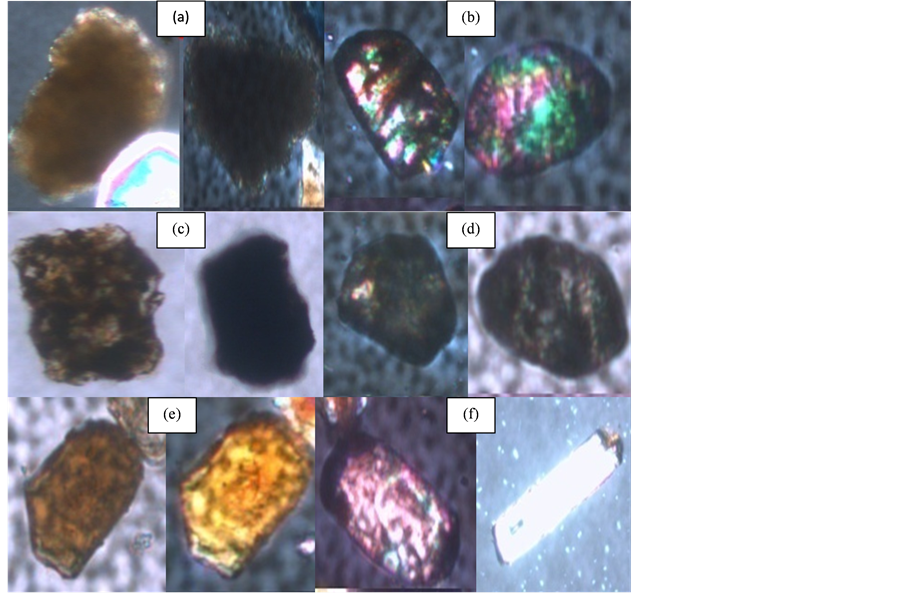
Plate 1. Polarizing microscope photomicrographs (Mag. ×100) of selected heavy minerals identified in the sediments of the study area. (a) Andalusite, (b) sub- rounded zircon, (c) garnet, (d) rounded zircon, (e) types of rutile, (f) types of tourmaline.
![]()
Figure 2. Variation of percent heavy minerals with depth in the sample 1.
![]()
Figure 3. Variation of percent heavy minerals with depth in the sample 2.
![]()
Figure 4. Variation of percent heavy minerals with depth in the sample 3.
![]()
Figure 5. Regression of zircon percentage with depth of all samples.
2) Tourmaline is the second abundant ultrastable mineral in the study area, found as prismatic, elongate, indigo to black grains Plate 1(f) , and observed in all sediments, with mean content ranged from 12.27% - 18.83%. The distribution of tourmaline shows irregular pattern throughout the entire depth, but increased far away from the Nile course (Figures 2-4 and Figure 6). This may suggest relatively long distance of transport and most probably igneous or metamorphic (particularly, gneisses and schist) source rocks which could be derived from the Ethiopian plateau. Similar findings were obtained by [15] .
3) Rutile was found as very high relief, irregular prismatic, yellowish brown and the dark reddish brown grains Plate 1(e) . Rutile was found in the least ultrastable minerals content compare with zircon and tourmaline, with mean ranging from 5.67% to 18.24%. The highest mean abundance (18.24%) was found in the second terrace. The distribution of rutile shows irregular pattern throughout the entire depth and from the Nile stream (Figures 2-4 and Figure 7). The presence of rounded rutile indicated reworked sediments most probably coming from metamorphic source rocks. These findings were in agreement with [16] .
4) Garnet mostly relatively resistant mineral, and the grains were found as cubic, pale and dark red Plate 1(c) , and observed in the three terraces with mean content of 40, 21% and 40% from first, second and intermixing terraces, respectively. The distribution of garnet shows irregular pattern throughout the entire depths of the first
![]()
Figure 6. Regression of tourmaline percentage with depth of all samples.
![]()
Figure 7. Regression of rutile percentage with depth of all samples.
terrace, while decreased with depth in the second terrace, and increased with depth in the intermixing terrace. The presence of sub rounded to rounded garnet may indicate relatively long distance of transport and most probably derived from metamorphic source rocks. Similar results were found by [17] .
5) Sillimanite found as prismatic, colorless, and observed in all sediments with small mean content range from 2.67% - 5%, with irregular distribution throughout the entire depths and from the Nile stream (Figures 2-4). According to [2] , the presence of sillimanite in small amount might be sourced by metamorphic rocks or granite and genesis complex which contains significant amounts of sillimanite.
6) Andalusite found as square prisms, pink color Plate 1(a) , and observed in all sediments with mean range from 0.33% - 29%. The distribution of andalusite shows irregular pattern throughout the entire depths and from the Nile stream (Figures 2-4). The presence of the andalusite may indicate reworked sediments and most probably derived from argillaceous rocks subjected to contact metamorphism around igneous intrusions [18] (Table 3).
3.4. Proportion of Zircon, Tourmaline and Rutile (ZTR Index)
Table 4 presents data of ZTR values. The results revealed that the average zircon, tourmaline and rutile proportions (ZTR index), was distributed as 54.18%, 48.22% and 36.25%, in the first, second and intermixing terraces, respectively. The heavy minerals assemblages in the sediments of the study area were characterized by low zircon, tourmaline and rutile proportion (ZTR index) which is used as clue for the identification of the source and as measure of the maturity of the sediments. According to [6] , these soils mineralogically are immature sediments. The regression of zircon with ZTR, tourmaline with ZTR and rutile with ZTR are shown in (Figures 8-10), respectively.
![]()
Table 3. Descriptive statistical parameters of heavy minerals of the sediments in the study area.
STD―standard deviation.
![]()
Table 4. Zircon, tourmaline and rutile index (ZTR index).
![]()
Figure 8. Regression of zircon percentage with ZTR index of all samples.
![]()
Figure 9. Regression of tourmaline percentage with ZTR index of all samples.
![]()
Figure 10. Regression of rutile percentage with ZTR index of all samples.
4. Conclusion
The descriptive statistical parameters of the grain size reveal that most sediments samples belong within very poorly sorted to extremely poorly sorted, strongly negative skewed to strongly positive skewed, mesokurtic to very leptokurtic which indicate that the energy of the depositing is not sufficient enough to enhance the degree of sorting as well as fluvial and Aeolian sediments which are the dominant environments in the investigated area. The quartz is the dominant in the opaque minerals in all sediment and represents about 95% of the total light minerals. In addition, six non-opaque heavy minerals were found in the very fine sand fraction (0.063 - 0.125 mm) in the surficial and subsurficial sediments. These minerals were zircon, tourmaline, rutile, garnet, silliminite and andulsite. Therefore, we conclude that the non-opaque heavy minerals in the Nile river terraces at Khartoum North are originally derived from gneisses and schist metamorphic rocks as well as igneous rocks of the Ethiopian plateau.
Acknowledgements
The authors are indebted their greatly thank to Technical Assistant Khalid El-Enazi, Laboratory of Remote Sensing and GIS, College of Food and Agric. Sciences, King Saud University for his help. Thanks is also extend to all staff of the Central petroleum Laboratory, Ministry of Energy, Sudan, for using all laboratory facilities, their help and valuable suggestions during samples preparation and analyses of heavy minerals.
NOTES
![]()
*Corresponding author.