1. Introduction
TiO2 belonging to large band gap semiconductor oxides family has interesting properties. Moreover, this oxide has a high refractive index and a low absorption coefficient in visible light, properties which can be used as an optical coating material [1] . In the same line, TiO2 thin films have been tested in various electronic and optoelectronic devices such as: photovoltaic solar cells [2] , gas sensors [3] , electrochromic displays and photocatalyst [4] . Thin films of this oxide have been obtained by diffrent vacuum techniques especially via chemical vapor deposition [5] , pulsed laser deposition [6] and sputtering [7] .
Since the report of photoelectrochemical activity of water on TiO2-electrode in 1972 [8] , TiO2 has attracted tremendous attention. Nevertheless, pure TiO2 is especially active in the ultraviolet light range due to its large band gap energy of about 3.2 eV (anatase structure phase). As solar energy is the most important alternative energy source in the future [9] , this rather high band gap limits the use of the wide energy window of sun light. To shift the response of photocatalytic activity of TiO2 from ultraviolet (UV) to visible domain, various works have been carried to tune the band gap of TiO2 for the efficient absorption of the visible light. Among these studies, there are few attempts on the photocatalytic activity using Cr doped TiO2 thin films [10] -[13] .
During the last two decades, TiO2 doped with 3d-transition metals (Cr, Fe, ···) has been mostly investigated because it is able to establish energy levels inside the band gap leading to noticeable visible light absorption [14] -[19] . The photocatalytic activity using transition metals in such an oxide is still under investigation. While the formation of impurity energy levels contributes to the increase of the absorption of photons having energy lower than TiO2 band gap, the lifetime of the charge carriers is made much shorter in transition metals dopedTiO2. Thus, an increase of the combination rate of the charge carriers in doped-TiO2 involves a reduction of the photocatalytic activity. A previous systematic investigation [15] on the photocatalytic activity of TiO2 doped with metallic ions showed that the charge recombination processes largely depended on both the content of the doping metallic element and its type. Small concentrations of transition metals less than 1%) lead to a lot of traps for electrons and/or holes, and then increase the recombination processes [16] . However, this low concentration is not sufficient to the increase of the absorption of visible light by TiO2. On the contrary, high doping of about 5% - 10% may lead to an efficient narrowing of the TiO2 band gap. It simultaneously introduces new recombination centers, then increases the recombination rates [20] . Obviously, it is important to solve the recombination problem by moderately doping TiO2 films. The aim of the present work is to enhance the visible light absorption efficiency of TiO2 films by doping with Cr metal, using the co-sputtering deposition technique. The effect of doping content on the photocatalytic efficiency of TiO2 has been studied by using the amido black dye.
2. Experimental
2.1. Films Preparation
Undoped and Cr-doped TiO2 (TiO2:Cr) thin films were deposited by means of RF magnetron sputtering (13.56 MHz) on both Si and quartz substrates. The experimental setup used in this work has been described in greater details elsewhere [21] . The substrates were mounted on a holder and placed at a distance of ~20 cm from the sputtering target. To deposit TiO2: Cr films, we have proceeded with the concomitant sputtering of both highly pure TiO2 and Cr targets. To achieve an independent control of the Cr incorporation into the TiO2: Cr films, the TiO2 target was powered with an RF power of 360 W, while the Cr target was sputtered with variable power values (PCr) ranging from 8 W to 150 W. During deposition, the substrate holder was rotated at 5 rpm to achieve high thickness uniformity over the 6 inch-diameter coated area. The deposition temperature was kept at ~25˚C and the sputtering time was set to 120 min. The deposited TiO2:Cr films were post-annealed at 550˚C for 75 min under O2.
2.2. Experimental Characterizations
The crystallographic structures of pure and doped TiO2 films were characterized by XRD using a Philips X’PertMPD X-ray diffractometer (CuKα radiation), in grazing incidence geometry at 0.5˚. The surface morphology of the as-grown and annealed films was examined by means of atomic force microscopy (AFM) (Veeco Instruments Nanoscope III). The Raman spectra were taken at room temperature in backscattering configuration using the 488 nm Ar+ laser line as excitant with an incident laser power set to 5 mW. The thickness of the films was estimated to be around 150 nm by means of a calibrated quartz crystal microbalance and by direct scanning electron microscopy (SEM) observations. Once the main structural properties of the films were determined, the optical properties, Urbach energy (Eu) and band gap of TiO2 films were investigated on the basis of our previous reported measurement by variable angle spectroscopic ellipsometry (VASE) [21] .
2.3. Photocatalytic Measurement
The photocatalytic activity of undoped and Cr-doped TiO2 films was evaluated by photodegradation of Amido Black. Photocatalytic activities were carried out in a multi UV lamp photo reactor with a maximum spectral intensity at 352 nm and UV output power of 1.4 Watt. The amido black concentration was measured at 617 nm using double beam UV-Visible spectrophotometer.
During irradiation, the samples were withdrawn at every 4 minutes intervals.
3. Result and Discussion
In our previous work we have reported that as Cr concentration in Cr-doped TiO2 films varies between 2% and 17% the PCr increases from 8 to 150 W [21] .
The room-temperature deposited TiO2: Cr films are mainly amorphous containing some TiO2 nanocrystallites, of which increases with the Cr content. Figure 1 shows the effect of annealing under oxygen on the crystallinity of the TiO2-Cr layers. It is found that the anatase phase predominates for films containing Cr concentrations below or equal to 4%. Beyond this value, a rutile phase transition is observed.
The grain size was evaluated from the full width at half maximum (FWHM) using the Debye Scherrer formula [22] . The size was estimated using the (101) orientation for the Cr-doped TiO2 films crystallizing in the anatase phase and (110) orientation for those crystallizing in the rutile one. Figure 2 shows that the crystallite size varies between 35 and 7 nm as the doping concentration increases from 0 to 17%. This suggests that the growth of TiO2 grains is limited by Cr content [23] .
For high Cr content (≥7%), AFM (Figure 3) reveals the presence of pebbly nanofeatures, which corroborates with the shrinking of crystallite size revealed by XRD. This indicates that the TiO2 grains increase[s] with Cr concentration (for [Cr] < 7%) and give rise to a relatively rougher surface. Beyond this Cr concentration, it is possible that the TiO2 grainsize is limited by the presence of Cr atoms (most likely at grain boundaries) and this limitation becomes more prominent as Cr content increases. The roughness (RMS) increases with Cr-doping and reaches a maximum value around 7%, beyond this value it drops again and remains almost insensitive to the Cr metal content for higher concentration. Interestingly, this RMS variation occurs around 7% Cr, which is likely to correlate with the occurrence of the anatase-to-rutile phase transition.
Raman analysis (Figure 4) confirms the results obtained from XRD (Figure 1). The TiO2 films annealed at 550˚C show a good crystallinity and an anatase-to-rutile phase occurs for Cr concentration exceeding 4%. In the literature, the band position corresponding to the anatase phase is EgA = 144 cm−1 while that corresponding to the rutile phase is EgR = 143 cm−1. We were interested to the EgA band because it is more intense and sharper, and facilitates observation and comparison between undoped and doped films. Figure 4 shows the presence of Raman band around 137 cm−1 for pure and Cr doped TiO2 films. This band shift to lower frequencies has been explained by many authors [24] as a consequence of the small crystallite size (less than 15 nm).
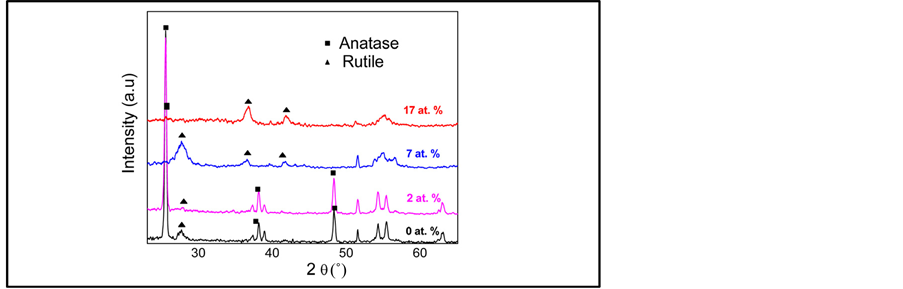
Figure 1. XRD patterns of TiO2 films as a function of Cr concentration (at.%).

Figure 2. Crystallite size of TiO2 films as a function of Cr content.

Figure 3. AFM images TiO2 films as a function of Cr content.

Figure 4. Raman Spectra of undoped and Cr-doped samples.
The gap energy varies between 3.3 eV and 2.0 eV with Cr concentrations increases [21] , with an abrupt transition around 7%. This evolution could be linked to the presence of acceptor states in the bandgap. Transition metals could also make significant changes on the electronic structure of a crystalline material and thus on the values of the gap energy [25] [26] . The decrease in the gap energy makes TiO2-Cr films wider range absorbers of UV-Visible light, constituting a major advantage in terms of photovoltaic applications.
Dopants generally provide Schottky barrier which facilitates the transfer/trapping of electrons from TiO2 and improves the photocatalytic efficiency. This effect due to the modification of the band structure of TiO2 by Cr may be verified by determining the material Urbach energy (Eu) before and after introduction of the dopant. Urbach energy gives a measure of the structural disorder in a material. The formula used to determine the Urbach energy is as follows [27] :
 (1)
(1)
The extinction coefficients, as estimated by ellipsometry characterization, were used to calculate the absorption coefficient (α) versus photon energy (hv) by the formula [28] :
 (2)
(2)
where K is extinction coefficient and λ is the wave length of an incident photon. The α values of all films in terms of photon energy are shown in Figure 5.
The Urbach energy was determined for undoped and Cr-doped TiO2 thin films (Figure 6).
The Urbach energy of the undoped TiO2 film is about 0.156 eV, while the Cr-doped film has an Urbach energy of 0.818 eV (for 17% Cr doped film). The difference in Urbach energy is caused by the impurity levels introduced by Cr doping in the band structure of undoped films. Since higher Urbach energy is indicative of considerable introduction of tail states at the band edges, the higher Eu value of Cr-doped films indicates further introduction of tail states as compared to undoped films. Moreover, it can be noticed that a critical Cr doping around 4% gives a minimum Eu value which in turn corresponds to the maximum grain size. This could be due to the formation of a CrO2 (a = 4.21 Å and c = 2.91 Å) phase that crystallizes in the same structure than TiO2 (tetragonal), therefore leading to a high lattice compatibility between doping and host matrices as previously reported [29] [30] . On the contrary, when Cr doping increases it appears other related oxides such as Cr2O3 (a = 4.95 Å and c = 13.58 Å) having hexagonal structure, (different to TiO2) causing high value of Eu and a decreases of the grain size.
The photocatalytic reaction is very sensitive to the catalyst surface. The reaction is initiated by the production of electron-hole pairs on TiO2 surface resulting from the absorption of photons with energy equal or greater than the band gap. The Amido Black (AB) reacts with the electrons generated on the TiO2 particles under UV irradiation. Figure 7 show the absorbance of AB at 618 nm as a function of UV light irradiation time for TiO2 films doped with 2% Cr. In order to demonstrate the degradation process, the spectra was recorded at different time intervals [times]. The experiments were repeated with two sets of films annealed at similar conditions and the results were found to be reproducible. Figure 8 shows the kinetic measurement of the effect of Cr content on the C/Co under light irradiation, indicating the photo-degradation of AB and inset Figure 8 show the Linear transform ln (Co/C) versus UV light irradiation time for Cr (2%) doped TiO2.
It was found that the photocatalytic degradation of the AB dye could be described by a first order kinetic model [31] :
 (3)
(3)
where Co is the initial concentration and C is the concentration at time t and k is the kinetic constant.

Figure 5. Spectral dependence of α for TiO2 films as a function of Cr concentration.
 (a)
(a) (b)
(b)
Figure 6. Effect of Cr doping on the band gap evolution: (a) Doping induced smearing of the valence and conduction band edges and formation of the Urbach tail; (b) Variation of the band gap and Urbach energy for different Cr concentrations.

Figure 7. Absorbance spectra of the AmidoBlack (10 mg/l) at various degradation time using Cr (2 at.%)doped TiO2 film.

Figure 8. Evolution of the Amido Black as a function of UV light irradiation time for Cr-doped TiO2 films having different Cr concentrations. Inset Linear transform ln (Co/C) versus UV light irradiation time for Cr (2 at.%) doped TiO2.
Figure 9 shows the increase of the photocatalytic activity for Cr concentration varying from 2% - 4%. This effect can be related to the surface morphology and to the crystal structure. In fact, the RMS of TiO2: Cr films increases from 1.5 to 3 nm as the Cr content varies from 0% to 4% (anatase phase). Higher surface roughness leads to an increase in the effective surface area, which in turn improves the photocatalytic activity.
The photocatalytic activity rate shows an optimum for sample doped with 2% of Cr. This optimum could be explained by the fact that the presence of dopant prevents the recombination of exciton. Further increase in loading of Cr decreased the % degradation of AB. This is due to the increased coverage of the semiconductor surface by the metal which decreases the surface adsorption sites expected to be available to the dye. The diminished penetration depth of light at higher concentration of Cr on surface could also prevent[s] the usual excitation of the semiconductor.
In summary, the observed optimum concentration of Cr is related to a combination of an optimum distribution of Cr nanoparticles (density) on the TiO2 surface and to an optimum Cr nanoparticles size. The effect of size on photocativity is well known phenomena. Henry [32] and Gaidi et al. [33] showed that very fine Pd/Pt particles are more active than the big ones. This size effect can be understood in term of the presence of additional adsorption sites for the dye at the particle surface. Increasing the number of surface atoms which have dangling bonds can serve as sites for adsorption. It was also reported that oxidized small metallic nanoparticles are more active than reduced one. The level of oxidation state increases with the decreasing size.
For big Cr particle size the catalytic effect is only superficial and will not affect efficiently the TiO2 electronic structure. Very high dispersion of dopant nanoparticles on TiO2 surface will also lead to small effect (Figure 10).
It clearly appears that much better photosensitivity would be achieved if the aggregate distribution in the film could be of very small particle sizes coupled with their high density.
Formation of vast oxygen vacancy with Cr doping could also contribute to the photocatalytic activity enhancement of TiO2. Cr-doping introduces substantial oxygen vacancy as reported by the XPS analysis (Figure 11), the oxygen vacancies in TiO2 act as electron traps which can bind the photoinduced electrons and play a significant role in inhibiting the recombination rate of photoinduced electron-hole pairs, thus enhancing the photocatalytic activity of TiO2 [10] .

Figure 9. Kinetic constant related to the discoloration of Amido Black versus Cr concentration.

Figure 10. Schematic distribution of Cr doping nanoparticles on TiO2 surface as a function of Cr doping content increases.

Figure 11. Effect of PCr on the ratio of oxygen concentration related to TiO2 and oxygen concentration related to CrOx.
4. Conclusion
The annealing of TiO2:Cr films leads to their crystallization with an anatase-to-rutile phase transition occurring at a specific Cr content of 7%. This structural transition was also found to affect the films optical properties which in turn change abruptly around the Cr content of 7%. The present results demonstrate that Cr-doped TiO2 films, with Cr concentration not exceeding 4% present higher photocatalytic activity than pure TiO2. It was found that a critical doping level of the order of 2% led to an improvement of the crystallinity of Cr-doped TiO2 films and especially a high photocatalytic activity. This was likely to be the result of an optimum Cr nanoparticle size combined to an optimum distribution density.
Acknowledgements
This work was financed by the Ministry of Higher Education, Scientific Research and Technology of Tunisia and Institut National de la Recherche Scientifique Canada, INRS-Énergie, Matériauxet Télécommunications (INRS-EMT).