Removal of Cu(II), Pb(II) and Zn(II) Ions from Aqueous Solutions Using Selected Agricultural Wastes: Adsorption and Characterisation Studies ()
1. Introduction
Anthropogenic activities such as industry, agriculture and mining have significantly release excessive amounts of toxic metal ions into three compartments of the environment, namely water, air and soil. The waste effluents from metal plating, battery manufacturing, mining and smelting are the main sources of metal ions in water environment [1] -[4] . Heavy metals such as Cd, Cu, Hg, Ni, Pb and Zn are toxic, non-biodegradable and persist in the environment [5] -[8] . They will accumulate in water and soil, and therefore can cause detrimental effects to living organisms as they consume the products from these sources [2] [9] -[11] . For example, consumption of foods with high concentration of Pb may cause blood enzyme dysfunction, anaemia and neurological disorders such as memory deterioration and reduced cognitive ability.
Membrane filtration, chemical coagulation, oxidation, solvent extraction and ion exchange [4] [9] [12] [13] have been proposed for the remediation of metal contaminated water. These strategies are effective in lowering metal contamination risk. However, they are expensive and limited to high concentration of metal ions [8] [11] . Adsorption is one of the most favourable techniques applied for water treatment, mainly because it is suitable for low concentration of metal ions and cost effective [8] [10] [12] .
Adsorption is a phyico-chemical process where the substance called adsorbate accumulates at the interface of solid called adsorbent [10] [13] . Activated carbon is commonly used as an adsorbent for water treatment because it has porous structure and large surface area [6] [13] [14] . In spite of its great physical properties, the use of activated carbon is restricted to its high cost [9] [15] . Therefore, alternative adsorbents derived from low-cost materials should be introduced to minimise the operating cost particularly in developing countries.
Low-cost adsorbents can be defined as materials that are abundant in nature and waste from industries [10] [13] [16] . Several low-cost materials such as peanut husk charcoal and fly ash [2] , scoria [3] , Moringa oleifera bark [4] , orange peel [6] , watermelon shell [15] , sunflower leaves [16] , Eichhnornia crassipes [17] , soybean meal waste [18] , Punica granatum peel waste [19] , Acacia leucocephala bark [20] , wheat straw [21] and maize cob [22] have been tested to remove metal ions from aqueous solutions.
In this study, the potential of three agricultural wastes, namely durian (Durio zibethinus L) tree sawdust (DTS), coconut coir (CC) and oil palm empty fruit bunch (EFB) as biosorbents for the removal of Cu(II), Pb(II) and Zn(II) from aqueous solutions was investigated. The influence of solution pH and initial metal concentration on adsorption capacity was studied. The equilibrium adsorption data were fitted with Freundlich and Langmuir isotherm models. Scanning Electron Microscope (SEM), Energy Dispersive X-ray Spectrometer (EDX) and Fourier Transform Infrared Spectrometer (FTIR) were used to understand the adsorption mechanism(s).
2. Materials and Methods
2.1. Materials
DTS was collected at Jati Cemerlang Sawmill, Selangor, CC was obtained from APA Green Horticulture, Perak and EFB was supplied by Changkat Asa Oil Palm Estate, Perak. KNO3, NaOH and HCl were purchased from HmbG Reagent Chemicals. Cu(NO3)2·3H2O and Zn(NO3)2 were supplied from GENE Chemicals, meanwhile Pb(NO3)2 was from Bendosen Laboratory Chemicals. Cu, Pb and Zn Atomic Absorption Spectrometer (AAS) standard calibration solutions were obtained from Fisher Scientific. All reagents used were of analytical reagent grade and deionised water was used throughout this study.
2.2. Preparation of Biosorbents
DTS, CC and EFB were washed with deionised water and dried in oven at 70˚C for 7 days. The materials were ground using a mechanical grinder and sieved through 150 - 250 µm size fraction using American Society for Testing and Materials (ASTM) standard sieve. Ground materials were kept in self-sealing plastic bags to avoid moisture effects.
2.3. Characterisation of Biosorbents
The surface area and pore diameter of the biosorbents were determined using a Quantachrome Autosorb l Surface Analyser. The surface area (0.90, 5.90 and 1.20 m2/g) and pore diameter (4.10, 8.80 and 3.60 nm) for DTS, CC and EFB were determined using the Brunauer-Emmett-Teller (BET) multipoint [23] and the Barrett, Joyner and Halenda (BJH) [24] techniques, respectively. To determine the pH of the biosorbents, an appropriate amount of biosorbents were dissolved in 50 mL of 0.1 mol/L KNO3. The pH readings were measured using a Thermo Scientific Orion 2-Star pH meter.
The presence of functional groups on the biosorbents was confirmed using a Thermo Nicolet 6700 FTIR Spectrometer. The surface morphology of the biosorbents was examined using a Hitachi SU 8020 UHR Field Emission Scanning Electron Microscope. The biosorbents were first coated with platinum to avoid charging. The elemental composition of the biosorbents was determined by using a Horiba Energy Dispersive X-ray Spectrometer.
2.4. Batch Adsorption Experiments
Stock metal solutions (1000 mg/L) were prepared by dissolving appropriate amounts of metal ion salts in 0.1 mol/L KNO3 solutions. KNO3 served as an electrolyte to control the ionic strength of metal ions. The stock solution was then diluted to the required concentrations. The batch absorption experiments were carried out in 250 mL conical flasks and a Protech Orbital Shaker (model 720) was used to equilibrate the solutions at 100 rpm. The samples were then filtered through filter paper (Filtre Fioroni 601, 125 mm). The concentration of metal ions in the supernatant was measured using a Perkin-Elmer AAnalyst 400 Atomic Absorption Spectrometer.
The effect of solution pH was studied in the pH range of 2.0 - 6.0. The initial pH of the 50 mL of 50 mg/L metal ion solutions was adjusted by using either 0.05 mol/L HCl or 0.05 mol/L NaOH solution. About 0.1 g of biosorbent was added to 50 mL of metal ion solution, the mixture was then shaken for 90 min. Isotherm studies were accomplished by shaking 0.1 g of biosorbents in 25 mL of metal ion solution with an initial metal concentration ranging from 0 to 200 mg/L. All experiments were run in triplicates. The adsorption capacity at equilibrium (qe) was calculated.
3. Results and Discussion
3.1. Adsorption Studies
3.1.1. Effect of Solution pH
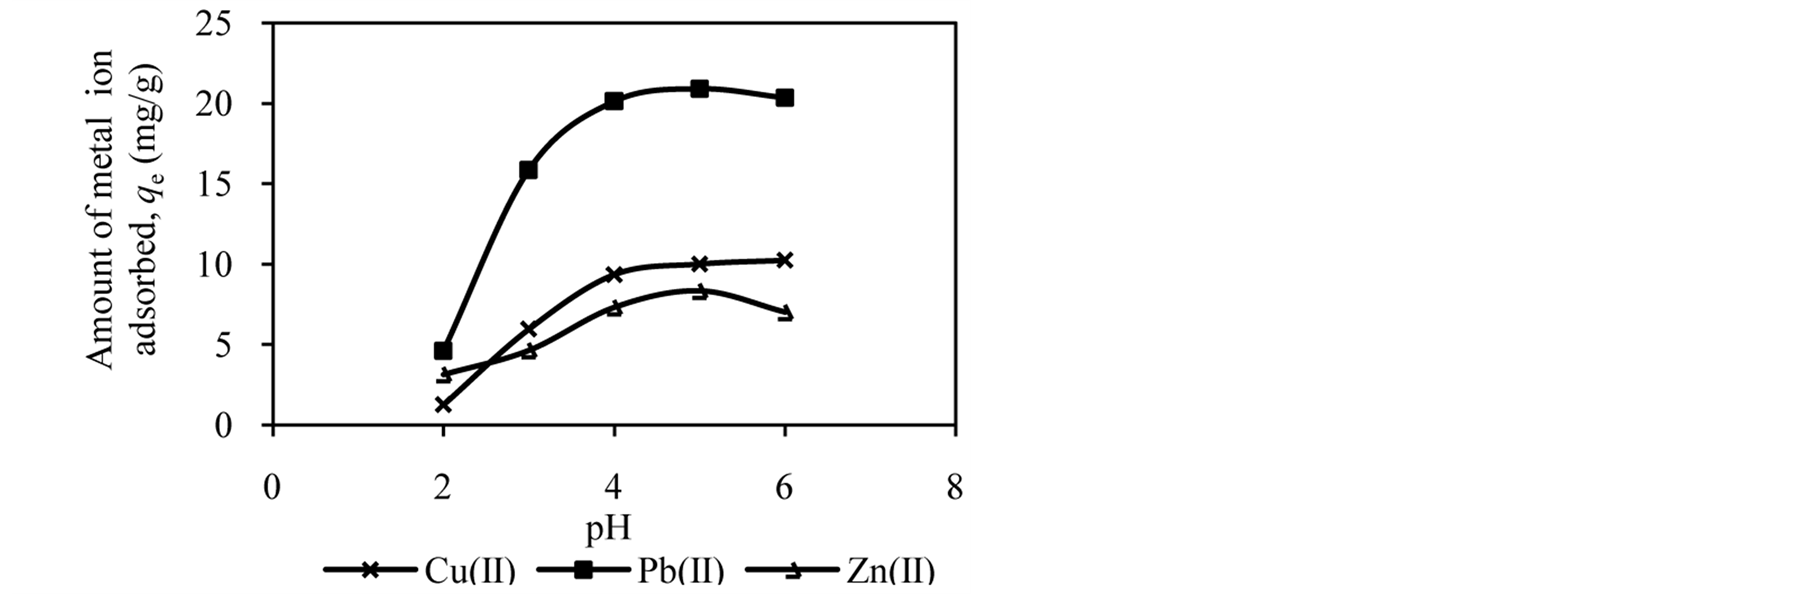
The pH of the solution has significant effect on adsorption process as it influences the charge on the surface of adsorbents and metal ion speciation in aqueous solution [2] [7] [25] . The studies of effect of solution pH were carried out in the pH range of 2.0 to 6.0. Figure 1 shows the effect of solution pH on the amount of metal ion adsorbed onto DTS, CC and EFB. From Figure 1, an increase in the solution pH from 2.0 to 6.0 has increased the amount of Cu(II) adsorbed. In the case of Pb(II) and Zn(II), the amount of metal ions adsorbed increased until pH 5.0. The removal of both ions was found to decrease at pH 6.0. This observation can be explained by the fact that the concentration of H3O+ ion was high at low pH. This scenario will cause competition between H3O+ and metal ions for active sites on the surface of biosorbents [4] [16] [21] [26] . As the solution pH increased the concentration of H3O+ ion in the solution decreased, lowering the competition of metal ion for active sites.
The optimum pH for adsorption of Cu(II), Pb(II) and Zn(II) was recorded at pH 5.0. The decrease in removal of Pb(II) and Zn(II) at pH greater than 6.0 may be due to solvation and hydrolysis of metal ion, as shown in the following reactions [3] :
 (1)
(1)
 (2)
(2)
 (3)
(3)
The solvation and hydrolysis process lead the metal ion to form soluble hydroxilated complexes that compete
 (a)
(a)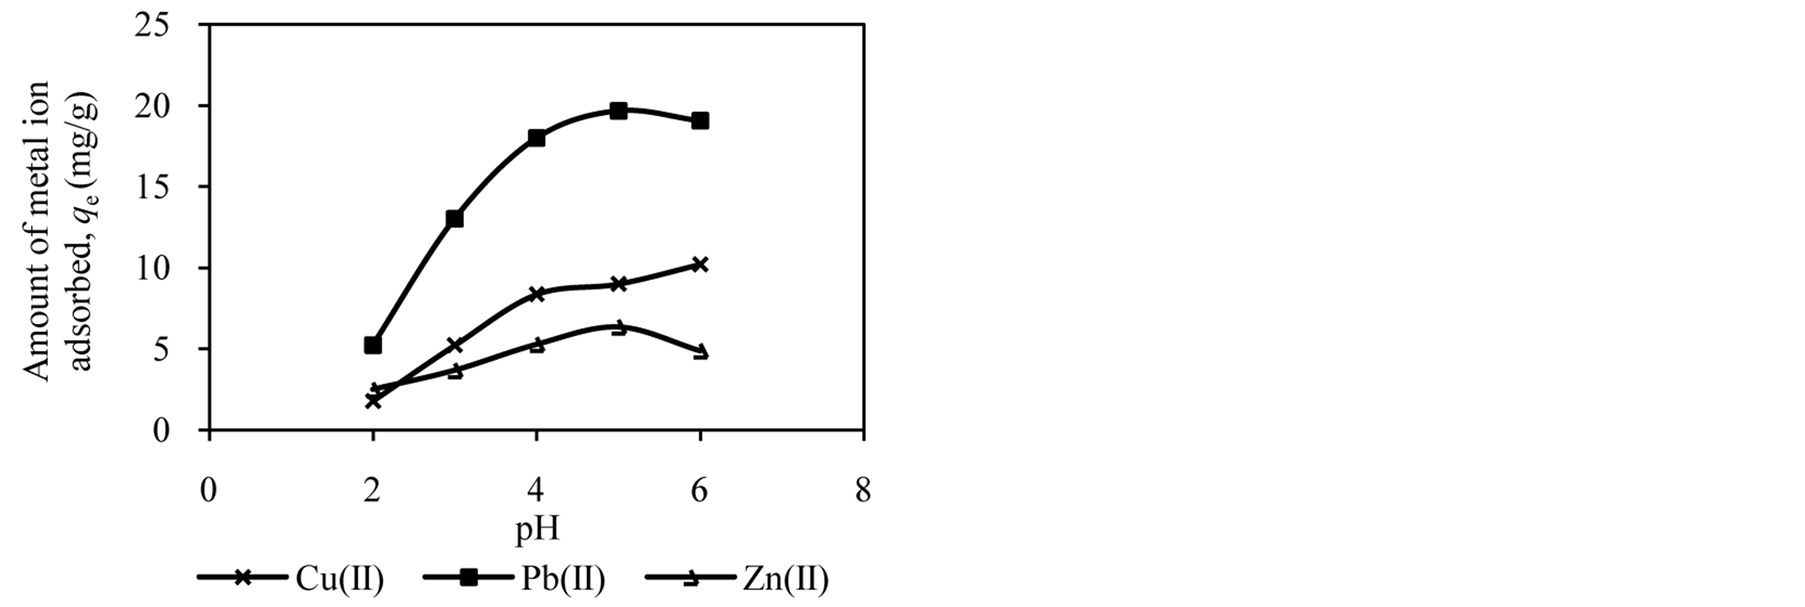 (b)
(b)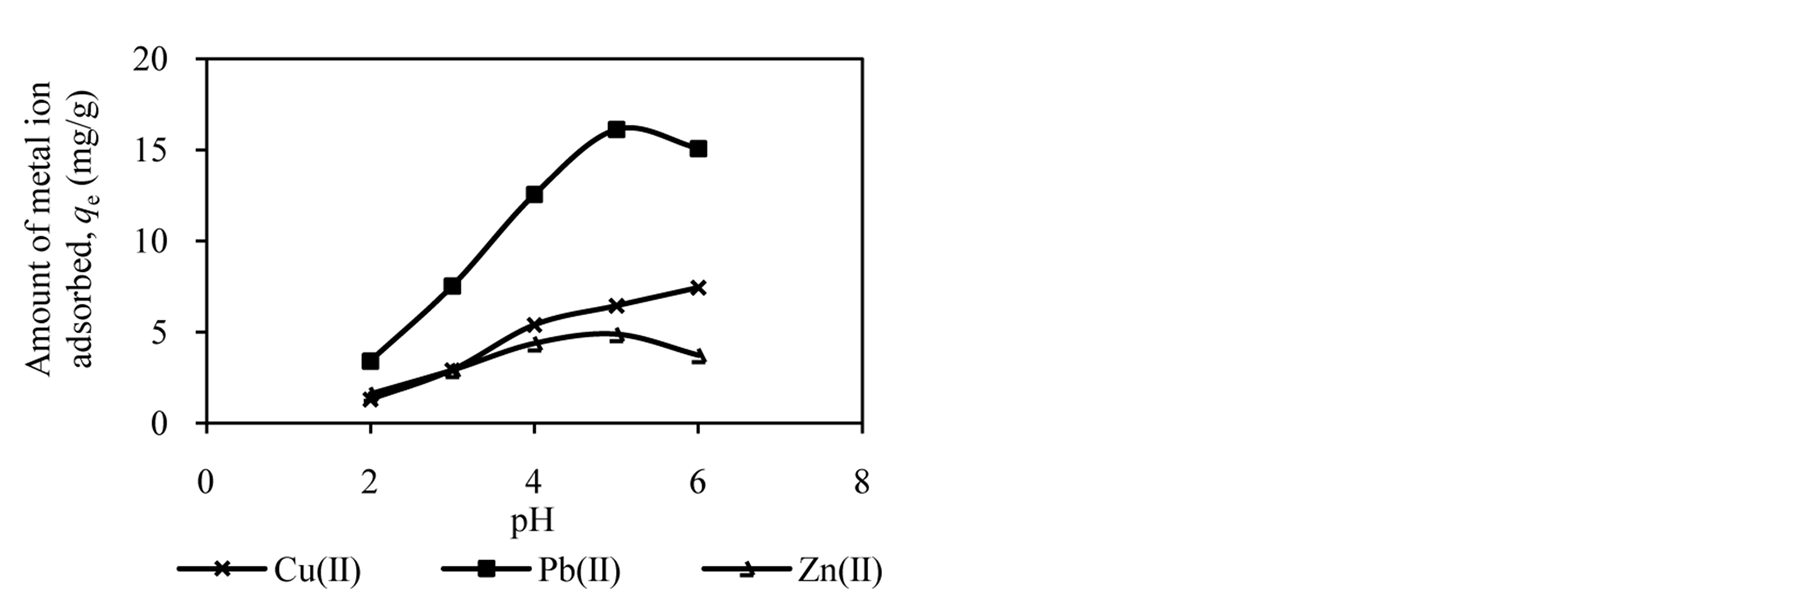 (c)
(c)
Figure 1. Effect of solution pH on adsorption of metal ion by (a) DTS, (b) CC and (c) EFB.
for active sites. Moreover, the nature of ionisation on the surface of biosorbents at specific pH may also cause the reduction of metal ion removal [20] .
3.1.2. Effect of Initial Metal Concentration
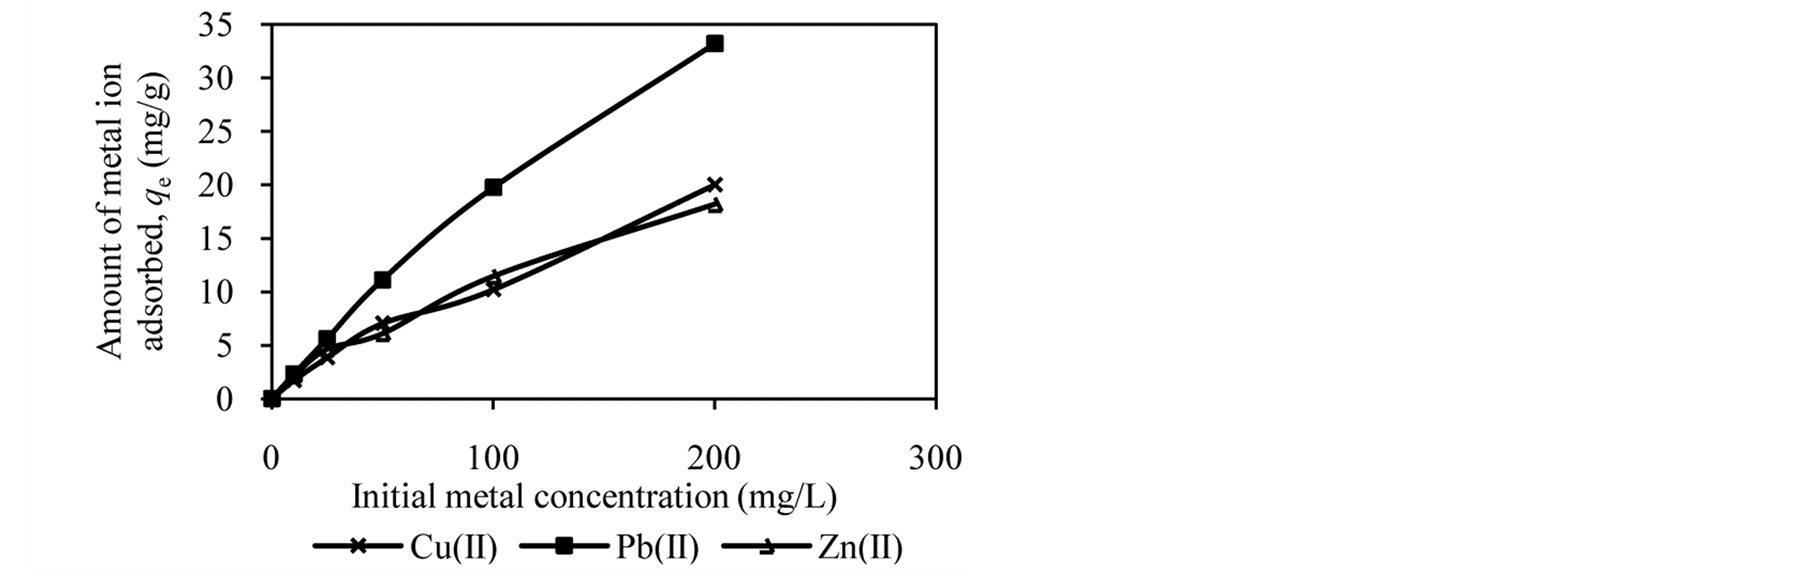
Figure 2 shows the trends in the metal ion adsorption at different initial metal concentrations. It was observed that the amount of metal ion adsorbed increased as the initial metal concentration increased. For example, at an initial concentration of 10 to 200 mg/L, the amount of Cu(II), Pb(II) and Zn(II) adsorbed by DTS increased from 2.09 mg/g to 16.62 mg/g, 2.37 mg/g to 20.01 mg/g and 1.57 mg/g to 15.65 mg/g, respectively (Figure 2(a)).
At low initial metal concentrations (10 and 25 mg/L), almost all metal ions have been removed from aqueous solution. When the initial metal concentration was increased, the adsorption efficiency decreased. High adsorption at low initial metal concentrations can be attributed to availability of vacant sites for metal binding [4] [12] [27] . In contrast, at high initial metal concentrations the active sites of biosorbents are less available, reducing metal ion removal. It can be conclude that DTS, CC and EFB are able to bind metal ion over wide range of concentration.
3.1.3. Isotherm Models
Adsorption isotherm models have been used to describe the interaction between metal ion in solution and adsorbents [9] [26] [27] . In addition, the isotherm models can be used to explain the distribution of metal ion between the liquid and solid phase when equilibrium was reached [25] [27] [28] . The most widely used isotherm models are Freundlich and Langmuir models.
Freundlich isotherm model deals with adsorption at multilayer heterogeneous surface [12] . According to Freundlich isotherm model, during adsorption process stronger binding sites will occupy first [29] . As more sites occupied by metal ion, the binding strength becomes weaker [27] . The linear form of the Freundlich equation is [30] :
 (a)
(a)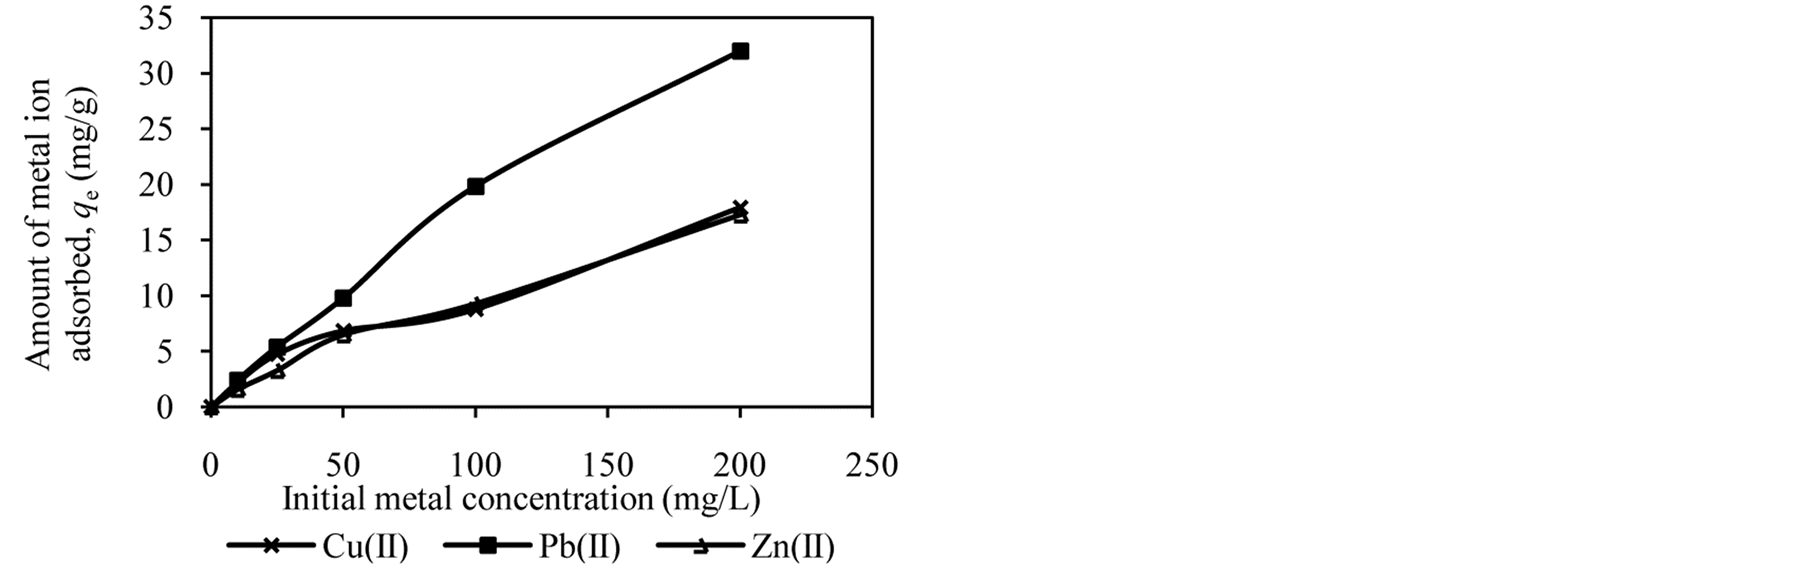 (b)
(b)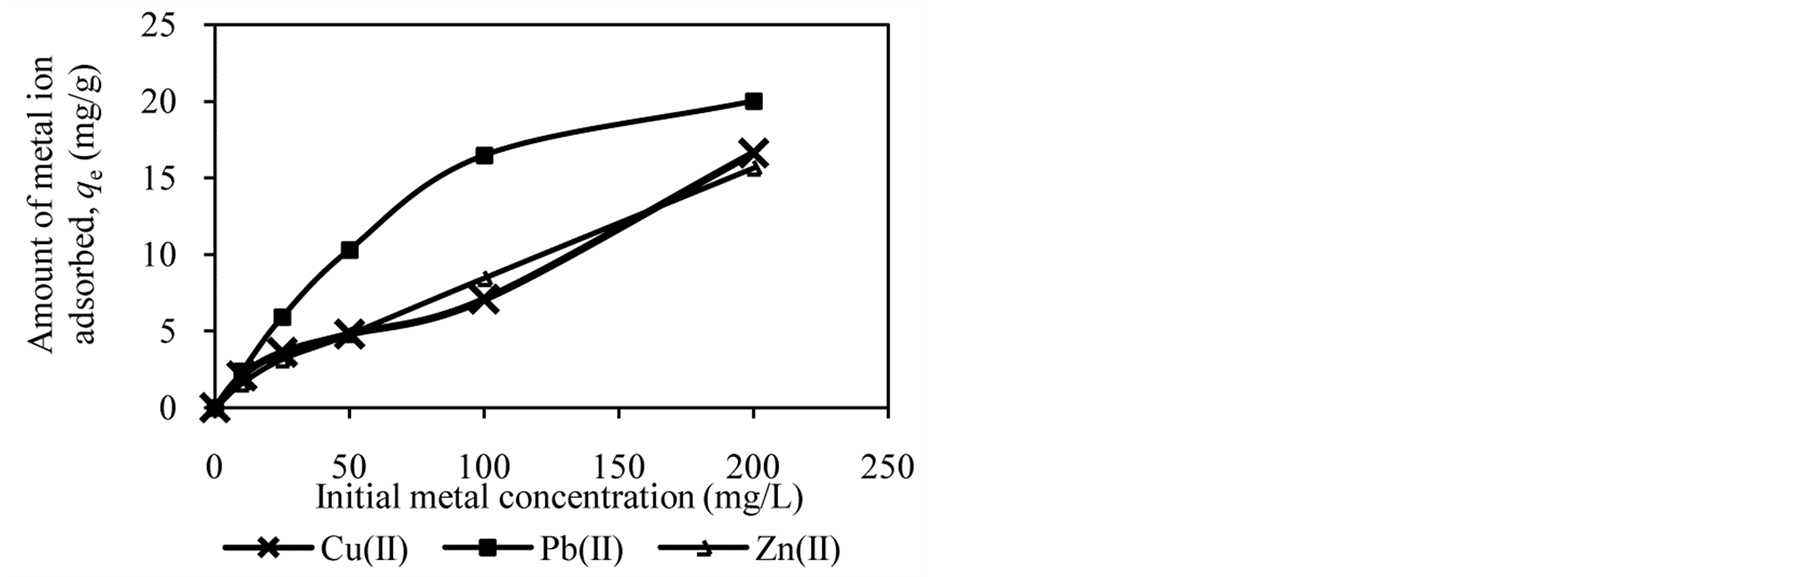 (c)
(c)
Figure 2. Effect of initial metal concentration on adsorption of metal ion by (a) DTS, (b) CC and (c) EFB.
 (4)
(4)
where KF (mg/g) and n are the Freundlich constants related to adsorption capacity and intensity, respectively. A linear plot of qe against log Ce will give KF and n values.
The Langmuir isotherm model assumes all sites on adsorbents have equal energy [3] [6] . During adsorption process, metal ion forms a monolayer on the adsorbent surface and when all sites are occupied, there will be no more binding can take place [27] [28] . The linear form of the Langmuir equation can be expressed as [31] :
 (5)
(5)
where Q is the maximum adsorption at monolayer (mg/g), Ce is the equilibrium concentration of metal ion (mg/L), qe is the amount of metal ion adsorbed per unit weight of adsorbent at equilibrium concentration (mg/g) and b is the Langmuir constant related to the affinity of binding sites (mL/mg) and is a measure of the energy of adsorption. Q and b can be determined from the linear plot of Ce/qe against Ce.
Table 1 lists the calculated Freundlich and Langmuir isotherm constants. From Table 1, with exception of Pb(II) adsorption onto DTS, the adsorption of metal ion onto biosorbents was correlated well with the Freundlich isotherm model. The adsorption of Pb(II) onto DTS was best described by the Langmuir isotherm model. The maximum adsorption capacities (Q) estimated from the Langmuir isotherm model for Cu(II), Pb(II) and Zn(II) were 18.42, 20.37 and 22.78 mg/g for DTS, 18.38, 37.04 and 24.39 mg/g for CC, and 26.95, 37.59 and 21.19 mg/g for EFB, respectively.
The maximum adsorption capacities (Q) estimated from the Langmuir isotherm model were in the order of: Zn(II) > Pb(II) > Cu(II) for DTS, Pb(II) > Zn(II) > Cu(II) for CC and Pb(II) > Cu(II) > Zn(II) for EFB (Table 1). A similar trend of Pb(II) > Cu(II) > Zn(II) was reported for Scoria [3] and Sphagnum peat [32] . Meanwhile, Saeed et al. [33] reported adsorption affinity of Pb(II) > Zn(II) > Cu(II) for metal ions adsorption onto black

Table 1. Freundlich and Langmuir isotherm constants for metal ion adsorption by DTS, CC and EFB.
gram husk. From Table 1, the higher value of b for Pb(II) suggests better affinity for metal binding onto DTS, CC and EFB, as compared to Cu(II) and Zn(II). The stronger affinity of biosorbents towards Pb(II) than Cu(II) and Zn(II) can be related to ionic radius and atomic weight. Pb(II) has larger ionic radius (0.132 nm) than Zn(II) (0.083 nm) and Cu(II) (0.072 nm) [34] . Furthermore, Pb has heavier atomic weight (207.2 g/mol) than Zn (65.4 g/mol) and Cu (63.5 g/mol) [34] . These characteristics ease valence electrons in the Pb(II) ion to polarise and therefore have less degree to be retained by the nucleus [32] [35] .
The 1/n values calculated from the Freundlich isotherm model (Table 1) lie between 0 and 1. This suggests that the adsorption of metal ions onto biosorbents was favourable. The adsorption behaviour onto biosorbents was further evaluated by separation factor (RL). RL is a dimensionless constant obtained from the Langmuir isotherm model. It can be expressed as [36] :
 (5)
(5)
As described by Hall et al. [36] , RL values indicate the shape of isotherm: (1) unfavourable (RL > 1), (2) linear (RL = 1), (3) favourable 0 < RL < 1, and (4) irreversible (RL = 0). The RL values for Cu(II), Pb(II) and Zn(II) following adsorption by DTS, CC and EFB were in the range 0 < RL < 1. This indicates that the adsorption of metal ions was favourable.
The maximum adsorption capacity (Q) of DTS, CC and EFB for Cu(II), Pb(II) and Zn(II) was compared with other low-cost adsorbents. From Table 2, it is apparent that the adsorption capacity of biosorbents studied was comparable with other adsorbents. The difference in metal uptake by various adsorbents may be due to the difference in physical and chemical characteristics of the adsorbents [4] .
3.2. Characterisation Study
3.2.1. SEM Analysis
The SEM analysis was performed to observe the surface morphology of the biosorbents before and after metal ion adsorption. The SEM images for DTS before and after metal interaction at 10,000× magnification are shown in Figure 3, as an example. SEM analysis revealed that there were significant changes on the surface of biosorbents after interaction with metal ions.
Before metal ion adsorption, DTS displayed a smooth and dense surface texture with little grooves on the surface (Figure 3(a)). After interaction with Cu(II) and Pb(II), the surface of DTS became irregular. Flakes-like and bean-like deposits were observed on the surface of DTS following interaction with Cu(II) and Pb(II) (Figures 3(b) and (c)). Interaction with Zn(II) has resulted in the formation of precipitate on the surface of DTS (Figure 3(d)). CC had a flat and smooth surface texture (data not shown). Interaction with Cu(II) changed the morphology of CC to irregular and resulted in appearance of flake-like deposits. Seed-like and lump-like depo
Table 2. Comparison of maximum adsorption capacity (Q) estimated from Langmuir isotherm model for various low-cost adsorbents.
sits were observed on the surface of CC after Pb(II) and Zn(II) adsorption.
EFB has a dense and rough surface texture (data not shown). Interaction with Cu(II) led to formation of flakelike and lump-like deposits. Meanwhile, square-shape deposits were observed after Pb(II) adsorption. Interaction with Zn(II) resulted in the formation of coral-like deposits on the EFB surface.
3.2.2. EDX Analysis
The purpose of EDX analysis was to determine the elemental composition in the biosorbents. It was found that carbon and oxygen were the major constituents in all biosorbents (data not shown). The features of carbon and oxygen can be observed at 0.27 and 0.52 keV, respectively. The features of platinum can be observed on the EDX spectrum at 2.05 and 9.44 keV. As described in Section 2.3, the biosorbents were coated with platinum prior to analysis to avoid charging.
The features of Cu, Pb and Zn were observed in each EDX spectrum of biosorbents after metal ion adsorption. The EDX spectrum for DTS after adsorption of Pb(II) is shown in Figure 4, as an example. The features of Cu appeared at 0.93 and 8.04 keV. The features observed at 2.34 and 10.58 keV can be assigned to Pb (Figure 4). Interaction with Zn(II) has caused the appearance of Zn features at 1.01 and 8.37 keV. Overall, results from EDX analysis suggest that the biosorbents studied are capable of binding metal ions.
3.2.3. FTIR Analysis
FTIR analysis is important to confirm the functional groups present in the biosorbents. Furthermore, it provides information on binding mechanism and possible functional groups involved in the interaction with metal ions. The FTIR spectra of EFB, before and after metal ion adsorption are shown in Figure 5, as an example. Based on Figure 5(a), a broad and strong band observed at 3271 cm−1 corresponds to OH group. Two discernible absorption bands at the wavenumbers of 2916 cm−1 and 2848 cm−1 can be assigned to alkyl groups. The N-H bending vibration of amine group can be seen at 1579 cm−1. The absorption band observed at 1247 cm−1 represents C-N

Figure 4. EDX spectrum of DTS after adsorption of Pb(II).

Figure 5. The FTIR spectra of EFB (a) before and after adsorption of (b) Cu(II), (c) Pb(II) and (d) Zn(II).
stretching vibration. The strong and sharp band at 1036 cm−1 is assigned to C-O stretching vibration [42] .
There were significant changes on FTIR spectrum of EFB after interaction with Cu(II), Pb(II) and Zn(II) ions (Figures 5(b)-(d)). For example, new absorption bands were observed at 1509 cm−1, 1510 cm−1 and 1538 cm−1 following interaction with Cu(II), Pb(II) and Zn(II). According to Williams and Fleming [43] , these absorption bands are related to N-H bending vibration of amine group. The absorption intensity of N-H bending vibration was in the order of EFB + Zn(II) > EFB + Pb(II) > EFB + Cu(II) (Figures 5(b)-(d)). Absorption bands correspond to OH groups, C-N and C-O stretches were found to shift after metal ion absorption. For example, absorption band related to OH group shifted from 3271 cm−1 to 3318 cm−1, 3261 cm−1 and 3288 cm−1 following interaction with Cu(II), Pb(II) and Zn(II), respectively. In the case of C-N stretching vibration, the absorption band shifted from 1247 cm−1 to 1240 cm−1, 1242 cm−1 and 1236 cm−1 after absorption of Cu(II), Pb(II) and Zn(II), respectively.
FTIR analysis on DTS and CC revealed that both biosorbents have similar functional groups to that of EFB (data not shown). The absorption bands related to hydroxyl and amine groups, C-H stretch of alkyl groups, C-O and C-N stretches were observed on FTIR spectra of DTS and CC. Interaction of DTS and CC with metal ions has also resulted in a shift in wavenumbers of functional groups. This suggests that the binding mechanisms of Cu(II), Pb(II) and Zn(II) to DTS, CC and EFB are rather similar.
Presumably, the formation of new absorption bands, the change in absorption intensity and the shift in wavenumber of functional groups could be attributed to complexation between metal ions and binding sites of biosorbents. The binding mechanism involved electron pair sharing between electron donor atoms (O and N) and metal ion. FTIR suggests that both hydroxyl and amine groups are indeed the main adsorption sites in DTS, CC and EFB.
4. Conclusion
Results from this study suggest that DTS, CC and EFB can be used as effective biosorbents for the removal of Cu(II), Pb(II) and Zn(II) ions from aqueous solutions. Their key property is the presence of functional groups that can bind metal ions through complexation. Adsorption and characterisation studies however are preliminary evaluation of such utilisation for water clean-up. It is also necessary to investigate the efficacy of DTS, CC and EFB to treat real industrial effluents. There is a ready supply of agricultural wastes worldwide. The use of such materials will not only convert waste materials into low-cost effective adsorbents, but also provide a solution to their disposal.
Acknowledgements
This work was supported by the Universiti Pendidikan Sultan Idris Malaysia under Research Grants GPU 2011- 0112-102-01 and 2013-0120-102-01, and Ministry of Education Malaysia under Research Grant RACE 2012-0150-108-62. We thank Mr. Mohd Zurin Mahmud, Miss Siti Noor Farina Mohd Fuad Ooi and Mr. Mohd Hashimi Ma’ani for their assistance.
NOTES
*Corresponding author.