GIS and Multicriteria Decision Analysis for Landfill Site Selection in Al-Hashimyah Qadaa ()
1. Introduction
Waste problem all over the world is of growing concern especially in developing countries [1] [2] . Source reduction, recycling and waste transformation are methods widely used to manage solid waste, however, in all these methods there is always a residual matter even after the recovery process for disposal. The necessity of getting rid of these waste yields in an economical way is referred to as landfilling [3] . Landfill siting is an extremely difficult task to accomplish because the site selection process depends on different factors and regulations. It is becoming increasingly difficult due to growing environmental awareness, the decreased amount of governmental and municipal funding with extreme political and social opposition. The increasing population densities, public health concerns, and less land available for landfill construction are also the difficulties to overcome [4] . For this reason there are no international code that could be applied due to the variation of the factors involved in the site concerned [5] [6] .
Environmental factors are very important because the landfill may affect the biophysical environment and the ecology of the surrounding area [7] . Several techniques can be found for site selection criteria for solid waste disposal in [1] [5] [6] [8] -[23] . Such siting techniques combine multiple criteria analysis (MCDA) and GIS [4] [7] [24] -[27] . The result of these techniques is the evaluation of the suitability for the entire concerned site based on a suitability index, which is useful in order to make an initial ranking of the most suitable areas.
Candidate sites for an appropriate landfill area in the vicinity of Ankara were determined using the integration of Geographic Information Systems and Multicriteria Decision Analysis. For this purpose, sixteen input map layers were prepared [28] . A research conducted by Din [29] aimed to develop a landfill siting methodology employing GIS, and a multi-criteria decision making (MCDM) rule, consisting of analytical hierarchy processes (AHP) and weighted linear combinations (WLC). The proposed method was applied to the study area of the District of Klang, Selangor, Malaysia.
GIS has matured into a powerful tool that can integrate driven types of spatial data and perform a variety of spatial analysis. This evolution had been driven by significant advances in computer technology and the availability and quantity of data.
GIS and environmental models function with a board spectrum of geospatial data that are used for divers’ applications and spatial analyses at different scales. The examination and organization of data into a useful form produces information, which then enables appropriate analysis and modeling.
The objective of this study is to select sites for an appropriate landfill area of Al-Hashimyahqadaa in Babylon governorate using the integration of Geographic Information Systems (GIS) and Multicriteria Decision Analysis (MCDA). In addition, the required landfill area to cover generated Municipal Solid Waste (MSW) volume for at least five years was calculated. Using these approaches, will lead to integrated environmental management, that are necessary to allow consideration of all components and processes in environment; their spatial, temporal, and human dimensions; their interaction and correlation, coupled with social, economic, political, and legal impacts. Consequently, 14 input digital map layers including urban centers, land use, airports, pipes, power lines, railways, roads, slope, streams, surface water, industrial areas, oil pipes, liquid gas pipes, soil types are prepared and multi-criteria analyses are implemented with a geographical information system.
2. Methodology
2.1. Study Area
Al-Hashimyahqadaa is located to the south of Babylon governorate in Iraq, in the city of Al-Hashimyah center (Figure 1), with a population of about 414,644 according to the files of the Directorate of Environmental Affairs in Babel (DEAB) [30] . It lies approximately between latitudes 32˚6', 32˚31'N, and longitudes 44˚29', 45˚12'E longitude, the total area of the Al-Hashimyahqadaa is 1646 km2, and Population growth rate is 3.3% [30] .
2.2. Methodology
Identification of evaluation Criteria required for landfill siting selection in Al-Hashimyah qadaa were identified and evaluated. All these criteria had been identified based on the local guidelines of Town and Country Planning Department (TCPD), waste disposal siting and the Department of Environment (DOE). In addition, the related information about landfill siting was also reviewed from the international perspective, such as the Environmental Protection Agency (EPA) [31] . All the data pertaining to these parameters were taken from the relevant agencies, however, not all parameters were included due to the lack of data availability. In this study, integration of GIS and (MCDA) was used and applied to Al-Hashimyah qadaa. To achieve this goal, 14 criteria were identi-
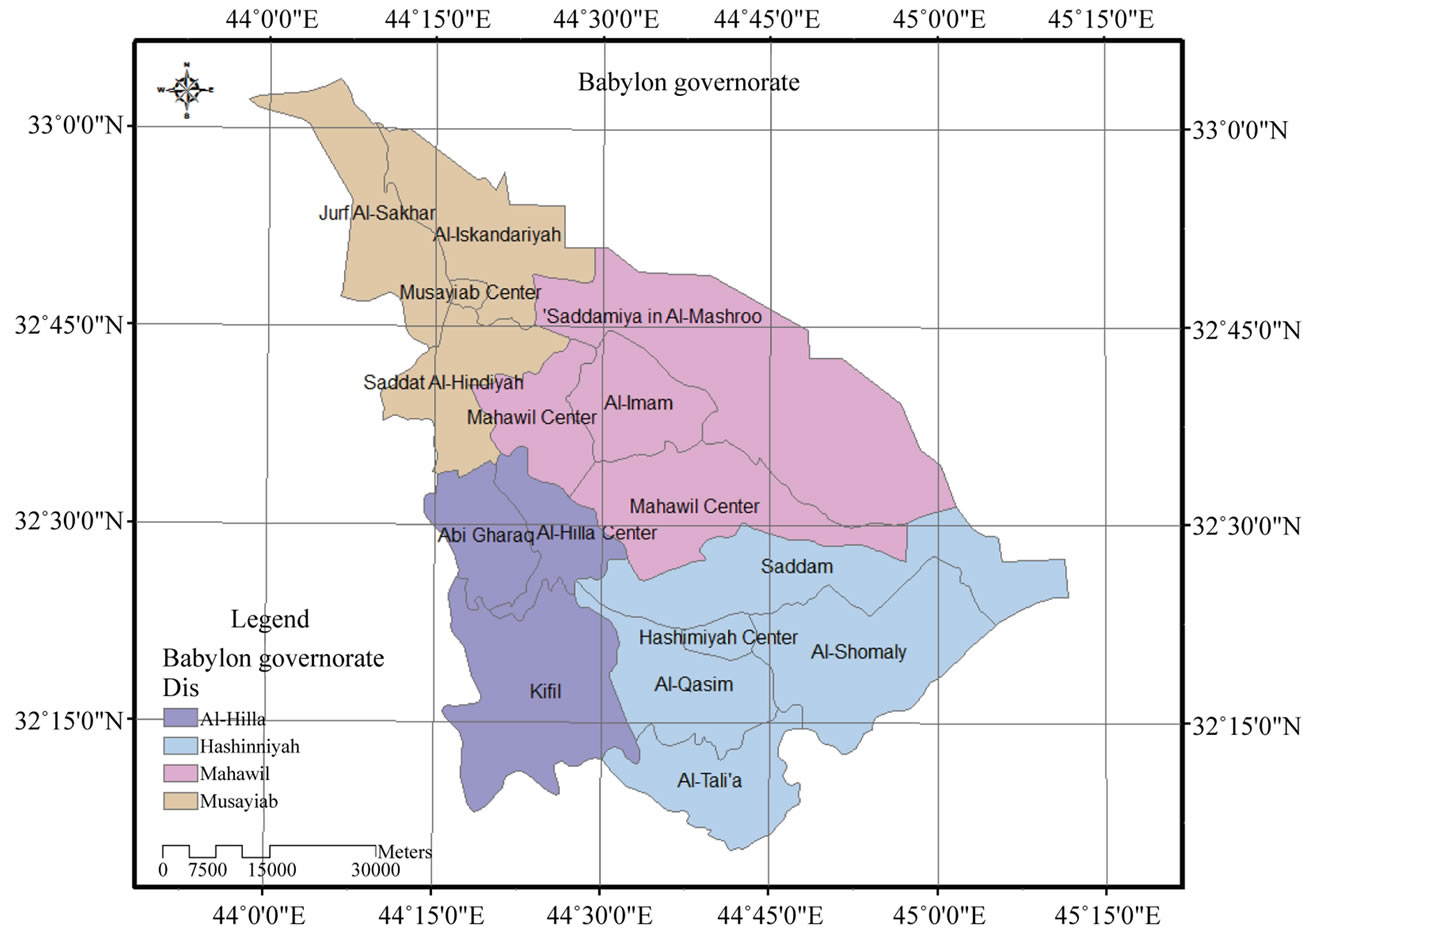
Figure 1. The map of Babylon governorate (source of data from [30] ).
fied for landfill site selection, they were urban centers, land use, airports, pipes, power lines, railways, roads, slope, streams, surface water, industrial areas, oil pipes, liquid gas pipes and soil types. ArcGIS9.3 software was used for imaging and analysis of spatial data. Additionally, several GIS analyses such as buffer zoning, distance, reclassify and overlay analysis were also used. In order to evaluate the site selection criterion, MCDA was used to measure the relative importance weights for the parameters used. This is due to the fact that, MCDA divides the decision problems into smaller understandable parts, and analyzes each part separately, and then integrates these parts in a logical manner [32] .
2.3. Population Growth Rate
Population growth rate (r) was calculated based on estimates of population size of the Babylon governorate, for the period (2004-2010) was obtained from Babylon environmental directorate [30] using the following equation [33] :
 (1)
(1)
where:
n = number of years, P = population.
Using the above population growth rate equation, Al-Hashimyahqadaa in Babylon governorate, population was calculated for individual years from 2011 to 2017. The overall average growth rate for Al-Hashimyah district was 3.3% [30] .
2.4. Municipal Solid Waste Volume (MSW) for Site Area Requirement
One of the important criteria in selecting landfill site is site area requirement. For this Purposes, the volume of Municipal Solid Waste (MSW) to be disposed in this site should be estimated. The link between the populations of Al-Hashimyahqadaa, for the years 2004, 2005, 2006, 2007, 2008, 2009, 2010 and the amount of solid waste generated for the same years in Al-Hashimyah qadaa was achieved using the following relationships (Figure 2):
 (2)
(2)

Figure 2. Solid waste (y-axis) in the center of Babylon governorate (Al-Hashimyah qadaa) with its population (X-axis) (source of data from [30] ).
where:
R2 = 0.77 X: Population in Al-Hashimyah, Y: Solid waste for the same year.
The sum of the solid waste in five years for Al-Hashimyahqadaa is illustrated in Table 1. The expected weight and volume of solid waste for the period 2013-2017 reached 411738 tons and 914973 cubic meters respectively. It should be mentioned however, that the volume was calculated assuming compacting density of Iraqi municipal solid waste as 0.45 t/m3 [34] .
2.5. Criteria Analysis
The decision tree developed for the landfill site selection problem in Al-Hashimyah qadaa is shown in Figure 3, where 14 criteria were prepared as input digital map layers including urban centers, land use, airports, pipes, power lines, railways, roads, slope, streams, surface water, industrial areas, oil pipes, liquid gas pipes, and soil types.
2.5.1. Criteria Weights
Criteria weight can be defined as a value assigned to an evaluation criterion which indicates its importance relative to other criterias under consideration. Assigning weights of importance for the evaluation criteria accounts for 1) the changes in the range of variation for each evaluation criterion, and 2) the different degrees of importance being attached to these ranges of variation [35] . There are four different techniques when assigning the weights: ranking, rating, pairwise comparison and trade of analysis methods. Calculating weight for the criteria using the method of pairwise comparison method has advantages. The advantages is that two criteria had to be considered at a time, it can be implemented in a spreadsheet environment [35] and it is incorporated into GIS based decision making procedures [36] . The weights of criteria had been computed using comparison matrix as shown in Figure 4 by using scale values of 1 - 9 (Table 2) [37] . The comparison matrix indicating the relative importance of the criterion in the columns compared to the criterion in the rows are shown in Table 3 [28] . For each comparison it was decided which of the two criteria was most important, and then assigned score was given to show how much more important it is.
Test of consistency: The aim of this is to determine if the comparisons are consistent or not. It involves following operations:
a) Determine the weighted sum vector by multiplying the weight for the first criterion times the first column of the original pairwise comparison matrix, then multiply the second weight times the second column, the third criterion times the third column of the original matrix, finally sum these values over the rowsb) Determine the consistency vector by dividing the weighted sum vector by the criterion weights determined previouslyc) Compute lambda (λ) which is the average value of the consistency vector and consistency index (CI) which

Table 1. Solid waste in Al-Hashimyah qadaa with its population [30] .
Table 2. Scale for pairwise comparison [37] .
*Ur: Urban centers, Lu: Land use, Ai: Airports, Pi: Pipes, Pl: Power lines, Ra: Railways, Ro: Roads, Sl: slope, St: streams, Sw: Surface water, In: Industrial areas, Oi: Oil pipes, Lg: Liquid gas pipes, St: Soil types [28] .

Figure 3. The decision tree developed for the landfill site selection in Al- Hashimyah qadaa.

Figure 4. Classes for industrial areas (source of data from [43] ).
provides a measure of departure from consistency and has the formula below:

d) Calculation of the consistency ratio (CR) which is defined as follows:

where RI is the random index and depends on the number of elements being compared.
If CR < 0.10, the ratio indicates a reasonable level of consistency in the pairwise comparison, however, if CR ≥ 0.10, the values of the ratio indicates inconsistent judgments.
λmax = 14.327, CI = 0.025, RI = 1.57 and CR = 0.016 < 0.1. See the resulting weights in Table 4 [38] .
2.5.2. Digital Environmental Maps
It is evident that many factors must be incorporated into landfill siting decisions, and geographic information systems (GIS) due to its ability to manage large volumes of spatial data from a variety of sources. It efficiently stores, retrieves, analyzes and displays the information according to user-defined specifications [7] . Preparing analysis of digital environmental maps illustrated below.
1) Settlement Areas
Settlement areas were subdivided into two layers. First layer consists of residential areas; while the second layer was for industrial areas. The reason for this division was the necessity for applying different buffer zone distances to the residential and industrial areas. According to Allen, and et al. [26] [39] the distance from residential areas should be at least 5 km and from isolated houses 500 m to locate a landfill site. The buffer distances for towns and villages within a population greater than 500 people were determined as 1000 m. As far as all other identified centers of population it was assumed to be 500 m and for private residences, businesses, social and community buildings as 250 m [40] . Siddiqui [7] suggested that no new landfill site should be located closer than 0.4 km from a collection of ten or more houses. On the other hand, the landfill site should be located within 10 km of an urban area due to economic considerations [41] . By considering all the suggested safe distances, minimum distances for the study area were determined as 5 km for residential areas and 250 m for industrial areas. These distances were used to create buffer zones around settlement areas and were excluded from the study area. After exclusion of absolutely unsuitable areas for landfill sites, the remainder areas were classified according to their suitability. The layer of industrial areas were classified as suitable or unsuitable by assigning values 1 and 0 respectively (Table 5 and Figure 4).
The layer for residential areas was divided into four classes. The classes and related ranks are given in Table 6. The residential areas layer as then prepared based on the ranking values shown in Table 6 and Figure 5.
Table 5. Classes produced for the industrial areas of settlement criteria according to the suitability for landfill [42] .
Table 6. Classes produced for the residential areas of settlement criteria according to the suitability for landfill [42] .

Figure 5. Classes for residential areas (source of data from [43] ).
2) Roads
There are many suggested buffer zone distances. Minimum distance from the network is imported in order to avoid visual impact and other nuisances. Roads plus 100 m buffer areas from both sides should be applied [44] . According to Cantwell [40] , all roads including primary, secondary, regional and third class roads should be avoided and have a buffer of at least 30 m on both sides. Allen [39] and Allen et al. [45] stated that a distance greater than 1 km from main roads and highways should be avoided. On the other hand, the landfill site should not be placed too far away from existing road networks to avoid the expensive cost of constructing connecting roads [25] . Distance from main access roads should be smaller than 3 km [39] [45] and between 0.2 km and 10 km of a major road [41] . By considering these suggested values, the buffer zones and related ranks were determined for roads which are shown in Table 7.
The values on the tables given above are entered to the database and each value was assigned to the related class. Finally, the vector maps were converted to raster maps as shown in Figure 6.
3) Railways
The necessary buffer zone distances and related rankings were directly used in Table 8 [41] . The buffer zones were created. The values on the table were loaded to the database and each value was assigned to the related class in the GIS environment. The layer of railways was classified as suitable or unsuitable by assigning values 1
Table 7. Classes produced for the main roads of road criteria according to the suitability for landfill [42] .
Table 8. Classes produced for the railways according to the suitability for landfill [42] .
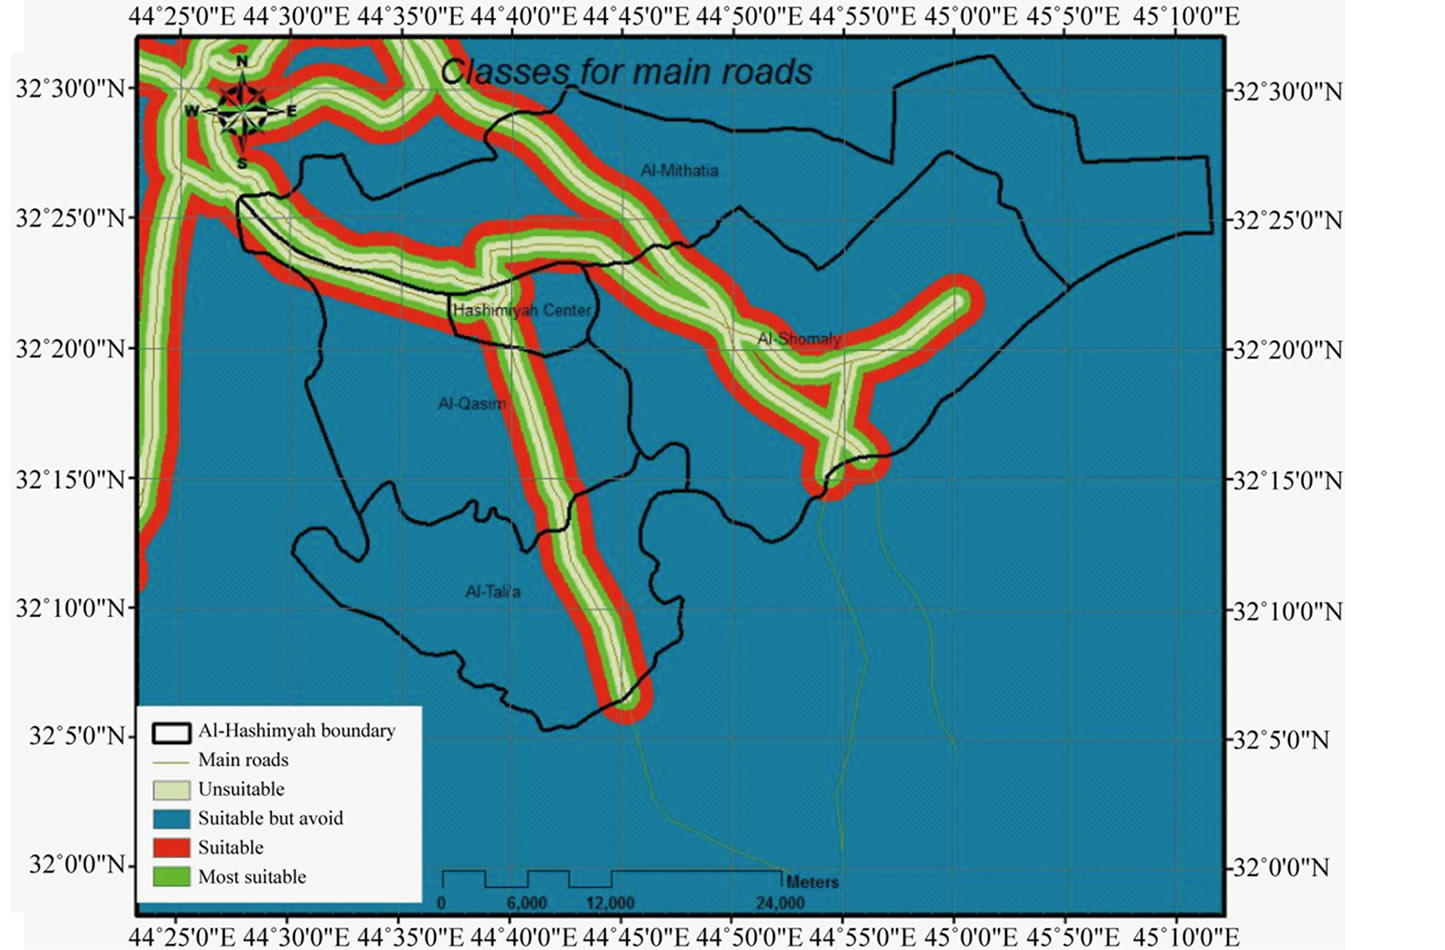
Figure 6. Classes for main roads (source of data from [43] ).
and 0 respectively. Then, the vector map prepared was converted to a raster map shown in Figure 7.
4) Airports
There are different values related to the safe distances from airports like 3.000 m [46] or 3.048 m [47] . As stated by Allen, et al. [45] a distance of 10 to 13 km from flight path should be considered as a buffer zone. By considering these suggested values, the safe distance from airport was determined as 3000 m. This layer was classified as suitable or unsuitable for a landfill site by assigning values 1 and 0 respectively (Table 9 and Figure 8). To finalize the map for the analysis, the vector map was converted to raster map.
5) Surface Water
The necessary buffer zone for swamp areas was determined as 250 m [42] . The layer of wetlands was classified as suitable or unsuitable by assigning values 1 and 0, respectively (Table 10). The buffer zones were created and the study area was divided into two classes in the GIS environment. Then, the vector map prepared

Figure 7. Classes for rail ways (source of data from [43] ).

Figure 8. Classes for airports (source of data from [43] ).
Table 9. Classes produced for airport according to the suitability for landfill [42] .
Table 10. Classes produced for surface water according to the suitability for landfill [42] .
was converted to a raster map shown in Figure 9.
6) Pipelines
Pipelines of Babylon that were considered were those for water and Waste Water Treatment Plants passing through the study area. The necessary buffer zone for them was determined as 250 m on both sides [42] . The pipeline layer was classified as suitable or unsuitable for a landfill site by assigning values 1 and 0, respectively (Table 11). After the creation of buffer zones, the vector map prepared was converted to a raster map shown in Figure 10 to be used as an input map in the analysis.
7) Power Lines
The necessary buffer zone distance should be considered so that it does not disturb the infrastructures and all high voltage power lines. It should have a buffer of 30 m on both sides of the site [40] . The buffer zones were created in the GIS environment. The layer of power lines was classified as suitable or unsuitable for a landfill site by assigning values 1 and 0 respectively (Table 12). Then, the vector map was prepared and converted to a raster map as shown in Figure 11.
According to Alsharify [48] , the texture of Babylon soil analyzed was almost silt clay loam. Table 13 shows adopted test results of texture of Babylon soil [48] .
Comparison of this table with Table 14 [49] , in addition to the map (Figure 12), shows that Babylon city soils and its environs are suitable for landfill construction without specific variation on its texture which should be taken in the digital maps analysis (Figure 13). The raster map was used as an input map in the analysis.
8) Streams
The necessary buffer zone for the stream sewer determined as 300 m on both sides [42] . The surface water layer was classified as suitable or unsuitable for a landfill site by assigning values 1 and 0, respectively (Table 15). After the creation of buffer zones, the vector map was prepared and converted to a raster map as shown in Figure 14.
9) Oil Pipes
The necessary buffer zone for oil pipes was determined as 75 m [source/Pipes Lines Company] on both sides. The surface water layer was classified as suitable or unsuitable for a landfill site by assigning values 1 and 0, respectively (Table 16). After the creation of buffer zones, the vector map was prepared and converted to a raster map shown in Figure 15 [50] .
10) Liquid Gas Pipes
The necessary buffer zone for liquid gas pipes was determined as 300 m [source/Pipes Lines Company] on both sides. The surface water layer was classified as suitable or unsuitable for a landfill site by assigning values 1 and 0, respectively (Table 17). After the creation of buffer zones, the vector map was prepared and converted to a raster map shown in Figure 16.
11) Land Use
In the study area, there are different land uses (see Table 18 and Figure 17). Land use types were grouped and ranked according to their suitability for a landfill site as unsuitable, moderate suitable and suitable for a landfill site by assigning values 0, 5 and 10 respectively. The land use vector map was then converted to a raster map Figure 18).
12) Digital Elevation Model

Figure 10. Classes for pipe lines (source of data from [43] ).

Figure 12. Soil types in Babylon governorate.

Figure 15. Classes for oil pipes (source of data [50] ).

Figure 16. Classes for liquid gas pipes (source of data [50] ).

Figure 17. Land use (source of data [43] ).
Table 11. Classes produced for pipelines according to the suitability for landfill [42] .
Table 12. Classes produced for high voltage power lines according to suitability [42] .
Table 13. Adopted test results of texture of Babylon soil [48] .
Table 14. Soil textures and landfill suitability [49] .
Table 15. Classes produced for streams according to the suitability for landfill [42] .
Table 16. Classes produced for oil pipes according to the suitability for landfill.
Table 17. Classes produced for liquid gas pipes according to the suitability for landfill [50] .
Table 18. Land use types and their rankings.
Digital Elevation Model (DEM), also referred to as the Digital Terrain Analysis, is a digital representation of earth’s topography in a continuous way [47] . A slope map was generated from DEM. The potential for slope failure was related to the degree or grade of the topography. Slope failure underneath or adjacent to landfills, will result in waste containment failure and release of debris into the surrounding area. Land with slopes greater than 15% should be considered unsuitable for waste disposal sites [47] . The slope layer was classified as suitable or unsuitable for a landfill site by assigning values 1 and 0, respectively (Table 19 and Figure 19).
13) Overlay analysis
Output values of the resultant map was prepared using overlay analyses of ArcGIS Spatial Analyst, land suitability of the study area was calculated by LSI. Calculated LSI varied between 0.436 and 4.161. The very high and very low suitable areas were determined. Pixels with 0.436 (colored red) were considered as very low suitable and were excluded from the alternative candidates’ sites to be examined as disposal areas. On the other hand, pixels with values around 4.161 are likely to be more suitable and were colored blue (Figure 20).
2.5.3. Actual Case Requirement
1) District (Nahia) Center
Technically, the distance from the center of a collection route to the landfill should be less than 20 - 25 km [39] . Therefore, adopting of 20 km was used to cover all zigzag roads from centers of each district. The output map produced is given in Figure 21. The suitable land intersected with specific layers of buffer zones around district centers were selected as landfill sites. The output map produced is given in Figure 21. This map shows the landfill sites selected to cover all Al-Hashimyah qadaa municipal solid wastes disposal.
2) Landfill Area
According to Tchobanoglous [3] , the principle methods used for land filling in dry areas can be classified as: 1) Area, 2) Trench, and 3) Depression.
The adopted method in this research was the area method which is more suitable for Babylon environs lands of shallow ground water table depth that is from 3 to 4 m Available area of the selected landfill, and nahias serve reaches an area of 828,255 m2.
Once the amount of waste generated had been estimated, landfills should be designed in cells with sufficient capacity to receive the cumulative volume of waste generated. The optimal capacity of a landfill site should be not less than 5 years in order to ensure that the major investments required by the landfill are spread over large tonnage of waste.
The cumulative volume of wastes expected to be generated between 2013 and 2017 of selected landfill. The adopted density of the waste in the landfill was 450 kg/m3. It was not accounted for any reduction in the waste
Table 19. Classes produced for slope according to the suitability for landfill [47] .
going to the landfill through recycling or composting at this stage. Waste in the landfill should be covered daily by a daily cover in order to minimize health, safety and environmental impacts and nuisances. The volume of daily cover in the landfill varies between 10% and 15% of the waste volume [42] . Adopting a value of 10% of the waste volume, the required capacity of the landfill over the next five years can be estimated as 1,006,470 m3.
Wastes are to be unloaded to landfill site and spread in long narrow strips on the surface of land in series of layers in depth of 50 cm. Each layer is to be compacted at the filling progresses during the course of the day until the thickness of the compacted wastes reaches a high of 3 m. The cover material is to be hauled in by earth moving equipment from adjacent land or from borrow pit areas. The width over which the wastes are to be compacted is 6 m [42] . Required areas of the selected landfill are 335490 m2 (32˚19'30"N and 44˚49'0"E) in Al-Hashemiaqadaa in Al-Shomalynahia.
It was noticed that the available area (828,255 m2) of selected landfill is quite more than the required areas estimated for 5 years. Figure 22 shows the suggested landfill sites.
3) Field Visits Review
In order to check the suitability of the area derived from the analysis and the actual case requirement (nahia center and landfill area), field check was performed out to determine the accuracy and suitability of candidate sites. The selected sites were checked on the satellite image 2006. Planning and Agriculture directorates in Babylon governorate checked the suggested sites in case that there are projects within the suggested sites. Due to the fact that there is no accurate documented information available for religious and archeological sites, physical field visits were performed. All the neither sites were surveyed in cooperation with the Al-Shomaly agriculture division. It was found that the suggested landfill sites are suitable and does not affect the agricultural activities

Figure 20. Output map produced with its suitability index.
nor religious or archeological sites.
3. Conclusions
The results of using GIS and Multicriteria Decision Analysis for Landfill Site Selection for Al-Hashimyah Qadaa using 14 variables showed that total landfilling areas that are required to cover cumulative MSW volume generated in 5 years are 3,034,035 m2 while the suitable selected areas determined by this study were 3,156,778 m2. Therefore, the selected landfill sites will be available for more than 5 years as an estimated operation time.
The analysis indicated that about 878 km2 at Al-Hashimyahqadaa, had suitability index between 0.436 and 4.161. The very high and very low suitable areas were determined. Pixels with 0.436 (colored red) are considered as very low suitable and were excluded as possible candidate sites. On the other hand, pixels with values around 4.161 were considered to be more suitable and are colored blue.
The presented approach is easy to understand and it can illustrate which areas are better or less suitable for landfill site selection. The criteria used in this study are not fixed factors since it can vary from area to area and these criteria can be changed accordingly in the analysis process. Apart from that, the presented methodology can explain clearly and directly the analysis and results in an easily understandable format. As a result, when the approach and results of the suitability map could be clearly understood, it can assist in getting full support especially from the public.
NOTES
*Corresponding author.