Matching Accuracy Analysis of Fingerprint Templates Generated by Data Processing Method Using the Fractional Fourier Transform ()
The matching accuracy of the fingerprint templates which were generated by our previously proposed data processing method using the fractional Fourier transform (FRT) was analyzed. The minimum error rate (MER) derived from the false acceptance rate (FAR) and the false rejection rate (FRR) is the criterion of the matching accuracy in this study, and was obtained statistically by the peak value of the normalized cross-correlation function between the fingerprint template and the intensity FRT of the subject’s fingerprint. In our analysis, the fingerprint template was obtained as the intensity FRT of one-dimensional (1D) finite rectangular wave by which a line of a real fingerprint image is modeled. Moreover, various modified 1D finite rectangular waves were generated to derive the FAR. Furthermore, the 1D finite rectangular wave with random noise regarded as dirt of a fingerprint and the one with random vanishing ridges regarded as damage of a fingerprint were generated to derive the FRR. As a result, it was clarified that fingerprint templates generated by our data processing method using the FRT could provide high matching accuracy in the fingerprint authentication from the viewpoint of the MER.
1. Introduction
In the previous study, we developed a new data processing method for generating the fingerprint template using the FRT [1-5] in order to take into account the protection of personal information [6]. In this study, we analyze the matching accuracy of the fingerprint templates generated by our previously proposed data processing method, because the biological identifier does not always have the same condition so that there is a possibility of false authentication. As the causes of the modification of the biological identifiers, especially for the fingerprint, sweat, sebum and dust, etc., can be considered. In general, the FAR and the FRR [7] are used as the criteria of the matching accuracy in the fingerprint authentication.
In the present study, in order to obtain the FAR and the FRR, the peak value of the normalized cross-correlation function between the fingerprint template and the intensity FRT of the subject’s fingerprint image are derived for various FRT’s orders. The FRT’s order is changed from 1.0 to 0.5 by 0.1. In particular, the FRT with the order of 1.0 is regarded as the conventional Fourier transform (FT). The small values of FRT’s orders less than 0.5 are not considered, because we previously obtained the result that the most appropriate FRT’s order is 0.9 [6]. In Section 2, the modeled authentic fingerprint image and its templates are indicated. In Section 3, the basic idea of the FAR, FRR and MER are explained and related to the analyses conducted in this study. In Section 4, by introducing the impostor fingerprint image, the behavior of the peak value of the normalized crosscorrelation function between the fingerprint template and the intensity FRT of the impostor fingerprint image is analyzed. In Section 5, by introducing the modification of the authentic fingerprint image caused by dirt, small scar, etc., the behavior of the peak value of the normalized cross-correlation function between the fingerprint template and the intensity FRT of the authentic modified fingerprint image is also analyzed. In Section 6, by use of the results obtained in Sections 4 and 5, the MER and the threshold in the fingerprint authentication are obtained for the FRT’s orders from 1.0 to 0.5 by 0.1. Finally, in Section 7, conclusions in our study are described.
2. Fingerprint Template Corresponding to the FRT Intensity
2.1. Definition of the Fractional Fourier Transform (FRT)
The FRT is the generalization of a conventional FT. The FRT of 1D input data u(x) is defined [8,9] as
 (1)
(1)
where a constant factor has been dropped; , where p is the FRT’s order; s is a constant. In particular, in the optical FRT, s is called a scale factor expressed in terms of
  where
where  is the wavelength and
  is an arbitrarily fixed focal length. In this paper, the value of s was fixed at 1.0. In particular, p takes a value of 4n + 1, n being any integer, the FRT corresponds to the conventional FT. The intensity distribution of the FRT (i.e., the intensity FRT),
  , is obtained by calculating
 .
.
2.2. Relationship between a Modeled Authentic Fingerprint Image and the Template
We previously proposed a new data processing method to generate the fingerprint template by use of the FRT [6]. A finite rectangular wave shown in Figure 1 was assumed to be the simplification of the authentic fingerprint image. In this paper, we enroll the fingerprint templates expressed in term of the intensity FRTs shown in Figure 2. The fingerprint templates were obtained from the application of Equation (1) to an authentic finite rectangular wave shown in Figure 1 by changing the FRT’s order. The intensity FRT of an authentic person’s fingerprint image is called fingerprint template in this study. Matching between the template and the intensity FRT of newly scanned subject’s fingerprint image is conducted in our analysis. The peak values of the intensity distributions in Figures 2(a) and 2(b) are 1.63 × 10⁷ and 4.34 × 10⁵, respectively. It is found from the comparison between Figures 2(a) and 2(b) that the peak value of the intensity distribution falls remarkably and the width of spread increases when the value of the FRT’s order p is 0.9. The cases of the other FRT’s orders have also the

Figure 1. An authentic finite rectangular wave regarded as a modeled authentic fingerprint image.
 (a)
(a) (b)
(b)
Figure 2. Examples of the templates of an authentic finite rectangular wave shown in Figure 1, when ps = (a) 1.0 and (b) 0.9.
same tendency.
3. Matching Accuracy Analysis Based on the FAR, FRR and MER
Figure 3 illustrates the basic concept of the FAR and the FRR. In the figure, the left-hand curve is the imposter distribution and the right-hand curve is the authentic distribution. The FAR is the probability of accepting impostors erroneously. As shown in the figure, it corresponds to an area of the impostor distribution higher than

Figure 3. A basic concept of the FAR and the FRR.
the authentication threshold. On the other hand, the FRR is the probability of rejecting authentic person and corresponds to the area of the authentic distribution lower than the authentication threshold. The authentication threshold is decided by a value satisfied with the condition the FAR and FRR take the same value. It’s called MER. In our analysis, the horizontal axis in Figure 3 corresponds to the peak value of the 1D normalized cross-correlation function of the intensity FRTs for the two sets of fingerprint images.
In this paper, we prepare and analyze the authentic and impostor fingerprint images. First, a finite rectangular wave shown in Figure 1 is regarded as modeling a line of authentic fingerprint image. Second, 100 kinds of the impostor finite rectangular waves are prepared to obtain the imposter distribution in Figure 3. Third, 100 kinds of the authentic finite rectangular waves which are superimposed by random noise (average μ = 0, standard deviation  = 12.75, 19.13, 25.50, 31.88, 38.25) are prepared to obtain the authentic distribution in Figure 3. In addition, 100 kinds of the authentic finite rectangular waves with vanishing ridges (from 1 to 5 vanishing ridges at random positions) are prepared to obtain the authentic distribution. Finally, we derive the peak value of the cross-correlation function between the template of the authentic fingerprint image as shown in Figure 2 and the intensity FRT of the impostor fingerprint image, or the one with dirt or small scar. Finally, we analyze the FAR and the FRR from the behavior of the peak value, and obtain the MER.
4. Peak Value of the Normalized Cross-Correlation Function between the Fingerprint Template and the Intensity FRT of the Impostor Fingerprint
In order to derive the FAR, we prepared the intensity FARs of the impostor fingerprint images. The impostor fingerprint images were made by changing the ridge’s position randomly from the authentic finite rectangular wave shown in Figure 1. The authentic finite rectangular wave consisted of 1024 (210) points. The number of ridges was 39 and the ridges were placed equally. One ridge consisted of 13 points and one groove also consisted of 13 points. On the other hand, in the impostor finite rectangular wave, one ridges also consisted of 13 points, but the positions of ridges were changed randomly between –10 and 10 points from the ones in the authentic finite rectangular wave. Figure 4 illustrates an example of the impostor finite rectangular wave regarded as the modeled impostor fingerprint image.
Figure 5 shows the intensity FRTs of Figure 4 when the FRT’s orders ps = 1.0 and 0.9. The peak values of the intensity distributions in Figures 5(a) and 5(b) are 1.58 × 10⁷ and 5.56 × 10⁵, respectively. It is found from Figure 5 that they have the same tendency as those of the authentic finite rectangular wave shown in Figure 2.
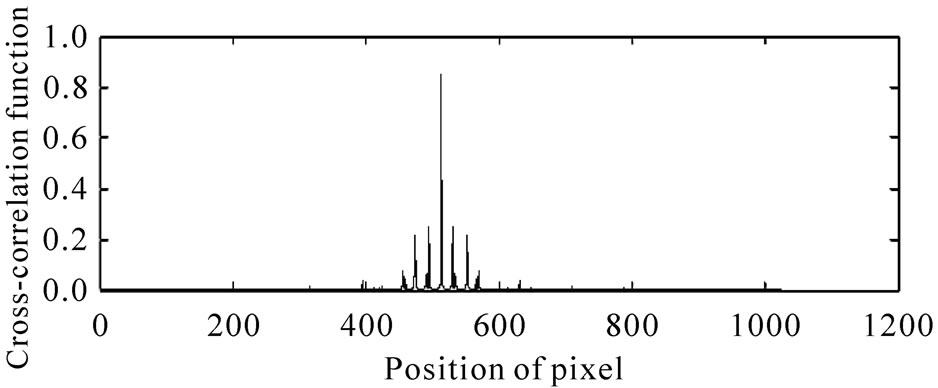
We quantitatively analyzed the behavior of the peak value of the normalized cross-correlation function between the authentic intensity FRT (i.e., the fingerprint template) and the impostor intensity FRT. Figure 6 illustrates an example of the normalized cross-correlation function between the fingerprint template shown in Figure 2 and the intensity FRT shown in Figure 5. The peak values of the intensity distributions in Figures 6(a) and 6(b) are 0.845 and 0.720, respectively. It is found from the comparison between Figures 6(a) and 6(b) that the significant peak value is not seen and the width of spread increases when the value of the FRT’s order p is 0.9.
Figure 7 is the result showing the peak value of the normalized cross-correlation function between the fingerprint template and the impostor intensity FRT, when the FRT’s order p is changed from 1.0 to 0.5 by 0.1. 100

Figure 4. An example of the impostor finite rectangular wave regarded as modeled impostor fingerprint image.
 (a)
(a)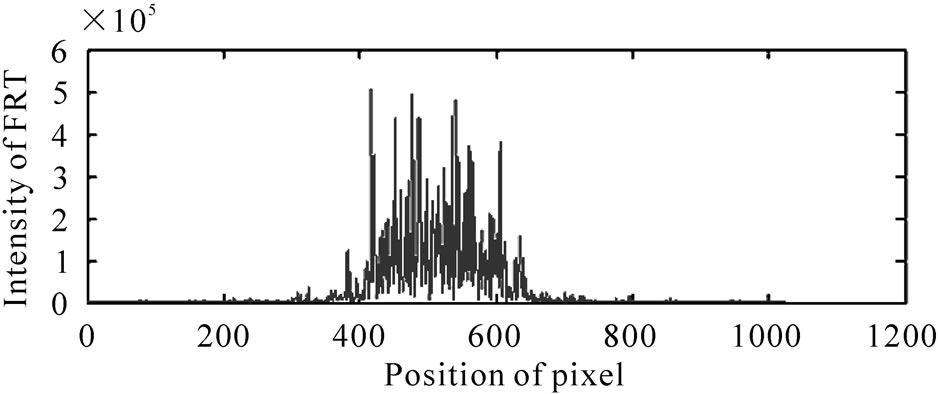 (b)
(b)
Figure 5. Intensity FRT of the impostor finite rectangular wave shown in Figure 4, when ps = (a) 1.0 and (b) 0.9.
 (a)
(a) (b)
(b)
Figure 6. Normalized cross-correlation function between the fingerprint template shown in Figure 2 and the intensity FRT shown in Figure 5, when ps = (a) 1.0 and (b) 0.9.
kinds of impostor fingerprint images were used for each value of p. In Figure 7, the vertical and horizontal axes denote the peak value of the normalized cross-correlation function and the FRT’s order, respectively. The symbols of circle in the figure denote the averaged values of the peak values. The error bars denote the standard deviations of the peak values and correspond to the width of spread of the impostor distribution shown in Figure 3.
We can understand from Figure 7 that the peak values

Figure 7. Behavior of the peak value of the normalized cross-correlation function between the fingerprint template and the intensity FRT of the impostor fingerprint image by changing the FRT’s order.
of the normalized cross-correlation function are low when the non-integer FRT’s orders are used. This fact means that the probability accepting impostors erroneously, i.e., the FAR, would be low. As the reason why the FAR would be low in case of the non-integer FRT’s orders, we can consider that the intensity FRTs with non-integer orders strongly includes the information on the imposter fingerprint image itself in comparison with the intensity FT (i.e., the FRT intensity with the order of 1.0).
5. Peak Value of the Normalized Cross-Correlation Function between the Fingerprint Template and the Intensity FRT of the Modified Authentic Fingerprint
In order to derive the FRR, we considered the following two cases: 1) the case of adding random noise to the authentic finite rectangular wave such as dirt and sebum and 2) the case of vanishing ridges on the authentic finite rectangular wave such as small scar.
5.1. Case of Adding Random Noises
We considered the random noise characterized by the mean value  = 0 and the normalized standard deviation
  = 0.05, 0.075, 0.1, 0.125 or 0.15. The normalized standard deviation
  indicates the standard deviation
  normalized by 255 corresponding to the maximum value of an authentic finite rectangular wave shown in Figure 1. In particular, the degree of the random noise corresponds to a 1/3 value of height of the ridges at the most, when
  = 0.15. Therefore, we did not consider the random noise more than
  = 0.15. As an example, Figure 8 denotes the authentic finite rectangular wave with random noise of
  and
and  = 0.05. Then, the intensity FRT of Figure 8 was obtained as shown in Figure 9, when the FRT’s orders ps = 1.0 and 0.9. The peak values of the intensity distributions in Figures 9(a) and 9(b) are 1.63 × 10⁷ and 4.53 × 10⁵, respectively. It is understood from the comparison between Figures 2 and 9 that there is little difference between the fingerprint template and the intensity FRT of the authen-

Figure 8. An example of the authentic finite rectangular wave with random noise, when  = 0 and
  = 0.05.
 (a)
(a) (b)
(b)
Figure 9. Intensity FRT of the authentic finite rectangular wave with noise shown in Figure 8, when ps = (a) 1.0 and (b) 0.9.
tic finite rectangular wave with random noise.
Figure 10 shows an example of the normalized crosscorrelation function between the fingerprint template shown in Figure 2 and the intensity FRT shown in Figure 9. The peak values of the intensity distributions in Figures 10(a) and 10(b) are 0.999 and 0.993, respecttively. It is found from the comparison between Figures 10(a) and 10(b) that the distribution has a projecting peak value and the width of spread increases when the value of the FRT’s order p is 0.9.
Figure 11 shows the behavior of the peak value of the normalized cross-correlation function between the fin-
 (a)
(a) (b)
(b)
Figure 10. Normalized cross-correlation function between the fingerprint template shown in Figure 2 and the intensity FRT shown in Figure 9, when ps = (a) 1.0 and (b) 0.9.

Figure 11. Behavior of the peak value of the normalized cross-correlation function between the fingerprint template and the intensity FRT of the authentic finite rectangular wave with random noise.
gerprint template and the intensity FRT of the authentic finite rectangular wave with random noise by changing the FRT’s order from 1.0 to 0.5 by 0.1and the normalized standard deviation of random noise  from 0.05 to 0.15 by 0.025. The vertical and horizontal axes denote the peak value of the normalized cross-correlation function and the normalized standard deviation, respectively. The error bars denote the standard deviations of the peak values for 20 kinds of authentic finite rectangular waves with random noise having the same value of
 . Each curve corresponds to the result for each value of the FRT’s order. The symbols of circle in the figure denote the averaged peak values.
We can understand from Figure 11 that the matching accuracy judged as authentic person becomes worse with an increase in  except the case of the FT (p = 1.0) and with a decrease in the FRT’s order p. As the reason, we can consider that the intensity FRTs are strongly affected by the degree of random noise and include the information on the random noise itself with a decrease in the FRT’s order. However, the probability of rejecting authentic person erroneously is extremely low, because the peak values are nearly 1.0 for every FRT’s order and normalized standard deviation of random noise. This fact means that the FRR would become very low.
5.2. Case of Vanishing Ridges
Next we analyzed the peak value of the normalized cross-correlation function between the fingerprint template and the intensity FRT of the authentic finite rectangular wave with vanishing ridges by changing the FRT’s order from 1.0 to 0.5 by 0.1. We prepared 100 kinds of the authentic fingerprint images with 1 to 5 vanishing ridges at random positions. The more the number of vanishing ridges increases, the more the number of hurts increases. When the number of vanishing ridges is 5, 1/8 of the whole number of ridges is lost in the authentic fingerprint image. Therefore, we did not consider the number of ridges more than 6 to avoid further serious hurt. As an example, Figure 12 shows an example of the authentic finite rectangular wave with five vanishing ridges at random positions. Then, the intensity FRT of Figure 12 was obtained as shown in Figure 13 when the FRT’s orders ps = 1.0 and 0.9. The peak values of the intensity distributions in Figures 13(a) and 13(b) are 1.24 × 10⁷ and 4.94 × 10⁵, respectively. It is understood from the comparison between Figures 2 and 13 that there is little difference between the fingerprint templates and the intensity FRT of the authentic finite rectangular wave with vanishing ridges at random positions.
Figure 14 shows an example of the normalized cross-correlation function between the fingerprint tem-