Distribution of Deviation Distance to Alternative Fuel Stations ()
1. Introduction
Alternative fuel vehicles powered by electricity, hydrogen, and biofuels have been promoted because of environmental, geopolitical, and financial concerns. The transition from gasoline engine vehicles to alternative fuel vehicles, however, would be difficult. Major barriers to the transition are the scarcity of refueling stations and the limited range of vehicles.
A sufficient number of alternative fuel stations has been calculated. Melaina [1] developed three estimation approaches based on the number of existing gasoline stations, metropolitan land areas, and lengths of major roads. Melaina and Bremson [2] proposed a sufficient level of station coverage that meets the refueling needs of the general population in urban areas. Nicholas et al. [3] developed a GIS model for siting hydrogen stations and examined the effect of the number of stations on the average driving time to the nearest station. Nicholas and Ogden [4] studied the regional variation in the number of stations needed to achieve a travel time target. Honma and Kurita [5] obtained the optimal number of hydrogen stations that minimizes the sum of operation and transportation costs.
An efficient location of alternative fuel stations has also been studied. Kuby and Lim [6] developed the flow refueling location model (FRLM) for optimally locating refueling facilities. The FRLM locates p facilities to maximize the total flow volume that can be refueled. Kuby et al. [7] applied the FRLM to the location of hydrogen stations in Florida. Lim and Kuby [8] presented three heuristic algorithms for the FRLM. Capar and Kuby [9] proposed an efficient formulation of the FRLM that makes it possible to solve large problems. The FRLM was extended by Kuby and Lim [10] to add candidate sites along network arcs, by Upchurch et al. [11] to include the capacity of refueling facilities, and by Kim and Kuby [12] to allow drivers to deviate from their shortest paths.
Refueling stations are typical flow demand facilities in that demand for service can be expressed as flow rather than point. In fact, drivers usually refuel their vehicles on pre-planned paths from origin to destination. Other examples of flow demand facilities include convenience stores, automated teller machines, and nursery schools. Flow demand was first introduced into facility location models by Hodgson [13] who considered the location of facilities that minimizes the total deviation time from work journeys. Hodgson [14] and Berman et al. [15] formulated a location model, which Hodgson called the flow capturing model, for locating facilities on a network so as to maximize the total flow covered. Hodgson et al.
[16] applied the model to the actual road network in Edmonton, Canada. The model was generalized by Berman et al. [17] to consider the possibility of deviations, by Averbakh and Berman [18] to take account of multicounting, by Zeng et al. [19] to include consumers’ preferences, and by Tanaka and Furuta [20] to deal with facilities of different sizes and attractions. Berman [21] introduced four location problems that combine demand coverage problems with flow coverage problems. Zeng et al. [22] proposed a generalized flow-interception location-allocation model for effectively locating facilities on a network with flow-based demand.
In this paper, we derive the distribution of the deviation distance to visit an alternative fuel station. The distribution that shows how the deviation distance is distributed will supply building blocks for location models of refueling stations. For example, the distribution can be used to estimate the number of vehicles refueled at a station, because refueling demand generally decreases with the deviation distance. Given the location of stations and the set of origin-destination pairs, the distribution of the deviation distance can be numerically calculated. The result, however, depends on the specific data and cannot be applied to other situations. For examining fundamental characteristics of the deviation distance, analytical expressions are necessary. Analytical expressions are also useful to interpret and comprehend numerical results.
Although Miyagawa [23] also derived the distribution of the deviation distance, the present paper differs in considering the vehicle range, which is a significant element for alternative fuel vehicles. Even if a station is available within a deviation distance that drivers can tolerate, the vehicle cannot always complete the trip. In fact, if the distance from origin to the station or from the station to destination is greater than the vehicle range, the vehicle cannot complete the trip. We therefore focus on whether the vehicle can make the round trip between origin and destination.
The remainder of this paper is organized as follows. The next section defines the deviation distance and the distribution of the deviation distance. The following sections derive the distribution of the deviation distance for three cases: fuel is available at both origin and destination, fuel is available at either origin or destination, and fuel is available at neither origin nor destination. The final section presents concluding remarks.
2. Deviation Distance
Consider trips using alternative fuel vehicles of range r. Distance is measured as the Euclidean distance on a continuous plane. Origins and destinations are assumed to be uniformly and independently distributed over the study region. This assumption facilitates the analytical treatment of the distribution of the deviation distance. In fact, the uniformity assumption has frequently been used in continuous transportation models [24-26]. In addition, the uniform demand serves as a basis for further analyses with non-uniform demand. For example, more generalized travel demand can be incorporated by using spatial interaction models [27].
Drivers are assumed to deviate from their shortest paths to refuel their vehicles. Let t and U be the shortest distance between origin and destination and the deviation distance to visit a station, respectively. The deviation distance is defined as the sum of the distances from origin O to the station and from the station to destination D. Let  be the volume of flow such that
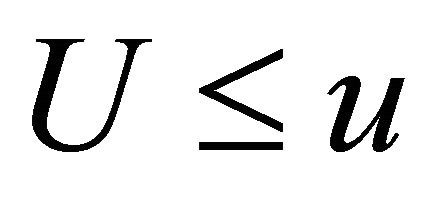 . We call
 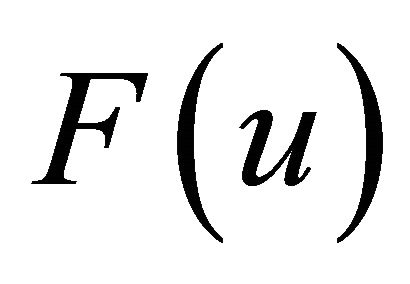 the distribution of the deviation distance. The region that a driver can cover within the deviation distance
  forms an ellipse, the foci of which are at O and D, as shown in Figure 1. Recall that an ellipse is defined as the locus of points such that the sum of the distances to two fixed points (foci) remains constant. If the ellipse contains a station, the station is available within the deviation distance
 . This also means that the midpoint of the O-D path lies in the same ellipse but centered at the station. Thus,
  can be obtained by calculating the volume of flow such that the midpoint of the O-D path lies in the ellipse centered at the station. Not only the deviation distance but also the possibility of making the round trip should be taken into account. This possibility depends on the vehicle range and the refueling availability at origin and destination. In the following sections, we derive the distribution of the deviation distance
 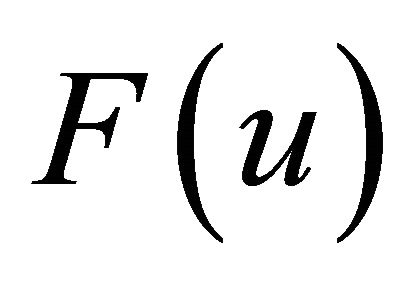 for three different cases of the refueling availability at origin and destination.
3. Fuel Is Available at Both Origin and Destination
First, we assume that fuel is available at both origin O and destination D. Then the vehicle can start at O with full tank of fuel. Note that plug-in electric vehicles can be charged at home or work place. Note also that this assumption also applies to long distance trips where O and D represent other stations.
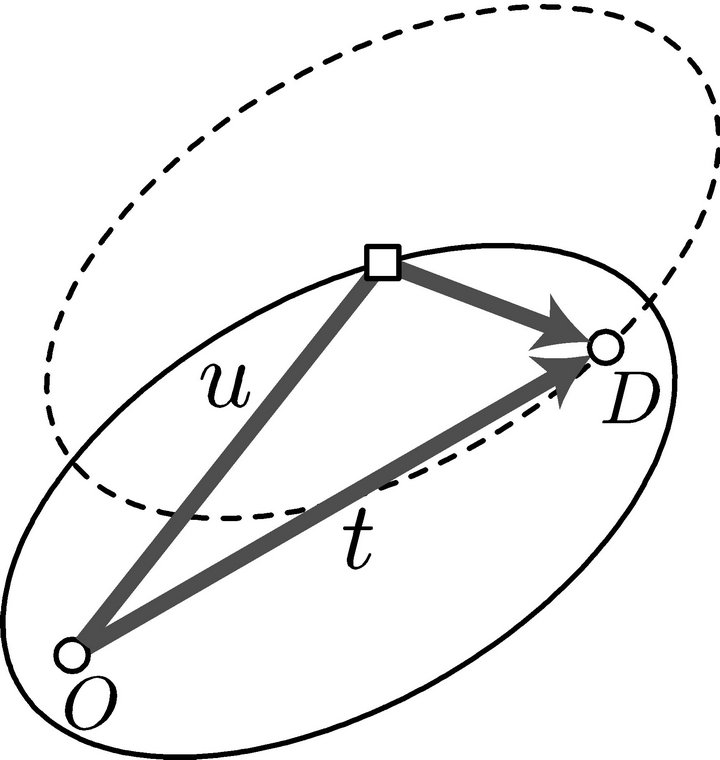
Figure 1. Deviation distance to a station.
To refuel at a station and complete the round trip, both O and D must be within the distance r of the station. In fact, the vehicle can reach the station, fill up, go to D, fill up again, turn round, fill up again at that same station, and return to O. Thus, both O and D must be in the circle C centered at the station with radius r, as depicted in Figure 2. This means that the midpoint of the O-D path must be in the shaded region in Figure 2. This region is the intersection of the two circles which are obtained by moving the circle C by t/2 in the direction parallel to the O-D path and in the opposite direction.
For , the midpoint of the O-D path must be in the ellipse centered at the station, as discussed in the previous section. Set the origin of the coordinate system at the station, as shown in Figure 3. The locus such that
 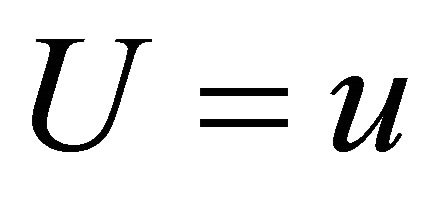 is the ellipse expressed as
 (1)
(1)
where .
.  is obtained by calculating the area of the ellipse in the intersection of the two circles as
 (2)
(2)
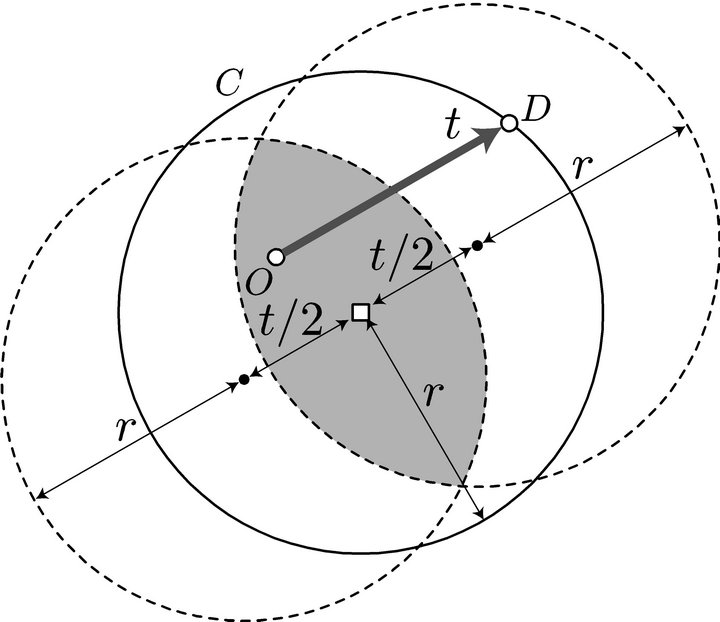
Figure 2. Flow that can be refueled at a station.
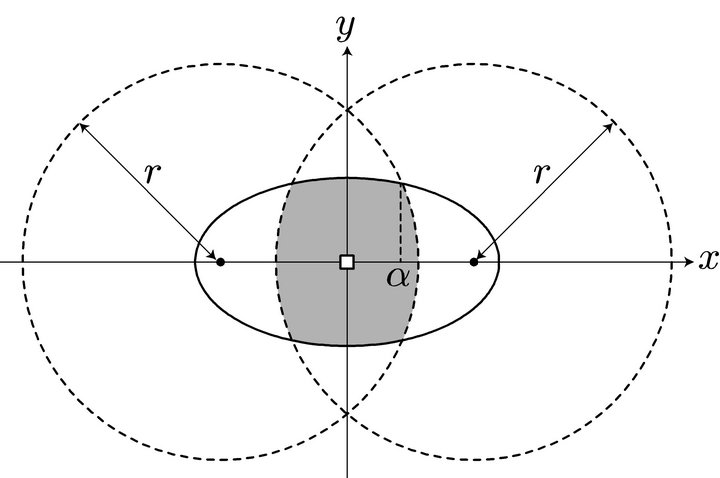
Figure 3. Contour of the deviation distance.
where
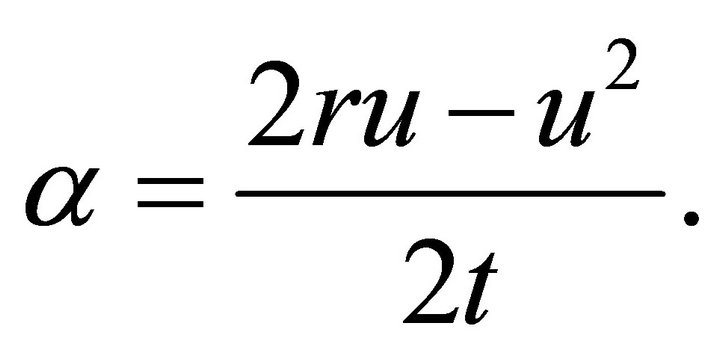 (3)
(3)
The distribution of the deviation distance  is shown in Figure 4. The longer the vehicle range r and the shorter the shortest distance t, the more the volume of flow that can be refueled within the deviation distance u. Note that if
 , no vehicle uses the station, because the vehicle can reach D without refueling. Since
 ,
,  represents the total volume of flow that can be refueled at the station.
4. Fuel Is Available at Either Origin or Destination
Next, we assume that fuel is available at either origin O or destination D. Without loss of generality, we assume that fuel is available at only O. If the round trip is considered, the vehicle is required to reach D with at least half a tank remaining.
To refuel at a station and complete the round trip, O must be within the distance r of the station and D must be within the distance r/2 of the station. In fact, the vehicle can reach the station, fill up, go to D, turn round, fill up again at that same station, and return to O. Thus, O must be in the circle 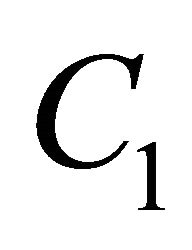 centered at the station with radius r and D must be in the circle
 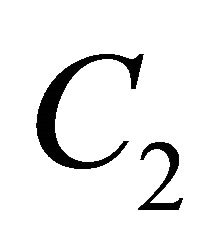 centered at the station with radius r/2, as depicted in Figure 5. This means that the midpoint of the O-D path must be in the shaded region in Figure 5. This region is the intersection of the two circles which are obtained by moving the circle
  by t/2 in the direction parallel to the O-D path and moving the circle
 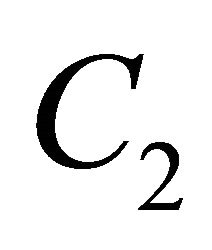 by t/2 in the opposite direction.
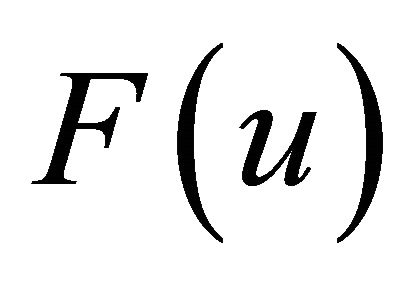 is obtained by calculating the area of the ellipse (1) in the intersection of the two circles, as shown in Figure 6. If
 ,
,
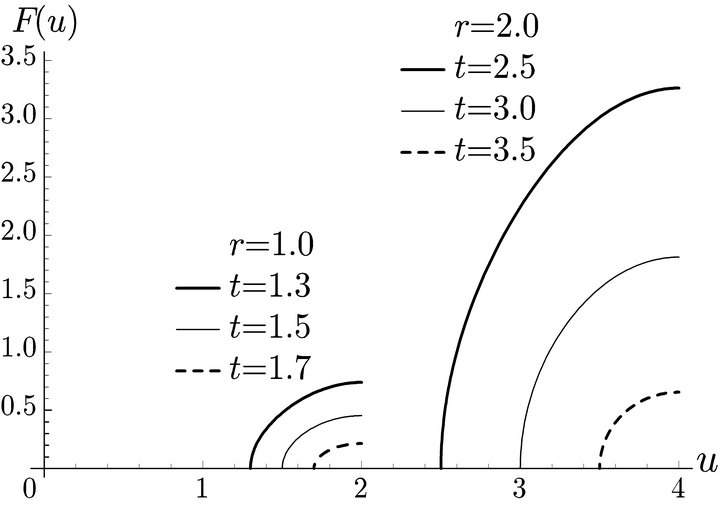
Figure 4. Distribution of the deviation distance.
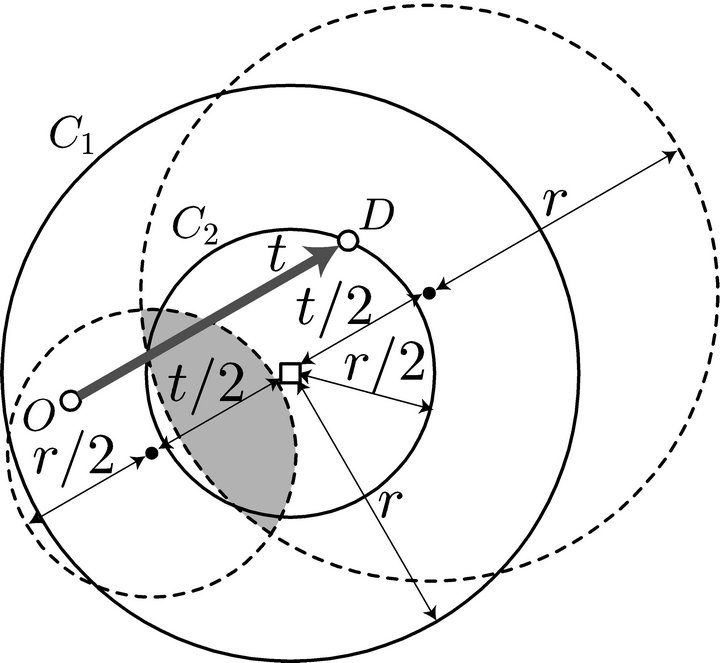
Figure 5. Flow that can be refueled at a station.
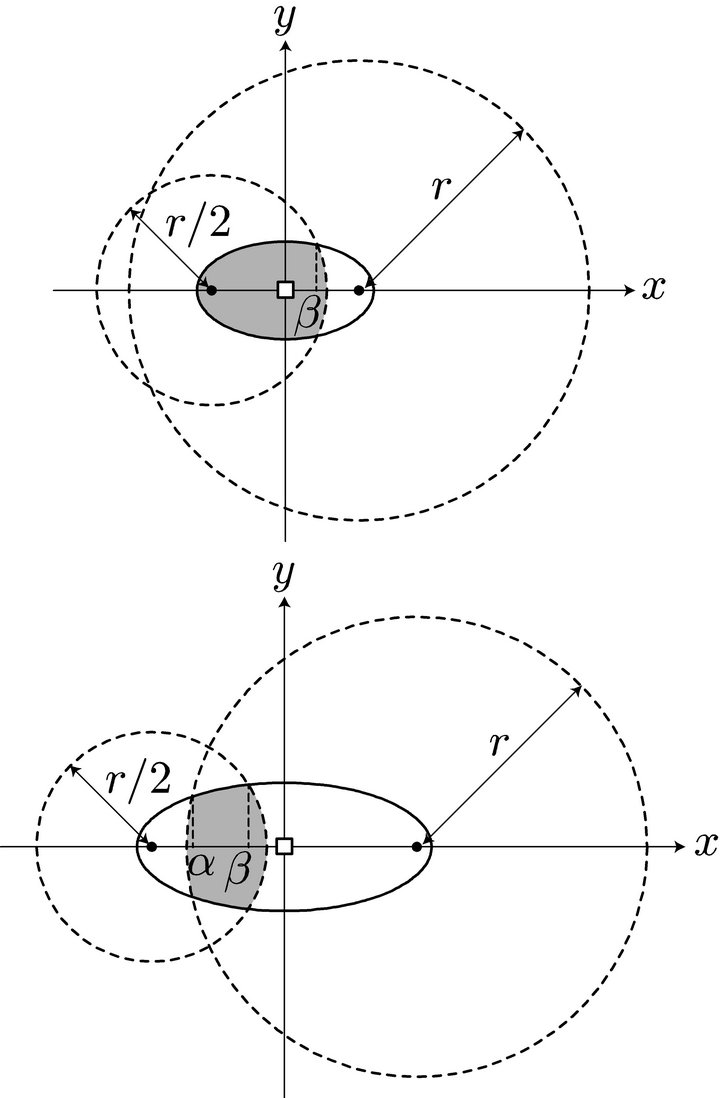
Figure 6. Contour of the deviation distance.
 (4)
(4)
and if ,
,
 (5)
(5)
where
 (6)
(6)
The distribution of the deviation distance  is shown in Figure 7. The volume of flow that can be refueled is smaller than that of the case where fuel is available at both origin and destination.
5. Fuel Is Available at Neither Origin Nor Destination
Finally, we assume that fuel is available at neither origin O nor destination D. We also assume that the vehicle starts at O with half a tank of fuel and reaches D with at least half a tank remaining, as suggested by Kuby and Lim [6]. This assumption ensures that the round trip can be made repeatedly.
To refuel at a station and complete the round trip, both  and D must be within the distance r/2 of the station. In fact, the vehicle can reach the station, fill up, go to D, turn round, fill up again at that same station, and return to O. Thus, both O and D must be in the circle C centered at the station with radius r/2, as depicted in Figure 8. This means that the midpoint of the O-D path must be in the shaded region in Figure 8. This region is the intersection of the two circles which are obtained by moving the circle
 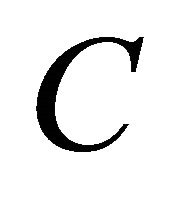 by t/2 in the direction parallel to the O-D path and in the opposite direction.
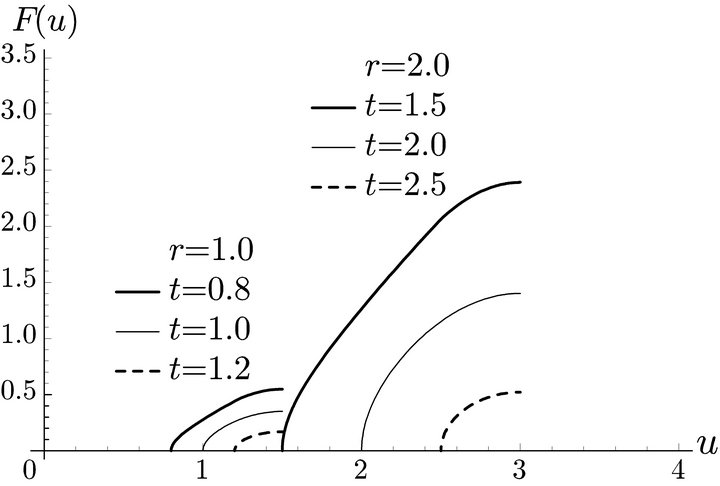
Figure 7. Distribution of the deviation distance.

Figure 8. Flow that can be refueled at a station.
 is obtained by calculating the area of the ellipse (1) in the intersection of the two circles, as shown in Figure 9. If
 ,
,
 (7)
(7)

 (8)
(8)
where
 (9)
(9)
The distribution of the deviation distance  is shown in Figure 10. In this case, only short distance trips can visit the station. The total volume of flow that can be refueled is smaller than the other two cases.
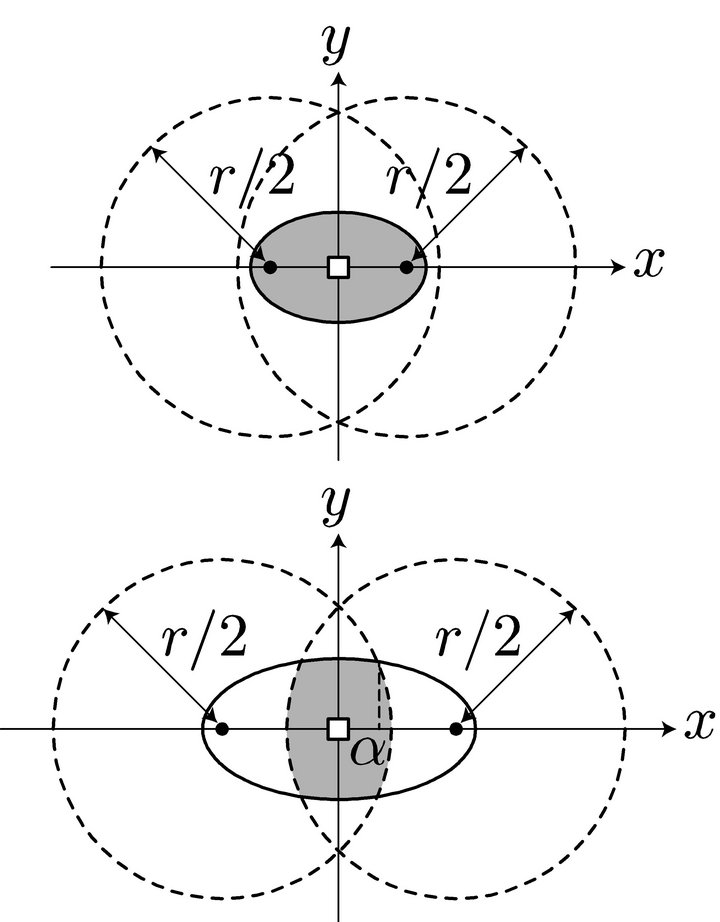
Figure 9. Contour of the deviation distance.
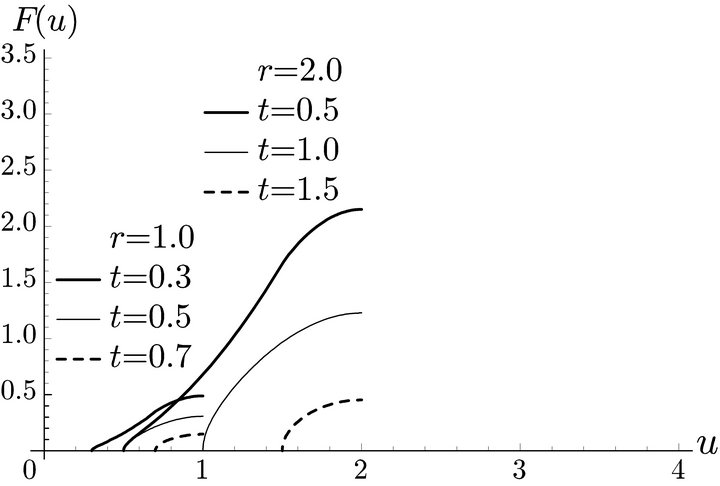
Figure 10. Distribution of the deviation distance.
6. Conclusions
This paper has derived the distribution of the deviation distance to visit an alternative fuel station. The major characteristic of the paper is that the focus is on whether the round trip between origin and destination can be made. The distribution that explicitly considers the vehicle range will give a more appropriate framework for the deviation distance of alternative fuel vehicles.
The analytical expressions for the distribution demonstrate how the vehicle range, the shortest distance, and the refueling availability at origin and destination affect the deviation distance. Note that finding these relationships by using discrete network models requires computation of the deviation distance for each combination of the parameters. The relationships are useful to estimate the number of vehicles refueled at a station and sufficient capacity of the station. The sufficient capacity can be used as an input in location models of refueling stations.
In this paper, we implicitly assume the early stages of an alternative fuel industry where stations are sparse. If many stations are available, drivers will choose the best station that minimizes the deviation distance. Incorporating the competition among stations would be a topic for future research.
NOTES