1. Introduction
This Climate change is a matter of concern to people from all walks of life and has to be assessed for all regions for better understanding of its future trends. The temperature, among all the meteorological parameters, plays an important role in detecting and assessing the climatic changes brought about by urbanization and industrialization. The Intergovernmental Panel on Climate Change (IPCC [1]) concluded in 2007 that warming of the climate system is now “unequivocal”, based on observations of increases in global average air and ocean temperatures, widespread melting of snow and ice, and rising global average sea level (IPCC [1]). The IPCC has concluded that most of the observed warming in global average surface temperature that has occurred since the mid-20th century is very likely a result of human activities.
Long-term climate variability is of great importance for the estimation of its impact on human activities and for predicting the future climate. Temperature variations influence agriculture, architecture, power generation and use, including electrical power for heating and cooling; melting of snow and the effects of freezing and icing on transportation systems, and flowering and harvesting dates. The temperature plays a key role in the development and growth of plants as a source of heat energy. Temperature changes over the years have been studied for almost each nation, developed or developing. Estimates are that the world is warming 0.6˚C ± 0.2˚C over 100 year, as quoted by Nicholls and Collins [2] and Folland et al. [3].
Karl et al. [4] analyzed monthly mean maximum and minimum temperatures from countries comprising 37% of the global landmass and found that the minimum temperature increased over the period 1951-1990 by 0.84˚C compared to only 0.28˚C increase in maximum temperatures. Hasanean [5] investigated the trends and periodicity of surface air temperature series from eight meteorological stations in the east Mediterranean using different correlation tests. He found a significant positive trend at 99% confidence in Malta and Tripoli, and negative trend at 95% confidence level in Amman. Mean, maximum and minimum surface air temperatures recorded at 70 climatic stations in Turkey during the period from 1929 to 1999 were analyzed by Turkes et al. [6] to reveal spatial and temporal patterns of long-term trends, change points, significant warming and cooling periods and linear trend rates per decade.
Domonkos et al. [7] studied the variability of winter extreme low-temperature and summer extreme hightemperature events using daily temperature series (1901- 1998) from 11 sites in central and southern Europe. There were large long-term fluctuations in the frequencies of both winter extreme cold and summer extreme warm events during the 20th century as pointed out by Domonkos et al. [7]. Del Rio et al. [8] presented the analysis of mean, minimum and maximum temperatures data from 171 stations in Spain on monthly, seasonal, and annual time scales. They obtained quite similar patterns for mean, minimum and maximum temperatures with increase in all months of the year and the annual series. Rebetez and Reinhard [9] analyzed long-term temperature trends based on 12 series of monthly data in Switzerland for the 20th century (1901-2000). Their results showed mean decadal trends of +0.135˚C during the 20th century and +0.57˚C for the last decade only.
Elagib and Addin Abdu [10] studied the climate of Bahrain during the past six decades, particularly the temperature and rainfall trends. Their study demonstrated climate variability represented by alternate hot-dry and cool-wet events. Alkolibi [11] assessed climatic impacts in Saudi Arabia and found that an increase in temperature and decrease in precipitation could have a major negative impact on agriculture and water supplies. The incidences of heat waves, hot days, very hot days and extremely hot days in Kuwait during the warm seasons (May-August) from 1958 to 2000 were investigated by Nasrallah et al. [12]. Their results showed that the extremely high temperatures in the warm season were due to the changes in the regional circulation pattern. Freiwan and Kadioglu [13] studied the climate variability of Jordan by examining the annual, seasonal and monthly precipitation and extreme temperature time series of 14 meteorological stations. Signals of climate trends such as warming in maximum temperature, more statistically significant warming in minimum temperature, decreasing trends in daily temperature range and statistically insignificant decreasing precipitation trends were detected.
The climate change studies have been performed in different parts of the world and by researchers for example Chang and Wallace [14], Maki and Kurose [15], Tarleton and Katz [16], Plummer [17], Turkes et al. [18], Henderson and Muller [19], Kadıoglu [20], Wanner et al. [21], Stefanicki [22], Domonkos [23], Elagib and Mansell [24], Brunetti et al. [25], Huth et al. [26], and Kysely [27].
This study presents long-term temperature variability analysis by utilizing daily time series data collected over 1970 to 2006 for Jeddah, a city on the west coast of Saudi Arabia. The analyses include monthly and annual temperature and range variation, warming or cooling rate estimation using Mann-Kendell rank statistics and linear trend analysis, estimation of hot and cold days and nights frequencies and finally the temperature anomalies on annual basis.
2. Data and Site Description
Jeddah is located on the west coast of Saudi Arabia and has seen a rapid growth both in population and infrastructure during the last decade. The map of Figure 1 shows the location of Jeddah in Saudi Arabia. The data analyzed in this study were recorded at Jeddah airport since 1970. The data could not be recorded during 1976 and 1984 due to some technical problems and hence has not been included. The study incorporates daily mean, maximum and minimum values of temperature in the present analyses. The data was checked for completeness and erroneous values using standard methods.

Figure 1. Location of Jeddah on Saudi Arabian map.
3. Methodology Used
The monthly and annual means and standard deviations were calculated by simple and known statistical methods. The magnitudes of the trends of increasing or decreasing temperatures were derived from the Mann-Kendell (M-K) rank statistics and the slope of the regression line using the least squares method. The Mann-Kendell (Kendell [28], Mann [29] and Kendell [30]) test is a nonparametric test, which does not require data to be normally distributed. The other advantage of this method is its low sensitivity to abrupt breaks due to an inhomogeneous time series. This test is used to analyze the statistical significance of all trends.
The M-K statistical test u(t) is a value that indicates direction (or sign) and statistical magnitude of the trend in a series. When the value of u(t) is significant at the 5% significance level, it can be decided whether it is an increasing or a decreasing trend depending on whether u(t) > 0.0 or u(t) < 0.0. A 1% level of significance was also taken into consideration. In order to obtain such a time series plot, sequential values of the statistic u(t) were computed from the progressive analysis of the M-K test.
The temperature range was obtained by taking the difference between the monthly maximum and minimum temperatures of the daily mean values. The number of hot and cold days and nights were estimated using daily maximum and minimum temperatures recorded during different years. The hot days are classified as hot if maximum daily temperature Tdmax becomes ≥35˚C, the hot nights are defined when daily mean temperature Tdmin becomes >20˚C, the cold days are defined as cold when Tdmax becomes ≤20˚C and finally the cold nights are classified as cold when Tdmin become ≤15˚C.
4. Results and Discussion
Using the data of daily mean (Tdmean), maximum (Tdmax) and minimum (Tdmin) values of temperature, monthly and annual mean temperature variability, monthly and annual minimum temperature variability, monthly and annual maximum temperature were studied and discussed in the forth coming paragraphs.
4.1. Temperature Data Sumamry
The overall variation of mean, minimum and maximum valued of daily mean, daily minimum and daily maximum values of temperature over data reporting period is summarized in Table 1. The mean, minimum and maximum of daily mean temperature (Tdmean) were 28.22˚C, 16.0˚C and 39.1˚C, respectively. Similarly the daily maximum temperature (Tdmax) varied between a minimum of 21˚C and a maximum of 49˚C while the overall mean was 34.26˚C with a standard deviation of 4.29˚C. The Tdmin varied between 8.2˚C and 42.0˚C with an overall mean value of 22.86˚C, as given in Table 1.
4.2. Frequency of Hot/Cold Days and Nights
The occurrence of number of hot days and nights and cold days and nights over different years were calculated and are depicted in Figure 2. It is evident that from this figure that number of hot nights is on the decrease while the number of hot days with year is on the increase. The regression lines of best fit show that the frequency of hot nights has decreased by 0.585 nights per year and that of hot days increased by 2.2 days each year which is really a significant trend. In Jeddah, as the Figure 2 depicts, cold days were not observed during entire data analysis period however an increase of 0.189 cold nights per year.
4.3. Variation of Daily Mean Temperature (Tdmean)
The long-term monthly mean (Tmmean) temperatures

Table 1. Temperature data summary for Jeddah during 1970-2006.

Figure 2. Annual frequency of hot days and nights and cold days and nights.
were calculated using the daily average values during the years 1970 to 2006 and are shown in Figure 3. This figure also displays the monthly minimum and maximum of the daily mean values. The minimum mean temperature of 23.1˚C was found in January while a maximum of 32.58˚C in July. This means that the ratio between the temperatures of hottest and coldest months was 1.032. Higher values of mean temperatures were observed from May to September, as seen from Figure 3. The monthly maximum of 39˚C and minimum of 16˚C of the daily average temperatures were also observed in June and January, respectively. In this case, the ratio between the hottest and the coldest temperature months was 1.033. Almost the same trends were followed by the monthly minimum values of the daily average temperatures with hottest to coldest month’s temperature ration of 1.030.
The monthly mean temperature (Tmmean), the corresponding standard deviations, the deviations from overall mean, difference between the monthly maximum and minimum temperatures of daily mean values i.e. range, and the covariance are given in Table 2. The COV is found to be bound with standard deviation (SD) and higher values of COV correspond to higher standard deviations and smaller COV to smaller SD’s. Higher values of SD and COV were observed for winter months and lower for summer months (May to October) which is an indicative of relatively more stable temperatures in summer. COV varied between 3.445% and 9.105% corresponding to August and March during the year. This shows that the temperature in August is most stable and least in March.
The deviations of monthly mean temperature from overall mean (Column 4, Table 2) show negative values during January to March and November to December while positive during rest of the months. Highest positive deviation of 4.354˚C was observed in July and lowest of 0.421˚C in April. The largest of the negative deviation of –5.721˚C occurred in January while the smallest of –1.852˚C in November. The maximum range of 14.4˚C was obtained in February and the minimum of 8.8˚C in August.
4.4. Trend Analysis of Monthly Mean of Daily Mean Temperatures (Tmmean)
The trends of monthly mean values of daily mean temperatures over different years were obtained using both linear regression best fit lines and the M-K rank test. The linear regression trends for all the months from January to December are shown in Figures 4(a)-4(l), respectively and the corresponding best fit equations along with coefficient of determination are summarized in Table 3.
It is evident from Figures 4(c)-4(g) that monthly mean temperatures have increased significantly during March to July with annual increase of 0.048˚C, 0.06˚C, 0.046˚C, 0.064˚C and 0.036˚C, respectively. This implies that in Jeddah the June Tmmean has increased by 2.368˚C in the last 37 years. Decreasing trends in Tmmean were observed in January and September to December, as can be seen from Figures 4(a) and 4(i) to 4(l), respectively. These trends are further confirmed by M-K rank statistics test results summarized in Table 4.
4.5. Trend Analysis of Annual Mean of Daily Mean Temperatures (Tamean)
The annual mean of daily mean temperatures showed an increasing trend with an annual increase of 0.0167˚C per year, as shown in Figure 5. This implies that over the last 37 years the annual mean temperature of Jeddah has increased by 0.62˚C. The M-K rank statistics also showed a significant increase in temperature of 2.70 at 0.05 level, as mentioned in Table 4. The annual deviations from overall mean temperatures show decreasing trends during 1971 to 1977 and 1986 to 1992 and an increasing trend beyond, as given in Figure 6.

Figure 3. Variation of monthly mean, maximum and minimum temperat-ures.
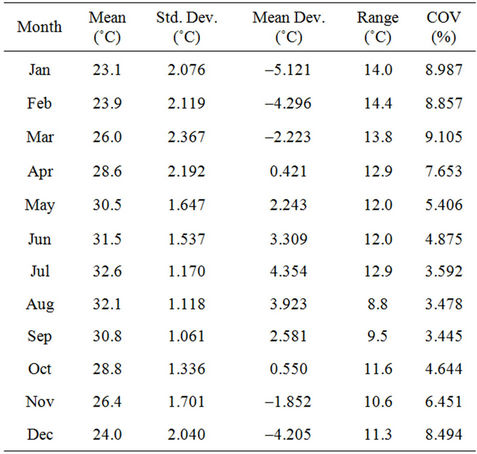
Table 2. Statistical summary of monthly mean temperature of daily mean values.

Figure 4. Linear regression trends of monthly mean of daily mean temperatures.
4.6. Variation of Daily Maximum Temperature (Tdmax)
The long-term monthly mean (Tmmax) temperatures

Table 3. Linear regression equations for all the months (Tmmean).

Table 4. Results of Mann-Kendall rank statistics.

Figure 5. Trend of annual mean of daily mean temperature (Tamean).
were calculated using the daily maximum values during the years 1970 to 2006 and are shown in Figure 7. This figure also displays the monthly minimum and maximum of the daily maximum values over the entire period of data collection. The minimum Tmmax of 28.7˚C was found in January while a maximum of 38.7˚C in July. This means that the ratio between the temperatures of hottest and coldest months was 1.033. The Tmmax was found to be greater than 30˚C during entire year except in January and December where it was less than 30˚C. The monthly maximum (49˚C) and minimum (35.4˚C) of daily maximum occurred in June and December having a ratio of 1.044. Almost the same trends were followed by the monthly minimum values of the daily maximum temperatures with hottest (July, 33.3˚C) to coldest (January, 21˚C) month’s temperature ratio of 1.042.
The monthly mean temperature (Tmmax), the corresponding standard deviations, the deviations from overall mean, range, and COV are given in Table 5. Higher values of SD and COV were observed for winter months and lower for summer months (May to October) which is an indicative of relatively more stable temperatures in summer. COV varied between 5.023% and 9.822% corresponding to August and March months of the year. This shows that the temperature is most stable in August and least in March.
The deviations of monthly mean temperature from overall mean show negative values during January to March and November to December while positive during rest of the months. Highest positive deviation of 4.42˚C was observed in July and lowest of 0.791˚C in April. The largest of the negative deviation of –5.555˚C occurred in January while the smallest of –2.048˚C in March. The maximum range of 20.8˚C was obtained in September and the minimum of 11.7˚C in July.
4.7. Trend Analysis of Monthly Mean of Daily Maximum Temperatures (Tmmax)
The linear regression trends of monthly mean of daily maximum temperature from January to December are shown in Figures 8(a)-8(l), respectively and the cor-

Figure 6. Trend of annual deviation from overall mean (Tamean).

Figure 7. Variation of monthly mean, maximum and minimum temperatures of daily maximum values.
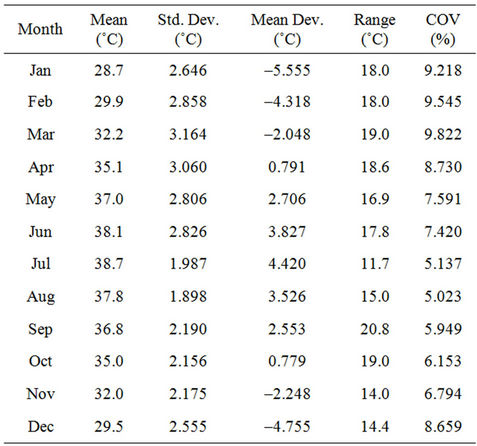
Table 5. Statistical summary of monthly mean temperature of daily maximum (Tmmax).
responding best fit equations along with coefficient of determination are summarized in Table 6. It is evident from Figures 8(b)-8(i) that monthly mean of daily maximum temperatures have increased significantly from February to September with annual increase of 0.074˚C, 0.10˚C, 0.111˚C, 0.111˚C, 0.122˚C, 0.063˚C, 0.044˚C, and 0.064˚C, respectively. This implies that in Jeddah the June Tmmax has increased by 4.514˚C in the last 37 years. Decreasing trends of Tmmax were observed in October and November as can be seen from Figures 8(j) and 8(k), respectively. These trends are further confirmed by M-K rank statistics test results (significant at 0.01 level from March to September) summarized in Table 6.
4.8. Trend Analysis of Annual Mean of Daily Maximum Temperatures (Tamax)
The annual mean of daily maximum temperatures showed an increasing trend with an annual rise of 0.0597˚C per year, as depicted in Figure 9. This implies that over the last 37 years the annual mean of daily maximum temperature of Jeddah has increased by 2.2089˚C. The M-K rank statistics also showed a significant increase in temperature of 5.34 at 0.01 significant level, as mentioned in Table 7. The annual deviations from overall mean temperatures show negative trends during 1971 to 1983 and 1989 to 1994 and then increasing trend beyond, as shown in Figure 10.
4.9. Variation of Daily Minimum Temperature (Tdmin)
The monthly mean temperatures along with the monthly

Figure 8. Linear regression trends of monthly mean of daily maximum temperatures.
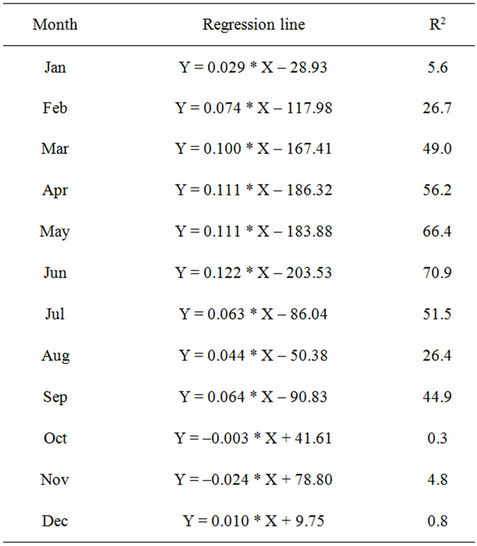
Table 6. Linear regression equations for all the months (Tmmax).

Figure 9. Trend of annual mean of daily mean temperature (Tamax).
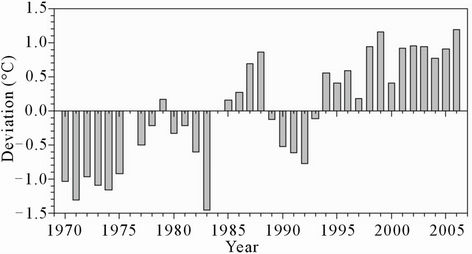
Figure 10. Trend of annual deviation from overall mean (Tamax).
maximum and minimum of daily minimum (Tmmin) values during the 1970 to 2006 period are shown in Figure 11. The Tmmin varied between a minimum of 18.2˚C in January and a maximum of 27.1˚C in August. This means that the ratio between the temperatures of hottest and coldest months was 1.031. The Tmmin was found to be greater than 20˚C during entire year except in January and February. The monthly maximum (42˚C) and minimum (24.6˚C) of daily minimum was recorded in May and January having a ratio of 1.058. Similar trends were followed by the monthly minimum values of the daily minimum temperatures with hottest (August, 20.7˚C) to coldest (October, 8.2˚C) month’s temperature ratio of 1.044.
The monthly mean of daily minimum temperature

Table 7. Results of Mann-Kendall rank statistics.
(Tmmin), the corresponding standard deviations, the deviations from overall mean, the range, and the COV are given in Table 8. Higher values of SD and COV were observed for winter months and lower for summer months (May to October) which is an indicative of relatively more stable temperatures in summer. COV varied between 6.912% and 14.109% corresponding to September and February months. This shows that the temperature is most stable in September and least in February.
The deviations of monthly mean temperature from overall mean show negative values during January to March and November to December while positive during rest of the months. Highest positive deviation of 4.232˚C was observed in August and lowest of 0.026˚C in April. The largest of the negative deviation of –4.613˚C occurred in January while the smallest of –1.428˚C in November. The maximum range of 25.2˚C was observed in May and the minimum of 10.8˚C in September.

Figure 11. Variation of monthly mean, maximum and minimum temperatures of daily minimum values.

Table 8. Statistical summary of monthly mean temperature of daily minimum values.
4.10. Trend Analysis of Monthly Mean of Daily Minimum Temperatures (Tmmin)
The linear regression trends of monthly mean of daily minimum temperatures from January to December are shown in Figures 12(a)-12(l), and the corresponding best fit equations in Table 9. The decreasing trends in the values of Tmmin were observed in the months of January, February, September, November and December but insignificantly as shown in Figures 12(a), 12(b), 12(i), 12(k) and 12(l), respectively. The decreasing trends and their significance were also confirmed by M-K rank statistics given in Table 10. A significant increasing trend was observed in the month of July with an annual increase of 0.049˚C. Similarly, significant decreasing trend was observed in the month of November with an annual decrease of 0.045˚C. This implies that in Jeddah the July Tmmin has increased by 1.813˚C in the last 37 years while the November has decreased by 1.665˚C.
4.11. Trend Analysis of Annual Mean of Daily Minimum Temperatures (Tamin)
The annual mean of daily minimum temperatures showed an insignificant increasing trend with an annual rise of 0.00031˚C, as shown in Figure 13. This implies that over the last 37 years the annual mean of daily minimum temperature of Jeddah has increased only by 0.0115˚C. The M-K rank statistics also showed an insignificant increase in temperature of 0.62, as noted in Table 10. The annual deviations from overall mean temperatures show negative trends during 1971 to 1977 and 1985 to 1992 and then positive trend beyond, as shown in Figure 14.
5. Conclusions
Following are the main findings of the study:
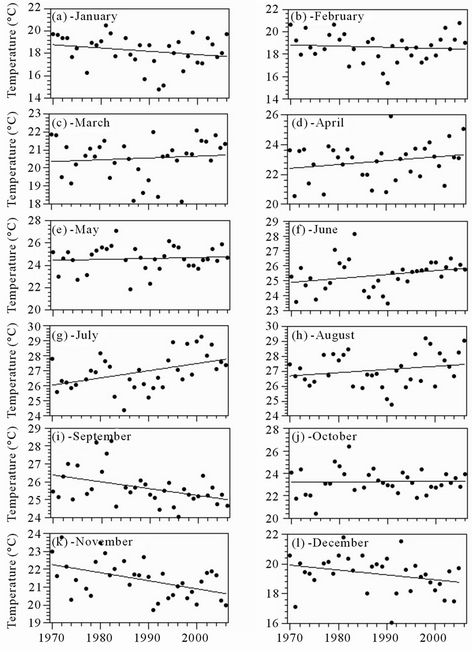
Figure 12. Linear regression trends of monthly mean of daily minimum temperatures.

Table 9. Linear regression equations for all the months (Tmmin).

Table 10. Results of Mann-Kendall rank statistics (Tmmin).

Figure 13. Trend of annual mean of daily mean temperature (Tamin).

Figure 14. Trend of annual deviation from overall mean (Tamin).
· The highest mean temperatures of daily mean and maximum occurred in July and that of minimum in August while the lowest, for all cases, in January with hottest to coldest month’s temperature ratios of 1.032, 1.033 and 1.030.
· A sharp rise in number of hot days of 2.2 per year was observed and a slight decrease of 0.585 per year in hot nights.
· The covariance values indicated stable temperature patterns during summer months compared to winter.
· The regression trend analysis of monthly mean temperatures (Tmmean) showed warming from March to July which was further confirmed by M-K rank statistics significant at 0.01 level. On the other hand, significant cooling was noticed in November.
· In case of monthly mean of daily maximum (Tmmax), significant warming patterns were observed starting from February till September which were confirmed by both the regression and M-K trend analyses. Slight cooling trends were noticed in October and November.
· The monthly mean of daily minimum (Tmmin) showed significant warming only in July and significant cooling in September, November and December.
· The annual trends of Tamean, and Tamax were significant at 0.05 level and 0.01 levels, respectively. The Tamin trend showed an insignificant increase during the reporting period.
6. Acknowledgements
The author wishes to acknowledge the support of The Research Institute of King Fahd University of Petroleum and Minerals, Dhahran, Saudi Arabia.