Implementation of Particle Swarm Optimization Algorithm in Matlab Code for Hyperelastic Characterization ()
1. Introduction
The study of the mechanical behavior of materials is of great importance to various industrial applications such as automation, aeronautics and biomechanics. The wide use of hyperelastic materials in industrial applications accounts for the high research interest expressed both in their characterization through experimental techniques and in the study of accurate constitutive models capable of describing their particular behaviour. Three criteria are necessary to determine the real behavior of a material: the choice of an adapted mechanical test, the choice of a constitutive law and the strategy of optimization of the material’s parameters. The optimization of hyperelastic parameters is an essential step in the designing of industrial parts. Several numerical methods suitable for the collection of experimental data are available in the literature notably Levenberg-Marquardt algorithm [1] [2] [3] [4], Beda-Chevalier method [5] [6] and the most recent methods such as Genetic Algorithm [7] [8] [9] (GA) and Particle Swarm Optimization method (PSO) [10] [11]. It has been shown that the PSO has better performance in finding the correct optimal solution than GA from a stochastic point of view [12]. The authors compared the performance of PSO and GA in terms of their accuracy, their robustness vis-à-vis population size and algorithm coefficients. Their study also revealed that not only does PSO have a higher probability to find the correct optimal solution than GA but is preferable to GA when time is a limiting factor. Without making a comparative study of optimization methods, this work seeks to demonstrate the applicability of the powerful PSO method to optimize the parameters of hyperelastic constitutive models.
The choice of an appropriate test is also essential to predict the mechanical behavior of hyperelastic materials. Materials’ parameters were thus optimized using a combined tension-torsion test. Simultaneous tension-torsion experiments are a relevant alternative to consider multiple loading conditions [13] and guarantee the model’s reliability to reproduce complex loading conditions. Several studies show that this type of test is well adapted to complex problems [14] [15] [16]. Lectez et al. [17] for example, use the tension-torsion test to characterize the behavior of elastometric engine mounts. Humphrey et al. [18] studied the finite extension and torsion of a nonlinear homogenous transversely isotropic incompressible solid cylinder. They proposed an analytical solution of the problem specifically for experimental correlation to identify a constitutive model for papillary muscles. These characterizations of rubbery materials on combined tension-torsional tests are reported in the literature. Emphasis is on the problem of torsion superimposed on the axial extension of a circular cylinder composed of an incompressible isotropic hyperelastic material [19] - [26].
This paper aims to implement PSO algorithm in Matlab code in order to determine the material parameters of the hyperelastic incompressible isotropic models using combined tension-torsion test data. The adopted method consists of reproducing trends of load force (N) and torque (M) of selected models using a solid circular cylinder’s large deformations. To investigate PSO algorithm’s appropriateness, the identification step of the material parameters is presented based on the correlation between the torsional couple (rather than the conventional methods of stress correlation or strain energy density correlation) rebuilt from test data and the theory. The identified parameters have been validated from the load force curves. Based on the combined tension-torsion test, the predictions of the selected models concur with experimental data.
2. Fundamentals
Homogeneous large strain elastic materials such as elastomers and biological tissues are conveniently modeled by hyperelastic constitutive equations. Practically, there exists a strain energy density function W, such that the stress tensor its derivative with respect to the strain [27]. Let us denote
the left Cauchy-Green strain tensor defined as
, F being the deformation gradient tensor and
the transposition. Based on the assumption that elastomers are both isotropic and incompressible, this strain-energy function only depends on the two first invariants of the left B, i.e.
(1)
with
(2)
The corresponding Cauchy stress tensor
is expressed as follows:
(3)
where p is a hydrostatic pressure term associated with the incompressibility constraint and
is the identity tensor. The equations describing the tension-torsion deformation of an isochoric cylinder were derived by Rivlin and Saunders [19]. We consider a deformed circular cylinder of radius R, length l, subject to a combination of a tension load N and a torsion torque M. The deformation consists in an axial displacement u in the direction ez (Figure 1). Let us assume that
is the undeformed cylindrical coordinate and
, the coordinate in the deformed configuration. This can be written thus:
![]()
Figure 1. Circular cylinder subject to combined tension and torsion.
(4)
where the constant of proportionality
is termed the amount of torsion,
the angle through which one end of the cylinder is rotated with respect to the other and
the global extension is given by
(5)
Considering a cylinder subject to both extension and torsion, the deformation gradient tensor is:
(6)
and the left Cauchy-Green tensor
is:
(7)
Thus, the main strain invariants are reduced to
(8)
The resultant applied load force and torque necessary to maintain the deformation are given by:
(9)
and
(10)
3. Hyperelastic Constitutive Models
A broad collection of models are available in the literature. In this study four phenomenological models were used models:
Mooney-Rivlin model [28]
The mooney-rivlin model is rather simple and uses a reduced amount of parameters. It deals with moderate nonlinear and simple material behavior. Strain-energy density function based on two invariants of the right Cauchy-Green deformation tensor is defined as:
(11)
where
and
are the material parameters.
Yeoh model [29]
The Yeoh model is a reduced third-order polynomial based only on the first invariant of the right Cauchy-Green tensor. This model deals with high non-linear material behavior using only three parameters.
(12)
where
,
, and
are the material parameters.
Gent and Thomas model [30]
Considering the general form proposed by Rivlin and Saunders [17], Gent and Thomas proposed the following empirical strain energy function which involves only two material parameters and a logarithmic function of the second invariant:
(13)
where
and
are the material parameters.
Fung model [31]
Yuan-Cheng Fung, the Founder of Modern Biomechanics, formulated the famous exponential strain constitutive equation for preconditioned soft tissues. The expression of this strain energy density function is based only on the first invariant of the right Cauchy-Green tensor
(14)
where C and
are the material constants.
4. PSO Algorithm for Hyperelastic Characterization
The ability of the different material models to reproduce any deformation curve depends on the definition of the values of the parameters associated to each model. Furthermore, the choice of these parameters depends on how a particular experiment is conducted and how the experimental data are processed [32] [33] [34] [35]. For an elastic material subject to large strains, the usual approach is to directly approximate the constants that appear in the mathematical model by employing numerical optimization techniques to minimize the residual between the stress-strain relation (for case of classical tests), the torsional couple or load force (for case of tension-torsion test, see for example [36] [37] ) and the experimental data. Then, identification consists in relating the theoretical solution
resulting from a model with the experimental curves represented by a couple of the point
, with
the number of the experimental points. To quantify the gap between the two responses, the objective function
is generally defined as:
(15)
A PSO algorithm will be used to minimize the objective function and identify the material parameters to obtain a proper fitness of the curves. The load-force curves simulation response is fitted to validate the specified parameters by the PSO method employed.
The PSO algorithm was formulated by Edward and Kennedy in 1995 [38]. This algorithm is a stochastic optimization technique that is well adapted to the optimization of nonlinear functions in multidimensional space. It has been applied to several real world problems [39]. It is a class of swarm intelligence algorithms that attempts to reproduce the social behavior of a generic population. PSO population is called a swarm and each individual in the population of PSO is called a particle. All of the particles have fitness values evaluated by the fitness function to be optimized. They have velocities that direct the ?ying of the particles. The system is initialized with a population of random solutions and searches for optima by updating generations. To seek the optimal solution, each particle moves in the direction to its previously best (
) position and the global best (
) position in the swarm. The speed and position of each particle change according to the following equality (see [40] ):
(16)
(17)
The index i varies from 1 to n, whereas the index j varies from 1 to D. n is population size and D is component of each individual of population.
represents personal best jth component of ith individual, whereas
represents jth component of the best individual of population up to iteration k. w, the inertia weight used to balance the global exploration and local exploitation,
and
are uniformly distributed random variables within range
, and
and
are positive constant parameters called acceleration coefficients.
Application of the PSO to the Mooney-Rivlin model.
Set Parameters
F: objective fonction.
: population size.
: minimal inertia weigh.
: maximal inertia weigh.
: acceleration coefficient of particule.
: acceleration coefficient of essaim.
: maximal velocity.
: minimal velocity.
: maximum number of iteration.
: lower bound of variable
.
: upper bound of variable
.
: lower bound of variable
.
: upper bound of variable
.
Initialize population of particles having positions and velocities
Evaluation
Set iteration
.
Calculate fitness of particles
; and find the index of the best particle
.
Update velocity and position of particles
with
.
Evaluate fitness
If
then
and goto step update velocity and position of particles else goto.
Print optimal solutions
STOP
The methodology presented in this section is summarized in the flowchart presented in Figure 2.
5. Results and Discussion
5.1. Pure Torsion Application
The application of combined finite axial stretch and finite torsion to a solid right cylinder of length l and radius is described in Rivlin’s works (1949). The cylinder is first subjected to a simple extension in which its length increases and its radius decreases. Then, it is subjected to a simple torsion.
In the pure torsion case, the cylinder is maintained unextended, so that
, Equations (9) and (10) become:
(18)
and
(19)
The analytical expressions of the torsional couple (M) and load force (N) calculated for each model in this case are summarized in Table 1.
![]()
Table 1. Analytical solutions of load force N and torque M calculated on pure-torsion test.
5.1.1. Optimization of Material Parameters
The optimization of the material parameters already described above is carried out in the case of pure torsion. The experimental data are those of Rivlin [41] and the analytical expressions of the torque are those given in Table 1. An optimization particle swarm algorithm was used to fit material constants’ best values by minimizing the objective function.
Fitness evaluation
Finally, the algorithm must evaluate the fitness level between the experimental and theoretical curves. In this case, it is clear that the fitness function must be related to the error between the curve created with a set of optimized parameters and the data obtained with the real test. The process of fitness evaluation is aimed at determining the margin of error. So, when the error of the curve is near to zero, fitness is near to 100.
Relative error is defined by
(20)
where
is the experimental torque and
, the theoretical predicted response of the model. The calculation of the relative errors generated in the fitting process presented in Figure 3 reveals that the relative errors are 0.012, 0.015, 0.016 and 0.016 for Mooney-Rivlin, Fung, Gent-Thomas and Yeoh models, respectively.
Both generated and approximated curves are presented in Figure 4 to show case the results obtained. From Figure 4, it can be observed that all the curves almost coincide along all the strain domain. It can thus be concluded that if
![]()
Figure 4. Best fit material parameters optimization: torsional torque curves on pure torsion test.
![]()
Table 2. Results of the identified parameters.
enough amount of data is used to fit the curve, the results will converge and correctly match the input data. The quest in this work for a proper match between the experimental and theoretical torsional torque curve of each model, led to the determination of the values of the material parameters which are presented in Table 2.
5.1.2. Verification of the Identified Material Parameters
To verify the accuracy of the optimized parameters, the identified constants in Table 1 were employed to predict the corresponding responses of the load force curve (N). The resulted calculated were compared with the data and plotted as presented in Figure 5. Based on the identified parameters, Figure 5 shows agreement between the experimental and calculated results curves. This suggests that the proposed identification method by using PSO is reliable and efficient.
5.2. Characterization of Hyperelastic Models by Combined Tension-Torsion Test
Prediction of Tension-Torsion Behavior
In the case of combined tension and torsion, the uniaxial extension is kept constant during torsion. The analytical expressions of the torque M of the deformed cylinder are presented with each model in Table 3 and the simulation results of
![]()
Figure 5. Verification of identified material parameters: load force curves on pure torsion test.
![]()
Table 3. Analytical solutions of torque M calculated on combined tension and torsion loading.
the torque in Figures 6-9.
To investigate the prediction power of the mechanical behaviour of hyperelastic models using combined tension and torsion test, the material parameters were determined for the first time by the PSO algorithm. This mechanical study shows that exponential and logarithmic strain energy functions do not give a good prediction of the tension-torsion test. The Fung (Figure 6) and Gent-Thomas (Figure 7)
![]()
Figure 6. Prediction of tension-torsion curve by Fung model.
![]()
Figure 7. Prediction of tension-torsion curve by Gent-Thomas model.
![]()
Figure 8. Prediction of tension-torsion curve by Yeoh model.
![]()
Figure 9. Prediction of tension-torsion curve by Mooney-Rivlin model.
models failed at small torsion angles. It is at intermediate angles that these two models reproduce the tensile-torsional test curve. The polynomial models are good models for the prediction of the tensile-torsional stress. Yeoh’s model produces the tensile-torsional test up to a value of
, then changes concavity (see Figure 8) due to the absence of
in this model. Among the selected models, the Mooney-Rivlin model, the most accurate model to reproduce the shape of the experimental curve, as shown in Figure 9. The PSO method used in this work thus allowed for a qualitative mechanical characterization of the hyperelastic models.
6. Conclusions
The aim of this work was to identify the parameters of hyperelastic incompressible isotropic materials models using PSO algorithm through the combined tension and torsion loading test. Four classical hyperelastic models were used based on the simulation of their torque and force curves to determine that is the best theoretical model capable of reproducing the mechanical behavior for rubber-like materials under tension-torsion loading. An optimization particle swarm algorithm was used to fit material constants’ best values on the pure torsion test. These parameters were then validated and used to simulate the tension-torsion behavior. All in all, the results of the study revealed that:
1) The combined tension and torsion test’s mechanical behavior can be accurately adjusted by using the polynomial hyperelastic models with a good agreement with the Rivlin’s data for the torsionnal couple curve;
2) The particle swarm optimization algorithm can be successfully used for hyperelastic characterization and for the generation of best material parameters;
3) The models capable of better reproducing the mechanical behavior of rubber materials from the combined tension and torsion test depend on the two invariants of Cauchy-Green
and
.
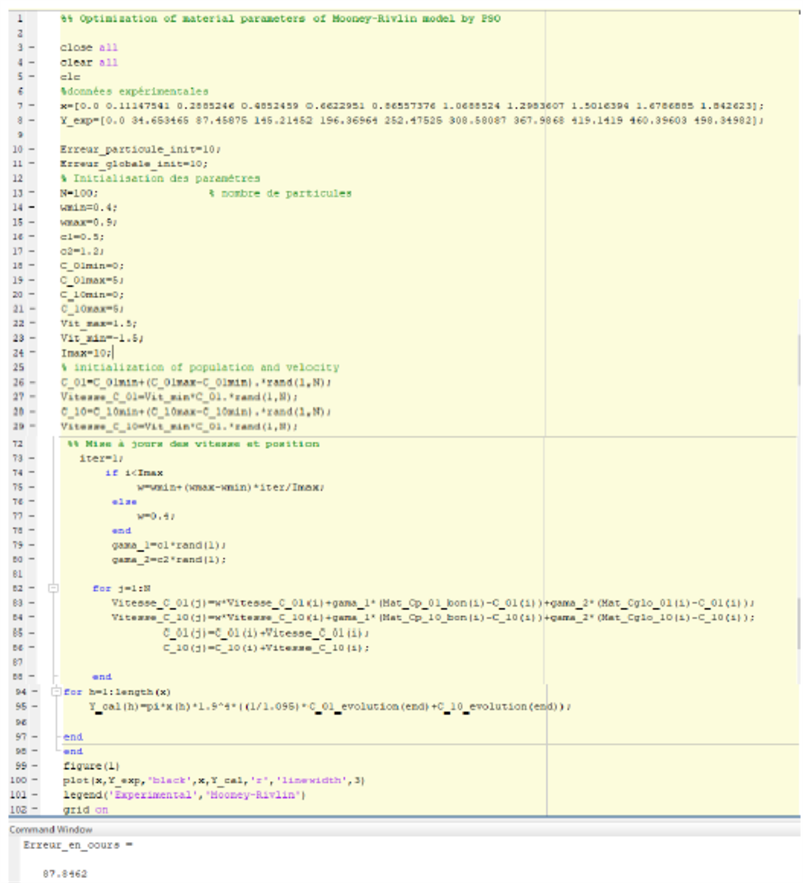
Appendix A. Matlab Code: Identification of Material Parameters by PSO Algorithm