
1. Introduction
Peanuts are the principal oleaginous food in rural areas of Madagascar. Peanut seeds and paste are appreciated for taste and peanut oil is widely used in cooking since it is not subject to oxidation by frying. It is the first oil crop and its production was intended for local consumption (mouth peanut). Only 3% of production was exported. The local consumption noted in 2005 was 5700 tons of mouth peanut or 5 g/person/day. Peanuts cultivation is practiced everywhere except in the too rainy oriental coast (2500 mm to 3500 mm in 200 - 250 days) and in the high areas exceeding 1500 m of altitude where the temperature is too low, also in the arid South extreme with a pluviometry less than 300 mm. In terms of cultivated areas―more or less 5%―it is far behind rice (50%), cassava (25%) and corn (10%), but local and international demand increasing, particularly China, local producers and investors were taking later a closer look. The Menabe area became with that a carrier zone. The last registered production was about 33,000 tons with about 54,000 ha of plantation in 2013, FAOSTAT. The fragile economic environment as well as the absence of specific national regulations on groundnut production is obstacles to the harmonious development of the sector.
The purpose of our study was a chemical characterization of 83 peanut samples realized in the Technological Research Department localized in Ambatobe Antananarivo. We studied principally the impact of the fertilizers on the nutritional component of the seeds. We performed here statistical treatments including analysis of variance, principal component analysis, correspondence factor analysis, discriminant factor analysis, and automatic classification on our data to determine the dominant characteristics of each batch of samples and the effects of fertilization formulas. The goal is to search step by step which constituents have the greatest discriminating power.
2. Methods
Geographical localization of cultures:
The essays were experimented on the five following sites:
Antananarivo at 1381m altitude with ferralitic soil
It is an area located in the high middle of the island, in an intertropical zone with a moderated climate due to altitude. The temperatures were generally between 10˚C and 30˚C. The summer is soft and very rainy and the winter very dry and fresh. The soil ferralitic is stripped of useful elements, cracked of holes. Nevertheless, if properly amended, it is favorable for the cultivation of maize, groundnut and cassava, and may lend themselves to the cultivation of potatoes and arboriculture.
Kianjasoa at 750 m altitude with fertile soil
It is an area located in the Middle West of the island with a tropical climate at altitude. Its temperature is between 18.7˚C and 35.7˚C. The winter gives a spring lightness and pleasant even very sunny. Rain is abundant in summer (1664 mm per year). The soil is of volcanic origin and can support amendments that allow large operations [1].
Fanalamanga Analavao at 912 m altitude: tropical altitude climate with forest
This site is localized in Moramanga, in the East center of the island, in the south-central part of the Alaotra-Mangoro region, very rich in Fauna and Flora. The soils are of lateritic or ferralitic origin degraded, following a long extensive industrial culture and reiterative bush fires. The rainfall is between 1300 - 1500 mm for 5 dry months. The average temperature is 17˚C - 18˚C, if the coldest month is 10˚C - 15˚C [2].
The cultivable area at Moramanga is more than 120,000 ha with 35,000 hectares under water control, with a great availability of water resources. Coffee and peanuts are its industrial crops [3].
Mampikony, Mahajanga and Toliary with 45m altitude: plain with alluvial soil
Mampikony:
Mampikony is located in the southwestern part of the Sofia region, Mahajanga province on the side of the Mozambique Channel. The territory of Mampikony is at a low altitude of 300 m on the average, sloping towards the coastlines from 0 to 16 m above sea level in the impermeable West carrying savannah. Tropical ferruginous soils on basalt predominate the general plateau. The abundance of alluvial soils made possible the development of commercial and industrial crops. The climate is tropical subhumid and hot, with 1700 mm of rain and an average annual temperature of 26˚C. The alternation of wet season and dry season is very marked. The rainy season named Talio lasted 5 - 6 months where 90% of rain falls. The dry season lasts 7 months with only 10% of rain. Average monthly temperature is 23˚C - 27˚C with a range of 15˚C. Market gardening is oriented towards the production of onions, rice, peanuts, cassava and corn [4].
Mahajanga (Boina region):
Located in the western part of the island, it represents about 6% of the total area of Madagascar. Mahajanga I and Mahajanga II, altitude 120 m to 240 m, are rural communes of Boina region, parts of the Boéni sub-region with 4621 km2 of total area. They are characterized by a hot (annual average temperature 25˚C) and humid climate with coast open on the Mozambique Channel in an altitude 0 - 15 m tormented by estuaries and a vast delta, vegetation typical of coastal areas (mangroves and beaches). The Mahajanga Province is strongly influenced by the monsoon. The climate is tropical dry, hot for 7 months and 5 months of rainy season. The region enjoys a tropical climate with contrasting seasons where heat is a constant. The rainy season is spread over seven months, from October to April and the annual rainfall averages 1000 mm to 1500 mm of water and a dry season with less than 10% of the total rainfall. Their soils are hydromorphic shallow or lowland soils. The vegetation is diversified: Mangroves rich in timber and firewood, dense dry forests, rainforests in the bordering area, savannah used as natural pasture, swampy formations producing plant fibers. The area covered by groundnut cultivation represents only 5% of the total areas cultivated. 40% of the groundnut areas are cultivated on higher land (tanety) in Asara season and 60% on alluvionary soil (baiboho) in Jeby season. Mahajanga II is one of the main producers of Asara groundnuts. The obtained yield in 2001 was 690 tons on 865 ha [5].
Toliary:
It is a region localized near the Tropic of Capricorn, along the Mozambique Channel. Gently sloping land of 4% dominates the region. Current climate implies the formation and the extension of poorly evolved, calcimorphic, isohumic, saline, hydromorphic soils. The soil where peanut was cultivated corresponded to typical red sand, more or less degraded in savannahs. The climate is warm (25˚C on average) and sub-arid. It rarely rains: less than 400 mm of annual rainfall. Annual drought and summer drought have the same characteristics. The winter season is getting drier. The vegetation in these regions then adapts to the geographic conditions: dry tropical and thorny forests, plants with acid fruits such as tamarind and lemon trees grow there mainly.
As groundnut, the production of the province of Toliary in 2004 was 54,974 tons in areas of 24,635 ha (SSA of MAEP, agricultural Directory), for the only region South-West it was 3330 tons on 4325 ha in 2005. The production reached 1825 tons of decorticated peanuts. Groundnut production is today relegated to second order. Droughts and the weakness of factor markets are notably responsible for the low productivity of groundnut farming systems in the region. [6].
Peanut seeds:
Agronomic Research Department in Ambatobe provided us the samples between 1986 and 1990: 15 samples from Antananarivo in 1986, 19 samples from CALA in 1988, 23 samples from CALA in 1989, 13 samples from Fanalamanga, 7 from Mahajanga and 6 others from Mampikony in 1990 [7].
Fertilizers
Two doses were experimented in the 4 sites.
High dose of fertilizers: 45 units of phosphorus, 90 units of potassium, 500 kg/ha of dolomite and 5 tons of manure.
Simple dose of fertilizers: 30 units of phosphorus, 60 units of potassium, 500 kg/ha of dolomite and 5 tons of manure.
The impact of fertilizers was observed during four years (1986, 1988, 1989, 1990).
Statistical analysis
Analysis of variance (ANOVA)
Analysis of variance was conducted and the least significant differences at 5% and 1% levels of probability were estimated by the F test of Scheffé. The effects were highly significant when p < 0.01 and significant when p < 0.05 [8]. A comparison of averages was done for the various components of seeds, in order to find the variability along the different years and locations (total randomization on every site with one studied factor, no controlled factor) [9].
Principal Components Analysis
Principal Components Analysis was also conducted for all the quantitative variables along different years, giving a correlation matrix and a circle of correlation [10]. Individuals were grouped according to their proximity with new variables, linear combinations of the former variables.
Factorial simple correspondence analysis was done for verification of the interrelationships between the varieties and the variables [11].
Discriminant factorial analysis was also done, the objective of which consisted in verifying the resemblance or the contrast between groups of observed relations [12].
Automatic classification analysis
Varieties were finally submitted to automatic classification analysis [13] giving a better visualization in the grouping of individuals.
3. Results
Interpretation
Most of the varieties tested under high dose of fertilizers came from the I.R.R.I, the Valencia 247 and SA156 served as witnesses; a double variety came from Alaotra collection and three ones from Toliary. Valencia 247 as witness near the I.R.R.I. varieties proved that these latter were better than the former. The highest yield registered in seeds was UPLPN2 with 4630 kg/ha, then CES103 with 4514 kg/ha. Concerning the three varieties from Toliary, H33 and 57 - 103 were better than the witness SA156, but they were generally less productive above all (Tables 1-4).
![]()
![]()
Table 1. Yield obtained in some groundnut seeds under high dose of fertilizers [7].
(I): Variety from I.R.R.I, (W): witness, (AC): Variety from Alaotra collection, (To): Variety from Toliary.
![]()
Table 2. Analysis of variance with peanut seeds lipids content from Toliary.
![]()
Table 3. Analysis of variance factorial 2 on the effect of 3 sites Toliary, Mahajanga and Kianjasoa.
![]()
Table 4. Grouping averages on the year factor according to scheffé test at 5%.
G: homogeneous group according to varied years of the 7 studied variables.
The analysis of variance showed a significant effect of fertilization (p < 0.0082) and variety (p < 0.0009) on seeds lipids in Toliary. That showed that fertilization increased the lipids content; and it varied according to the variety.
Interpretation
There were highly significant differences p < 0.0001 for the site effects under a same type of fertilization between Toliary, Mahajanga and Kianjasoa. Other, the fertilization effect differed in these three sites. The effect of variety was also significant there (p < 0.0363) explaining that fertilization effect from one variety to another might not be identical in the same site.
For Mahajanga, the extreme contents on lipids with high dose of fertilizers were 59.6% (variety SA 156) to 53.2% (variety SA 291). For Toliary, the extreme contents with high dose of fertilizers were 55.3% (Valencia 247) to 48.3% (Mwitunde); with simple dose of fertilizer the extreme became 52.0% (57 - 103) to 47.7% (Mwitunde). For Kianjasoa, with high dose of fertilizers, we found 53.7% (variety 6124) to 47% (variety Mwitunde); with simple dose, the extreme was 52.8% (SA 156) to 44.3% (SA 291). The size and weight of the seeds varied according to different parameters: variety, fertilizer, place of cultivation, when looking at their physical characteristics [14].
1) Years of culture effects on the seeds nutritive value
Variance analysis according to Scheffé test at 5% based on the dried matter gave the following results of the nutritive components in the peanuts seeds:
Interpretation
Factor “year” did not influence lipids content according to Scheffé test (Table 4): G = A, the group was homogeneous. The proteins content (34.64%, G = B) and the ashes (2.895%, G = B) were the highest for the year 1989; so were the phosphorus P2O5 (1.261%, G = C), the calcium CaO (0.381%, G = C) and the magnesium MgO (0.568%, G = B).
The year 1986 had the highest value in potassium K2O (1.524%, G = A) but the lowest proteins content (26.805%, G = A) and the lipids content near the lowest (46.383%, G = A).
These results could be explained by the fertilizers response after three years: the potassium content seemed impoverished along the years, if the proteins, the phosphorus, the calcium and the magnesium got richer during these three years.
The year 1990 was marked by impoverishment in proteins, mineral substances, potassium and calcium, so we could say that the peanuts had generally expired the absorption of the reserves into the soil after four years.
2) Sites of culture effects on the seeds nutritive value
The Mampikony area was the most favorable to peanut enrichment in lipids (53.251%, G = B), this group stood out from the others. CALA was the site were the peanut gave the highest content in ashes (2.799%) so phosphorus (1.181%), calcium (0.309%), and magnesium (0.276%) whereas Fanalamanga was the site where lipids content and ashes averages were the lowest one (respectively 45.628% and 2.265%). In the ashes and calcium content, we found the sites Tana; Fanalamanga and Mampikony in the same group (B) and the magnesium content the four sites were homogeneous (G = A).
Considering the results of the variance analysis for the site effects (Table 5), warm climate with alluvial soil was found to ameliorate the peanut lipids content, if the ferralitic soil was promoting the mineral matters enrichment.
3) Multidimensional analysis
Relationships between variables were obtained from the matrix correlation confirmed by 2 or more types of statistical analysis. Correlations were high when its coefficient was near 1 or far from its threshold; correlation was weak when the coefficient was near its threshold. We mentioned the correlations where coefficients were distinct from threshold (Table 6).
For 44% of varieties, there was a negative correlation in the content of lipids and potassium r = [−0.625, −0.605] in Fanalamanga and CALA. Some other varieties had a synergistic action between richness in K2O and richness in ashes (ACG 12, 63-102, PI 843). This latter was the highest and most frequent positive correlation for varieties from Antananarivo and CALA): (r > 0.900: 63 - 102, 6124, PI 843, ...) That was coherent as potassium is a mineral.
For 22% of varieties, where variables starch and silica were both analyzed, there was a notable positive correlation of these two variables; which was met in the case of CES 101, CES 102, Valencia 247, Mwitunde (Graph 2). The positive correlation was also found with minerals calcium and magnesium CaO-MgO (Mwitunde, Valencia 247, H 33, SA156). The result found by Arrivets [15] mentioning a negative correlation between proteins and lipids content, was also met in our experimentation: CES 225, UPL PN2, ACG 12, 7330, 6124 (14.8% of our varieties). Lipids and proteins are two reserve substances which could not both exist in the same variety, which explained the antagonism. Referring to the correlation matrix, the following positive correlations showed a separate coefficient from the threshold: phosphorus P2O5-ashes, r = [0.665, 0.712] for Antananarivo,
![]()
Table 5. Grouping averages on the site factor according to scheffé test at 5%.
![]()
![]()
Table 6. Examples of correlation among variables.
L: Lipids; WF: waste by fires; PM: protein matters.
CALA, and potassium K2O-Ashes r = 0.906 for Antananarivo. Lipids-calcium (lipids-CaO), magnesium-calcium (CaO-MgO), phosphorus-potassium (P2O5-K2O), respectively 0.583 for limit 0.436, 0.560 for limit 0.436 and 0.601 for limit 0.485 were moderately correlated.
Classification of varieties
Varieties seeds were grouped as followed:
A group rich in potassium and poor in lipids: CES 225, PI 118-200, ACG 12, SA 156, CES 103, F334 33, ACG 12, Kidang, …
A group rich in lipids and poor potassium: ICGM 578, ICGM 286, ICGM 281, ICGM 284, ICGM 285, ICGM 754, 61 - 24, …(Graph 2)
A group rich in starch and in silica: ICGM 336, CES 101, CES 102, …
Varieties rich in proteins and poor in lipids, such as CES 225, UPL PN2; the opposite characteristics (rich in lipids but poor in proteins) were also found with CES 101.
Interpretation
The effect of high content in potassium resulted in an inhibition of lipids richness, for example, ACG 12, CES 225, PI 118 - 200. Some varieties had a synergistic action of richness in potassium and richness in ashes, or richness in calcium and richness in magnesium., a potassium intake in the seed could enrich its mineral matter: ACG 12, 63-102, PI 843. Obviously, potassium is a mineral. A calcium contribution might also enrich its magnesium content: Mwitunde, Valencia 247, 6124.
Lipids content and calcium also presented a synergistic correlation (Valencia 247, Mwitunde, and ACG 12) (Graph 1 and Table 6).
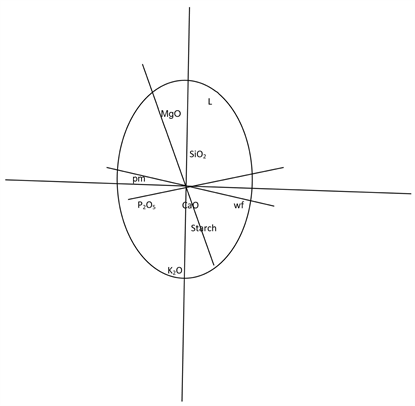
Graph 1. Correlation circle of variables for peanut seeds from CALA 1988.
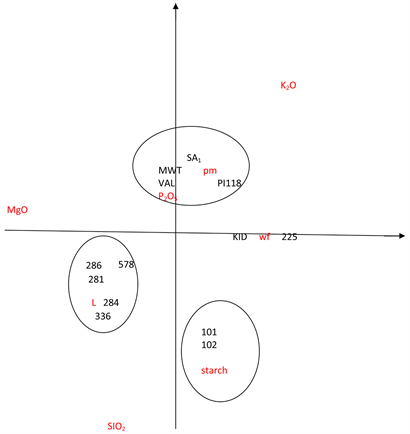
Graph 2. Factorial simple correspondence analysis for the same peanuts from CALA 1988. Legends: Variables: L = Lipids, pm = protein matters; wf = waste by fires; K2O = potassium; P2O5 = phosphorus; SiO2 = silicium; MgO = magnesium; CaO = calcium.
Varieties: SA1 = SA 291; MWT = mwitunde; VAL = Valencia 247; PI118 = PI118 200; KID = Kidang; 225 = CES 225; 101 = CES 101; 102 = CES 102; 286 = ICGM 286; 578 = ICGM 578; 281 = ICGM 281; 284 = ICGM 284; 336 = ICGM 336.
4. Conclusions
We could find in this analysis the influences of some constituents in a peanut seed. For instance, the richness in potassium and in ashes of the peanut of the variety 63 - 102 showed that this variety had an aptitude to fill up with ashes. There were also several classes of peanut varieties:
Like rather gathering lipids varieties: ICGM 281, ICGM 285, ICGM 286, ICGM 578, 6124, Valencia 247. They had poor in potassium seeds.
Varieties rich in protein matters and poor in lipids: 7330, SA 156, CES 225. They were found of piling up protein reserve.
Varieties which rather were able to accumulate potassium: CES 225, PI 118 200, ACG 12.
Varieties poor in calcium and in lipids: ACG12.
We remarked that most of Malawi varieties in different sites or different years formed inter-variable lipids and potassium link: it was a negative correlation. This correlation was frequent enough (44.5%). Did potassium fertilizer occur in the physiological mechanism of these varieties by enriching these peanuts in potassium? Many questions were applied, to lean forward with all the selection criteria: rusticity, ability to adapt in a climate, ecological site…