Three Types of Nuclear Envelope Assemblies Associated with Micronuclei ()
1. Introduction
In nearly all eukaryotic cells, genomic DNA is enclosed in the nucleus and the boundary of the nucleus is the nuclear envelope (NE) [1]. NEs are composed of a double membrane sheet of two closely juxtaposed lipid bilayers referred to as the inner and outer nuclear membranes. Along the inner and/or outer membranes, many different kinds of proteins interact with and/or are embedded in them. Perturbation of NE assembly because of mutations in NE proteins is associated with cell senescence and certain diseases, most notably cancer, indicating the importance of regulated NE assembly for proper cellular activities [1]. Although the precise regulation of NE assembly remains largely unknown, NE proteins can be categorized into two groups, “core” and “non-core”, based on the patterns of NE protein association with respect to the domains that are transiently formed around decondensing chromosomes during telophase of mitosis [2] [3] [4].
Micronuclei (MN) are small nuclei that store extranuclear chromatin bodies in cells. A major cause of MN formation is miss-segregation of chromosomal DNA during mitosis, followed by assembly of NE proteins around the miss-segregated chromosomal DNA in the extranuclear space of the cytoplasm [5] [6] [7] [8]. Recently, Liu et al. reported that the MN boundary frequently contains insufficiently assembled NE proteins. Specifically, core NE proteins can be assembled more efficiently around miss-segregated chromosomes than non-core NE proteins, leading to NE protein assembly defects in MN [8]. Although their findings concerning NE assemblies associated with MN provide a new perspective to assess the linkage between NE assembly defects and cell fate decisions of MN-containing cells, they may have overlooked other types of NE assembly defects that might regulate such decisions.
In this study, we investigated the localization of NE proteins in HeLa human cervical cancer cells. Based on the classification of core- and non-core NE proteins, we found three types of NE protein assemblies associated with MN under the standard condition and two pharmacological cell culture conditions. Interestingly, one of the NE types was characterized by a region deficient for both core and non-core NE proteins, and MN with this type of NE assembly frequently accumulated cyclic guanosine monophosphate-adenosine monophosphate synthase (cGAS), a pattern recognition receptor implicated in non-self DNA recognition. Our findings describe pharmacological cell culture conditions to induce MN and a method to differentiate NE defects associated with MN, providing insights into quality control of MN and cell fate decisions of MN-containing cells, which are relevant to regulation of genome instability and cancer development.
2. Materials and Methods
2.1. Reagents and Antibodies
All reagents, antibodies, and stock solutions are listed in the Supplementary information.
2.2. Culture Conditions and Drug Treatments
HeLa cells were maintained in Dulbecco’s modified Eagle’s medium/Ham’s F-12 nutrient mixture containing 5% fetal calf serum and antibiotics at 37˚C in a 5% CO2 incubator. For pharmacological induction of MN, we used the following two conditions. Low paclitaxel conditions: 5 × 10⁵ cells on coverslips in 12-well plates were cultured in the presence of 10 nM paclitaxel for 18 h [9] [10] [11]. High paclitaxel and reversine conditions: 5 × 10⁵ cells on coverslips in 12-well plates were cultured in the presence of 1 μM paclitaxel for 16 h, followed by incubation for 2 h with 200 ng/ml reversine [12]. Time-lapse analyses were performed to visualize MN formation under the pharmacological conditions (see Supplementary procedure).
2.3. Indirect Immunofluorescence Analysis and Image Processing
Indirect immunofluorescence analysis of cells cultured on coverslips was performed as follows. Cells were fixed with 4% paraformaldehyde in phosphate buffered saline (PBS) for 10 min, followed by treatment with 0.1% Triton X-100 in PBS for 5 min. After blocking with 1% bovine serum albumin in PBS for 15 min at room temperature (17˚C - 20˚C), the cells were labeled with primary and secondary antibodies accordingly. During secondary antibody incubation, samples were costained with Hoechst 33342 to visualize DNA. All steps were carried out at room temperature. Samples were observed using the XI71 microscope imaging system and cellSens standard software (Olympus). For each image, at least three slices from the z-axis were captured. ImageJ was used for image processing.
3. Results and Discussion
3.1. NE Protein Assembly Defects in Asynchronously Cultured HeLa Cells
Liu et al. reported that core NE proteins assemble efficiently around lagging chromosomes to form MN, whereas non-core NE proteins assemble poorly [8]. To reproduce their observation, we performed immunostaining analyses of MN in exponentially growing HeLa cells. We used antibodies against lamin A/C and emerin to detect core NE proteins and antibodies against lamin B and Ran-binding protein 2/nucleoporin 358 (RanBP2/Nup358) to detect non-core NE proteins (see TableS1). As shown in Figure1(a) and FigureS1(a), we observed multiple MN enriched with lamin A/C and emerin (core) but deficient for lamin B and RanBP2 (non-core), reproducing Liu et al.’s observation. However, we also noticed significant numbers of MN with seemingly different NE protein distributions. Specifically, we observed MN with NE regions deficient for both core and non-core NE proteins (Figure1(b) and FigureS1(b)). Therefore, we observed three types of NE protein assemblies associated with MN under our experimental settings: 1) NEs enriched with core NE proteins, but deficient for non-core NE proteins referred to as type I NE protein assembly; 2) NEs containing regions deficient for both core and non-core NE proteins designated as type II NE protein assembly; and 3) no detectable NE protein deficiency called intact NE assembly (Figure1(c) and FigureS1(c)). It should be noted that we did not observe any MN exhibiting NE regions enriched with non-core NE proteins, but deficient for core NE proteins (~0%). The percentages of MN with type I and
![]()
Figure 1. Association of three types of NE assembly with MN in asynchronously cultured HeLa cells. (a)-(c) Exponentially growing HeLa cells subjected to immunostaining analysis using anti-lamin A/C (left) and anti-lamin B1 (middle left) antibodies. Merged images are shown in the middle right. The area in the yellow box is enlarged to the right. The arrow in B represents the region lacking both lamin A/C and lamin B1 signals. Scale bar: 20 μm; (d) MN immunostaining patterns were categorized into three types: MN with seemingly no defects in lamin A/C and lamin B1 assemblies, designated as “intact” (positive for lamin A/C and lamin B1; yellow box), MN enriched with lamin A/C but deficient for lamin B1, designated as “type I” (red box), and MN containing a region deficient for both lamin A/C and lamin B1 designated “type II” (gray box). Sixty MN were detected under the asynchronous culture conditions (St; left bar graph), low paclitaxel concentration conditions (Pa; middle bar graph), or paclitaxel plus reversine conditions (PaR; right bar graph).
type II defects, and intact NE protein assembly were approximately 28%, 34%, and 38%, respectively, in 60 cells containing MN (left columns in Figure 1(d)).
3.2. Induction of MN with Type II NE Protein Assembly under Two Pharmacological Conditions
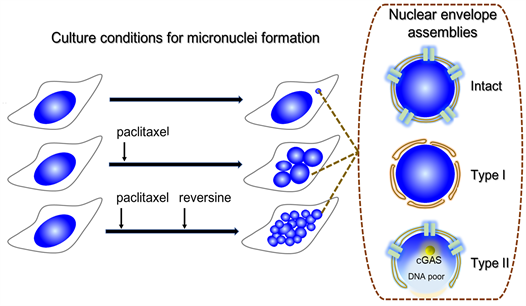
Because type II NE assembly appeared to represent a previously uncharacterized mode for storing DNA in MN, we were interested in determining whether such NE protein assembly emerged in cells under culture conditions distinct from the standard asynchronous conditions (“St” in Figure 2(a)). For this purpose, we chose the following two pharmacological treatments. The first set of conditions exposed cells to paclitaxel at a low concentration, which did not promote mitotic arrest but produced dramatic segregation errors, leading to MN production (“Pa” in Figure 2(a) and Movie S1) [9] [10] [11]. The second set of conditions employed a high dose of paclitaxel, under which mitotic arrest was induced, followed by exposure to reversine that overrides mitosis by inhibiting mitotic kinase Aurora B, resulting in MN generation (“PaR” in Figure 2(a) and Movie S2) [12]. As shown in Figure 2(b), both pharmacological conditions efficiently induced MN; approximately 60 and 80% of the cells contained MN under the Pa or PaR conditions, respectively. But it should be mentioned that the numbers of MN in a cell were different under the two conditions; approximately 6 MN and 24 MN were present per cell under the Pa and PaR conditions, respectively (Figure 2(c)).
To detect type II NE assembly under the two pharmacological conditions, Pa and PaR, we performed immunostaining analyses using antibodies against lamin A/C and emerin to detect core NE proteins or lamin B and RanBP2 to detect non-core NE proteins. As shown in Figure2(c), Figure2(d), FigureS2(a) and FigureS2(b), we observed MN with type II NE protein assembly under both pharmacological conditions. The percentage of type II NE assembly was approximately 53% under Pa conditions and 46% under PaR conditions (middle and right columns, respectively, in Figure1(d)). It should be noted that there were some (~5%) cells with type I NE assembly under both Pa and PaR conditions and we did not observe any MN exhibiting NE regions enriched with non-core NE proteins, but deficient for core NE proteins (~0%). These results suggested that, although the ratio of NE assembly types was somehow different from that obtained under standard conditions, three types of NE protein assembly were formed under all culture conditions and type II appeared to represent a major mode of NE protein assembly associated with MN.
3.3. Uneven DNA Distribution in MN with the Type II NE Protein Assembly Defect
Considering that interplay between NE proteins and DNA has a pivotal role in NE formation and chromatin architecture [1] [2] [3] [4], we were interested in the DNA distribution of MN with type II NE assembly. To assess the DNA distribution in MN with type II protein assembly as well as other types of NE
![]()
Figure 2. Generation of MN under the standard condition and two pharmacological culture conditions. (a) Schematic representations of the standard and two drug-treated procedures. The expected MN morphologies under each condition are illustrated on the right. St, standard conditions; Pa, treatment with a low paclitaxel concentration; PaR, treatment with a high paclitaxel concentration followed by reversine exposure; (b) After the numbers of MN-containing cells under the St, Pa and PaR conditions were counted, the MN-containing cell ratio of each condition is calculated and represented in a bar graph; (c) The number of nuclei in each cell under the St, Pa or PaR condition was counted in 30 cells and these numbers are represented in a point graph; (d) MN induced under Pa conditions were visualized by anti-lamin A/C (upper left) and anti-lamin B1 (upper left) antibodies. A merged image is shown at the lower left. The yellow box is enlarged at the lower right. The arrow represents the region lacking both lamin A/C and lamin B1 signals. Scale bar: 20 μm; (e) MN induced under PaR conditions were visualized by anti-lamin A/C (upper left) and anti-lamin B1 (upper right) antibodies. A merged image is shown at the lower left. The yellow box is enlarged at the lower right. The arrow represents the region lacking both lamin A/C and lamin B1 signals. Scale bar: 20 μm.
assemblies, we used Hoechst 33342 for fluorescent DNA visualization in MN. Representative images are shown in Figures 3(a)-(c). While the intensity of Hoechst 33342 signals appeared to be evenly distributed in MN with intact and type I NE assembly, the signal intensity was unevenly distributed in MN with type II NE assembly. Specifically, the area proximal to the region deficient for
![]()
Figure 3. DNA distribution in MN with intact, type I, and type II NE assemblies. (a)-(c) Exponentially growing HeLa cells were subjected to indirect immunofluorescence analysis using anti-lamin B1 (upper left) and anti-lamin A/C (upper middle) antibodies. In (a), a representative image of MN with seemingly no defects in lamin A/C and lamin B1 assemblies (“Intact NE”) is shown. In (b), a representative image of MN enriched with lamin A/C but deficient for lamin B1 (“Type I NE”) is presented. In (c), a representative image of MN containing a region deficient for both lamin A/C and lamin B1 (“Type II NE”) is shown. The DNA distribution was visualized by Hoechst 33342 staining (upper right). Intensities of lamin A/C and Hoechst 33342 staining were measured along the indicated lines (×®○) and are represented in line graphs accordingly (lower panels). Signal intensities are represented as arbitrary units (a. u.).
both lamin A/C core and lamin B1 non-core NE proteins exhibited less intense Hoechst 33342 signals, suggesting the existence of a DNA-poor area proximal to the region deficient for core and non-core NE proteins in MN with type II NE protein assembly. A similar uneven DNA distribution was detected in MN with type II NE protein assembly under the two pharmacological Pa and PaR culture conditions (FigureS3).
3.4. cGAS Accumulation in MN with Type II NE Protein Assembly
To further differentiate MN features with respect to NE types, we investigated accumulation of cGAS in MN under standard, Pa, and PaR conditions. It is increasingly clear that cGAS, which exhibits higher affinity for naked DNA than DNA residing in the nucleosome/chromatin [13], has emerged as a pattern recognition receptor implicated in sensing self- versus non-self DNA, followed by activation of the STING (stimulator of interferon genes) pathway [14] [15] [16] and references therein]. We therefore expected that cGAS accumulation might be a suitable signal to evaluate the quality of DNA residing in MN with different types of NE protein assembly. When we performed immunostaining analyses using an anti-cGAS antibody, cGAS signals were detected more frequently in MN with the region deficient for lamin A/C indicative of type II NE assembly than in MN enriched with lamin A/C indicative of type I or intact NE assembly (Figure 4). These findings suggested that accessibility of cGAS to MN with the type II NE defect was higher than that to MN with other NE assembly types, implying that cGAS accumulated more efficiently in MN with type II NE assembly than MN with intact and type I NE protein assemblies.
In summary, using the standard condition and two pharmacological conditions, we found three types of NE protein assembly associated with MN. Among them, the type II NE protein assembly defect was interesting because it contained a region deficient for both core and non-core NE proteins. Intriguingly, MN with this type of NE assembly contained unevenly distributed DNA and accumulated cGAS, a sensor of non-self-DNA, implying perturbation of not only NE but also DNA/chromatin assemblies. Because it is increasingly clear that NE assembly defects are the primary cause of genomic instability associated with MN and play a pivotal role in cell fate decision [5] [6] [7] [8] [14], our findings concerning the pharmacological settings and a method of discriminating NE proteins may be helpful for researchers in cell biology fields relevant to genome evolution, cancer development, and anti-cancer responses.
Acknowledgements
We thank all the members of the Saitoh Laboratory for helpful discussion. This work was supported by JP17H01878 and The Novartis Foundation Japan for the Promotion of Science to H.S. This work was also supported by JSPS KAKENHI Grant Numbers JP18H06069 to Y.I., JP18H05531, the research grants from The Naito Foundation and Takeda Science Foundation to N.S. We thank Dr. Toru Hirota for providing the HeLa-Kyoto cells expressing EGFP-H2B.
![]()
Figure 4. cGAS accumulation in MN with type II NE assembly under the standard condition and two pharmacological conditions. (a) Representative images of MN visualized by anti-lamin A/C (left) and anti-cGAS (right) antibodies. Lamin A/C-intact MN were considered as MN with “intact/type I” NE assembly (upper). Lamin A/C-deficient MN were interpreted as MN with “type II” NE assembly (lower). Scale bar: 10 μm; (b) Ratio of cGAS-positive MN with seemingly no defects in lamin A/C (“intact/type I” NE assembly) indicated by a light gray box. The ratio of cGAS-positive MN containing a region deficient for lamin A/C (“type II” NE assembly) is indicated by a dark gray box. Twenty MN were detected under the asynchronous culture conditions (St; left bar graph), low paclitaxel concentration conditions (Pa; middle bar graph), and paclitaxel plus reversine conditions (PaR; right bar graph). The bars and range indicate the mean ±95% confidence interval of three independent experiments.
Supplementary Information
1) Stock solutions
Reagents and stock solutions used in our experiments were as follows. Chemicals were purchased from FUJIFILM Wako Pure Chemical Corp., unless otherwise stated.
a) Dulbecco’s modified Eagle’s medium nutrient mixture F-12 Ham at 4˚C.
b) Fetal calf serum (GE Healthcare HyClone) at −80˚C.
c) Penicillin-streptomycin (100x) solution at 4˚C.
d) Phosphate buffered saline (PBS): 137 mM NaCl, 2.7 mM KCl, 10 mM Na2HPO4, and 1.8 mM KH2PO4 at room temperature.
e) 20% triton ×100 (polyoxyethylene octylphenyl ether) in PBS at 4˚C.
f) Bovine serum albumin (BSA; Takara Bio Inc.) at 4˚C.
g) 1 mg/ml reversine (Funakoshi) in DMSO at −20˚C.
h) 1 mg/ml pactilaxel in DMSO at −20˚C.
i) 10 mg/ml Hoechst 33342 (Dojindo) in H2O at −20˚C.
j) Anti-fade mounting solution (Slowfade Diamond Antifade Mountant) at −20˚C.
k) 4% Paraformaldehyde in PBS at −20˚C.
2) Antibodies
a) Anti-RanBP2 were obtained from Dr. Nishitani, University of Hyogo (see N. Yokoyama et al. Nature 376: 184-188, 1995).
b) Anti-lamin A/C mouse monoclonal antibody from Santa Cruz Biotechnology, Inc.
c) Anti-lamin B1 rabbit polyclonal antibodies from Abcam.
d) Anti-emerin mouse monoclonal antibody from Santa Cruz Biotechnology, Inc.
e) Anti-cGAS rabbit monoclonal antibody from Cell Signaling Technology.
f) Secondary antibodies used were purchased from Jackson Immuno Research, Life Technologies, Santa Cruz Biotechnology and Medical and Biological Laboratories.
3) Supplementary table
![]()
Table S1. List of core- and non-core-NE proteins [2] [3] [8].
4) Supplementary figures and figure legends
![]()
Figure S1. Association of three types of NE assembly with MN in asynchronously cultured HeLa cells. (a)-(c): Exponentially growing HeLa cells subjected to immunostaining analysis using anti-emerin (left) and anti-RanBP2 (middle-left) antibodies. Merged images are shown in the middle-right. The area in the yellow box is enlarged to the right. The arrow in B represents the region lacking both emerin and RanBP2 signals. Scale bar: 20 μm.
![]()
Figure S2. MN with type II NE assembly under the two pharmacological conditions. (a) MN induced under Pa conditions were visualized by anti-emerin (upper-left) and anti-RanBP2 (upper-left) antibodies. A merged image is shown at the lower-left. The yellow box is enlarged at the lower-right. The arrow represents the region lacking both emerin and RanBP2 signals. Bar: 20 μm; (b) MN induced under PaR conditions were visualized by anti-emerin (upper-left) and anti-RanBP2 (upper-right) antibodies. A merged image is shown at the lower-left. The yellow box is enlarged at the lower-right. The arrow represents the region lacking both emerin and RanBP2 signals. Scale bar: 20 μm.
![]()
Figure S3. (a) A representative image of MN containing a region deficient in both lamin B1 (upper-left) and lamin A/C (upper-middle), which was detected under the Pa conditions. The DNA distribution was visualized by Hoechst 33342 staining (upper-right). Intensities of lamin A/C and Hoechst 33342 staining were measured along the indicated lines (×→○) and are represented in line graphs accordingly (lower panels). The fluorescence intensities are indicated as arbitrary units (a. u.); (b) A representative image of MN containing the region deficient in both lamin B1 (upper-left) and lamin A/C (upper-middle), which was detected under the PaR conditions, is represented. The DNA distribution was visualized by Hoechst 33342 staining (upper-right). Intensities of lamin A/C and Hoechst 33342 staining were measured along the indicated lines (×→○) and are represented in line graphs accordingly (lower panels). The fluorescence intensities are indicated as arbitrary units (a. u.).
5) Supplementary procedure
Time-lapse imaging
HeLa-Kyoto cells expressing enhanced green fluorescent protein fused to histone H2B subunit (EGFP-H2B) were maintained as described previously [Hirota et al. 2004]1. For image analysis of the low paclitaxel treatment, cells were seeded onto a 35-mm glass bottom dish (Matsunami) and synchronized at the G1/S boundary using a double thymidine block. Synchronized cells were released into phenol red-free Dulbecco’s modified Eagle’s medium/Ham’s F-12 nutrient mixture containing 10% fetal calf serum and 5 ng/ml (~6 nM) paclitaxel. For the high paclitaxel and reversine conditions, cells were treated with 1 μM paclitaxel for 16 h to arrest them at mitosis, then 200 ng/ml reversine was added to the medium just before imaging. The dish was transferred to the cell chamber of a Keyence BZ-X810 microscope imaging system equipped with an S PlanFluor ELWD ADM 20xC objective lens. Images were captured for ~24 h (low paclitaxel) or ~2 h (high paclitaxel and reversine) at every 5 min using BZ-X800 Analyzer (Keyence).
6) Supplementary movie legends
Movie S1. Time-lapse observation of GFP-H2B-expressing HeLa cells exposed to low concentration paclitaxel, leading to MN formation. Time-lapse images were obtained under a green fluorescence field at lower magnification (×20) and reconstructed as a movie. Scale bar: 20 μm.
Movie S2. Time-lapse observation of GFP-H2B-expressing HeLa cells treated with high concentration paclitaxel, followed by reversine-exposure. Time-lapse images were obtained under a green fluorescence field at lower magnification (×20) and reconstructed as a movie. Scale bar: 20 μm.
7) Graphic abstract
8) Highlights
a) Micronucleus (MN) formation was assessed under three cell culture conditions.
b) Three types of nuclear envelope (NE) assemblies associated with MN were detected.
c) Type II NEs contain a region deficient for core and non-core NE proteins.
d) A DNA-poor and cGAS-enriched area is present in MN with type II NE assembly.
e) Type II NE assembly may be linked to cell fate decision of MN-containing cells.
Abbreviations
cGAS: cyclic Guanosine monophosphate-Adenosine monophosphate (GMP-AMP) Synthase
MN: Micronucleus/Micronuclei
NE: Nuclear Envelope
Pa: Paclitaxel
PBS: Phosphate Buffered Saline
R: Reversine
NOTES
1Hirota, T., Gerlich, D., Koch, B., Ellenberg, J. and Peters J.M. (2004) Distinct Functions of Condens in I and II in Mitotic Chromosome Assembly. J. Cell Sci., 117, 6435-6445.