Local Sustainable Development Indicators and Urbanization in Vietnam, What Are the Good Questions? The Case of the City of Chau Doc in the Mekong Delta ()
1. Introduction: A Necessity to Assess Urban Transformation
Since the late 1980’s, Vietnam’s society and territory have been undergoing a profound and rapid transformation process, the most notable manifestation of which are demographic changes. In 1988, cities were home to only 19.75% of the national population, versus 34.24% in 20161. This urban transformation process is far from complete. Not is it merely impacting the country’s two megacities that are Ho Chi Minh City, in the South, and Hanoi, in the North. Rather, it is affecting urban centers of all sizes. The issue, therefore, is understanding this phenomenon and discerning the human and technical means required for managing its spatial and human impacts, in order to ensure the best possible managing of these small and medium-sized towns.
As in most Global South countries, small and medium-sized cities in Vietnam play a determinant role as intermediate hubs between rural areas and urban networks, both nationally and globally. This is especially true in Vietnam, which has become one of the most dynamic, prosperous industrial and commercial powerhouses in Southeast Asia in recent decades.
In this era of social, economic and climatic change, effective urban planning necessitates guidance and management tools that can be adapted to the specific needs of intermediate cities and their populations. One hypothesis is that these cities can become excellent places for the implementation of sustainable development measures due to their specific intermediation function.
The aim of the present article is to analyze the relevance of local Sustainable Development Indicators (SDI) as a key tool for implementing a strategy of sustainable urban development, taking into account the specific needs and challenges of intermediate cities. These cities have limited technical and financial resources, but are nonetheless important centers for the optimal development of their hinterlands.
The city selected for this case study was Chau Doc, a Vietnamese city of 161,547 inhabitants (2018) located in the Mekong Delta, one of the most vulnerable regions to climate change in the world. This fast-growing border city has both significant urban and economic development potential (notably thanks to tourism, aquaculture and cross-border trade), but also increased risks of negative impacts on natural resources and the environment (water pollution in particular). Chau Doc is at a critical moment in its development, which further speaks to the need to develop appropriate sustainable urban development planning tools.
2. Sustainable Urban Development Adapted to Medium Sized Cities
Over time, sustainable development has become the preferred international framework for defining public action and encouraging individuals and companies to preserve the environment and in a way that respects the social and economic balance between major world regions and countries, as well as between individuals.
The history of ideas that is “sustainable development” is interesting to consider in brief, once we have determined what we believe makes for an environment that is conducive to the sustainable, coherent development of small and medium-sized cities. It is also interesting to note that a “soft consensus”—which allows anybody to use it as a normative reference without rigorously analyzing its epistemological foundations or the challenges of its implementation—has emerged around this terminology. All of this despite critiques and questions raised by the media and the scientific community with regard its objectives. These points should be analyzed and debated, given our role as researchers, whose goal is to link theories and models with methodologies and the functional application of scientific results.
The term “sustainable development” was first used internationally by the United Nations by a prominent working group (Brundltland, 1987) at the Earth Summit in Rio de Janeiro in 1992. In the years that followed, its implementation became the prerogative of local agendas, which aimed to translate its aspirations into public and private tools and practices internationally, nationally and locally. The outcome—Agenda 21, with its forward thinking 21st century objectives—gave rise to manifold interpretations. UN-issued norms, however, remained very general. An evaluation after 10 years of exercise suggested that the results did not meet expectations, the main criticisms being a fragmented approach to sustainable development that separates environmental issues from development policies and a lack of national policies linking sustainable development to the areas of finance, trade, investment and technology (NRC, 2002).
In 2000, the United Nations relaunched the process by decreeing the Millennium Development Goals (MDGs), which are comprised of eight global objectives with specific goals to achieve for each. The latter addressed the collective responsibility of promoting the principles of human dignity, equality and equity worldwide, notably for the most vulnerable (Devarajan et al., 2002; The World Bank, 2007). They also foster peace and justice at both the national and international level. According to an analysis by the World Bank at the time, international investments would have had to double to achieve the goals set by the United Nations, which was not to be the case (Bolay, 2012). Goal 7 aims to ensure environmental sustainability, including in urban areas. In concrete terms, it proposes a significant improvement in the living conditions of 100 million people living in slums, as well as initiatives aimed at providing access to drinking water and sanitation. And all of this before 2015 (Bolay, 2012, op cit, 81)!
In 2007, the British Government cooperation agency noted that great efforts remained to be made, with the overall number of city-dwellers increasing worldwide, primarily in emerging and developing countries (namely Africa and Asia). This same agency added that this phenomenon went together with an increase in the number of urban poor living in slums (DFID, 2007). In 2015, the UN re-stoked the fire by turning the MDGs into Sustainable Development Goals (SDGs), extending the horizon of 2030 and increasing the number of objectives from 8 to 17. This new set of objectives introduced an entire chapter on cities, with the aim of making cities and human settlements inclusive, safe, resilient, sustainable places. “Sustainable cities and communities”, the title of this 11th goal, posits that a positive dynamic between economic, social and environmental dimensions in urban and peri-urban areas requires a strengthening of urban and regional planning (Bolay, 2019). UN-Habitat, the agency responsible for the urban sector of UN agencies, estimates that 23% of all SDGs indicators have a local or urban component, can be measured at the local level, are directly linked to urban policies and have a clear impact on cities and human settlements. As such, UN-Habitat has been supporting more than 400 cities across the world in monitoring urban development, including the proposed indicators and Goal 11 targets via the City Prosperity Initiative. 6 indicators relative to this prosperity can be identified: productivity (through which we find the economic dimension of sustainable development), infrastructures, quality of life, equity and social inclusion (which brings us back to the social dimension of sustainable development), environmental sustainability (incorporating the original dimension of sustainable development), urban governance and legislation.
Three tools ranging from the analysis of urban sustainability towards strategies of action are available (for a fee) to interested cities. Depending on the city’s financial capacity (the tools go for $43,000, $150,000 and $250,000), the tools provide profile briefing in the form of a circle of prosperity analysis (one imagines virtuous), an index of urban prosperity, and finally lead to a city action plan, one logically following the other. The information to date is still too scant to determine the usefulness and accessibility of this type of UN initiative. Of the 307 cities listed in UN-Habitat data, most are in Mexico, followed by Brazil, Colombia and Ecuador. Asia is represented by only 10 megacities, including Ho Chi Minh City in Vietnam.
Questions remain regarding two key elements of this UN urban support program: the real cost of such operations and which small and medium-sized South cities can afford this service. Beyond the collection of statistical information, what method could be used to share this data through the involvement all urban actors (and urban inhabitants in particular) and to make it an instrument of exchange and democratic urban governance?
What nonetheless remains instructive, however, is the recent United Nations report on the SDGs (United Nations, 2017).
Its brief urban diagnosis is revealing: the overall percentage of people living in slums is decreasing. Yet, their actual number continues to increase (from 807 to 883 million). These figures are unverifiable, however, as there is no control base. 91% of the world’s urban population breathes air whose quality is inferior to the standards promoted by the WHO. Even more worrying, 90% of deaths attributed to natural disasters occur in low- and middle-income countries, with increasingly significant damages to housing.
In short, all of this points to the fact that a global framework has been adopted diplomatically to encourage public and private actors to act in a sustainable development perspective in all sectors, especially at the urban level. It is clear that such commitments require significant financial and human investments and must be focused on priorities for the benefit of the community at the environmental, social and economic levels, as well as in terms of territorial development as far cities are concerned.
3. The Many Facets of Urban Intermediation
We will now come back to our definition of urban intermediation as proposed by J.-C. Bolay and A. Rabinovich (2004), focusing first and foremost on the most appropriate dimensions for urban intermediation with respect to the city of Chau Doc in Vietnam (a border city, an economic hub, a touristic site, its environmental interactions), which served as our case study.
We propose a definition of the intermediate city that goes beyond strictly demographic and spatial characteristics. We know that medium-sized cities of 20,000 to 500,000 inhabitants such as Chau Doc are home to nearly 50% of the world’s urban population. The size of a city and its population are therefore critical to our understanding of the nature and extent of the problems it faces. However, this data alone does not explain the city’s transformation mechanisms or influence how it interacts with its periphery, rural areas or other cities near and far (Bolay & Kern, 2019). This is particularly important given that these medium-sized cities are the largest and fastest growing segment of the world’s urban networks (UN-Habitat, 2014).
Intermediation focuses on the interaction between a given city and its surrounding environment (direct and remote) based on eight criteria (Bolay & Rabinovich, 2004). The purpose of these criteria is to build indicators based on credible information and to establish a dynamic, historical, prospective diagnosis of the key trends that characterize the evolution of the city and its region. These criteria are as follows:
− Demographic: indicated by the natural growth rate and the impact of migration;
− Environmental: by ways of using and managing natural resources, and the intensity and degree of contamination linked to urban activities;
− Territorial: through urban planning, regional development projects and means of communication with other cities in the country;
− Economic: indicating the city’s competitiveness based on productive and commercial interaction that feed the surrounding rural areas and national/international markets;
− Social, educational and health: by the quantity and quality of services provided to the community, the inclusion of different socio-economic groups and social relationships that extend beyond the city;
− Cultural and leisure: the emergence of new urban lifestyles is an expression of a synthesising of local cultures and influences;
− Political and institutional: by the decision-making powers present in the city.
The driving force behind this urban shift is the interface between the local and global levels (Roberts et al., 2016; UCLG, 2014). It is therefore less a question of taking stock of the constituent elements of the city (facilities, infrastructures, services, institutions, etc.) than of focusing on the factors that determine positive and negative exchanges between the city, its environment, nature and society, both near and far. This analysis will 1) enable us to diagnose the city’s external interactions at a key moment in its history. It will also 2) allow us to encourage public and private decision makers to position themselves with respect to these dimensions and to take them into account in urban planning, knowing that the intensity of exchanges has a real and concrete impact on the city and its inhabitants, and that strategic choices can be made regarding investments in the city in order to amplify the positive spin-offs of intermediation and to mitigate the problems the latter can lead to.
Taking the example of Chau Doc, which we will examine further along in the text, we know that religious tourism plays a determining role for the city at a certain time of the year. This temporary influx of non-native visitors has positive consequences, boosting the local economy and creating jobs. It may also have a more negative impact in terms of urban mobility, traffic congestion and stress on natural resources to accommodate the needs of this transient population. Without prejudging an analysis that must still be refined over time, these issues are interesting, to say the least. It is also interesting to note that Chau Doc borders Cambodia, and that its regional services also are also increasingly attracting Cambodians from the neighboring region, thus bringing an international dimension to the city’s development.
This initial data regarding Chau Doc confirm that these eight criteria of analysis correspond to three circles of influence, characterized by the physical and virtual distance of intermediation:
− The local and micro-regional scale, by the relationships established between the intermediate city and its surrounding environment (hinterland);
− The national scale, marking the city’s inclusion in the urban network and its role in the strategies of the State and economic actors;
− The international scale, by the specific role the city plays in a given sector (import/export, tourism, transport, etc.).
The concept of intermediation helps us understand this reality by broadening the idea of urban hierarchy—large cities, medium-sized cities and small cities—as it is typically perceived (Nadou, 2010).
Indeed, after two to three decades of urban research devoted primarily to major cities and mega-cities that serve as a relay for the globalized capitalist economy, the focus is finally shifting towards smaller, less visible cities that are largely unknown simply because they are little studied. Through them, we discover an exciting and changing reality, firstly because they play a major role in regional development—far from capitals and major business centers—but also because modern communication technologies reinforce their economic and strategic assets in a fierce competition between urban centers, both nationally and internationally. However, these cities face dangerous shortcomings in terms of financial and human resources (Bolay, 2020; Bolay, 2018; Bolay, 2016).
These are all good reasons to act quickly, so as to better understand the issues and actors in these specific urban contexts and to develop programs and projects that respond to the needs identified.
4. Monitoring and Actions: What Role for Local Sustainable Development Indicators?
Boulanger (2008) reminds us that indicators were used for the very first time in sociological research (Lazarsfeld, 1958), allowing for “the translation of theoretical (abstract) concepts into observable variables so that the scientific hypotheses involving these concepts could be submitted to empirical verification” (Boulanger, 2008: p. 46). This scientific methodology was widely disseminated in the 1960s and transposed to the field of public policy in Europe and the United States, notably under the influence of a publication by Bauer, Biderman and Gross (1966) called “Social Indicators”.
The ability of indicators to make abstract concepts measurable has been instrumental in operationalizing the concept of sustainable development in both research and public policy. Agenda 21 has been key in promoting the creation of new sustainable development indicators. For instance, the last chapter of the National Action Plan for Agenda 21 emphasizes the need to revise the indicators typically used to measure the performance of cities and countries, which are now considered inadequate when it comes to evaluating the three dimensions of sustainable development.
Commonly used indicators such as the gross national product (GNP) and measurements of individual resource or pollution flows do not provide adequate indications of sustainability. “Methods for assessing interactions between different sectoral environmental, demographic, social and developmental parameters are not sufficiently developed or applied. Indicators of sustainable development need to be developed to provide solid bases for decision-making at all levels and to contribute to a self-regulating sustainability of integrated environment and development systems” (Chapter 40, paragraph 40.4, p. 346).
Since then, the use of indicators to monitor cities development has been both promoted and supported by international organizations (“local Agenda 21”, UNCSD, 2002), and developed through extensive scientific research aimed at establishing local SDI (Lynch et al., 2011; Block et al., 2013).
Quite heterogeneous, these approaches gave rise to a multitude of SDI that attempt to cover the wide range of fields related to sustainable development. According to Tanguay et al. (2010), this “explosion of indicators” is due to three main factors: 1) the definition of sustainable development is relatively general and can be translated and interpreted in many ways; 2) there is no standard definition of SDI, particularly at the municipal level, nor are there concerted objectives regarding their use, and; 3) the available data, their quality, quantity and access can be major constraints that guide choices in the definition of indicators.
Faced with this abundance of information, several researchers have analyzed and discussed the conditions necessary for better applying and using the SDI. Some argue for the need to harmonize, standardize and regulate their creation and uses so as to be able to use SDI as a means for comparing cities (Tanguay et al., 2010; Yigitcanlar & Lönnqvist, 2013). Institutions also participated in this effort to streamline the use of the SDI, as shown by Moreno Pires et al. (2014) with the European Union’s many research programs (1999-2014) designed to create comparable common indicators at the local and EU levels. Meanwhile, other researchers (Bakkes, 1997; Dhakal & Imura, 2003; Dahl, 1997) criticize such attempts to standardize, claiming that they would homogenize local realities, thereby creating indicators that do not reflect differences in territories’ political, social and economic cultures.
Yet, many studies analyze local experiences of cities that have set up local SDI and show their success. Brugmann (1997) proposes four criteria for the successful application of SDI the local level: first, as cities are often not prepared to meet the challenges of sustainability, the implementation of indicators should be seen as a training phase to sensitize municipalities to these issues (Brugmann, 1997: p. 70); secondly, the implementation of indicators occur in conjunction with actions that forge change (in other words, cities must monitor those trends on which they can and wish to act); thirdly, it is necessary to determine the expected uses of the indicators (land-use tools, decision-making tools, evaluation tools) as each requires a different method of construction and cannot necessarily be used interchangeably for several objectives; finally, the SDIs were developed first and foremost “to measure performance in implementing each goal or policy of an action plan” (Brugmann, 1997: p. 71), and their use should not be influenced by other fuzzier or more complex objectives.
In Vietnam, Ngo Dang et al. (2018) retraced the government’s gradual adoption of SDI at the instigation of the United Nations. This occurred following various failed attempts to develop a national set of sustainable development indicators for monitoring and assessing Vietnam’s sustainable development plan since 1998, the most recent of which covers the 2011-2020 period. The authors identify a number of pitfalls in these attempts, including the fact that they have no clear theoretical basis, do not take into account the absence of baseline data for some indicators, lack technical support (tools and databases for monitoring and calculating indicators) and overlook some important topics (e.g. no indicators related to Vietnam Seas and Islands).
Less rigorous than the national scale, local SDI development initiatives remain scarce. Some Vietnamese regions such as Ninh Binh, Lam Dong, Quang Nam, Thai Nguyen and Yen Bai were pioneers in developing local indicators in 2006 while taking into account the specificities (geography, economy, ethnic groups, etc.) of their territories. In 2013, these experiments led to the promulgation of a set of SDI for monitoring and evaluating sustainable development in provinces for the 2013-2020 period (Ngo Dang et al., 2018; Vietnam Prime Minister, 2013). This set of indicators is twofold: a general section composed of 27 indicators divided into common categories (economic, social and environmental, to which were added Incremental Capital-Output Ratio (ICOR) indicators), and a “local” section with specific indicators according to the country’s region: midlands and mountains areas (1 indicator), delta areas (2 indicators), coastal areas (2 indicators), cities under the central government (Ho Chi Minh City and Hanoi) (3 indicators), rural areas (5 indicators), plus two common indicators.
5. Vietnam in Urban Change
5.1. Urbanization Trends in Contemporary Vietnam
In 2019, Vietnam has 96.462 million inhabitants, with an annual population growth rate of 0.96%. Its urban population—34.317 million—represents 37% of the national population and has an annual growth rate of 2.98%2. As shown in Figure 1, population growth in general and in urban areas in particular has been stable in recent decades, with strong inter-regional migration towards more urbanized areas and the development of industry and services throughout the
country. In 1980, Vietnam had a population of 54 million. In 2000, this number had risen to 80 million, and 88 million in 2010. For the same period, the urban population represented 10.5 million urban dwellers (19.3% of the national population); 19.6 million urban residents in 2000 represented 24.5% of the population. In 2010, Vietnam 26.9 million urbanites (30.6% of the national population)3.
The national territory has a surface area of 331.231 km2, with a population density of 291 inhabitants per km2, making it the 15th most populous country in the world. This population increase goes together with the physical expansion of cities. According to Albrecht et al. (2010), the urban area in Vietnam increased to 630 km2 in 1995, and to 1380 km2 in 2000, with projections of 2430 km2 in 2010 and 4600 km2 in 2020. The density in urban areas is much higher than the national average, with an average of 26,997 inhabitants per km2 in Ho Chi Minh City and a peak of 44,135 inhabitants per km2 in the city’s 11th District. The average number of inhabitants in HCMC’s peri-urban area (Zhu, 2012), however, is 5876 per km2. Other sources are less alarmist and evoke a population density of roughly 4097 inhabitants per km2 for the entire metropolitan area4. In Hanoi, this figure is more modest, with 2300 inhabitants per km2 for its urban and peri-urban area5.
Albrecht et al.’s map (2010) of the entire national territory clearly shows concentrations of humans in and around major urban agglomerations, where the majority of industrial activities and services are located. The concentration then spread to the two major regions of intensive agriculture and exporters: the Mekong delta region in the South and the Red River Delta in the north (Figure 2).
5.2. Urbanization, Territories and Regions
This rural-urban prism is thus a key element for explaining the changes taking place in Vietnam. The urbanization process taking place there is one of the fastest in Southeast Asia and the world. It is worth recalling that two-thirds of Vietnam’s population is still rural, but that an urban growth rate of approximately 3% per year means enormous changes in the territorial distribution of individuals. It also requires investments in urban infrastructure and services, both to improve the living conditions of resident populations and to cope with the influx of migrants from rural areas.
It is therefore important to better understand how these demographic changes translate at the regional level, and how the urban population is distributed in the country.
According to a study conducted by the World Bank in 2012, Vietnam has 723 cities that can be divided into five groups: a first category (without status) includes Hanoi and Ho Chi Minh City, the two megacities under the control of the federal government. Category 1 includes the other provincial capitals, regardless of their demographic size, and cities of more than 500,000 inhabitants. Category 2 includes cities of more than 300,000 inhabitants Category 3 refers to the cities with a population of 150,000 to 299,000 inhabitants. Category 4 is comprised of cities of 50,000 to 149,999 inhabitants. Category 5 includes agglomerations of more than 4000 inhabitants (The World Bank, 2012a).
Thus, in 2009, there were (Table 1).
Things in Vietnam are changing quickly. To follow the analysis made by the OECD in 2018, the territorial structure in Vietnam, which was reorganized by the State in 2013, now divides the country into 58 provinces and five centrally-administrated cities: Hanoi, Ho Chi Minh City, Hai Phong, Dan Nang and Can Tho. Each province is therefore divided between “provincial cities”, “towns” and “rural areas”. The 11,162 Vietnamese communes are thus classified as urban or rural municipalities. The denomination of a municipality depends not only on the number of inhabitants, but also on: 1) the population density and 2) having less than 30% of the local workforce employed in the agricultural sector. Based on this nomenclature, in 2015 Vietnam had 2184 urban municipalities accounting for roughly 20% of the total of these entities (OECD, 2018).
To overcome administrative and territorial boundaries, the OECD has coined the term “functional urban areas” (FUAs). The method applied is based on the use of density to identify urban cores and commuting flows to identify poli-centricity and urban hinterlands (commuting zone).
This allows us to compare areas of urban settlements based on four categories:
• Small urban areas with a population of 50,000 to 200,000.
• Medium-size urban areas with population of 200,000 to 500,000.
• Metropolitan areas with population of 500,000 to 1,500,000.
• Large metropolitan areas with population of 1.5 million or more.
The exercise is interesting in that it identifies 63 FUAs in Vietnam, representing 7% of the national territory and 37.1 million inhabitants. This spatial and demographic representation based on density suggests that the current urban population in Vietnam exceeds official estimates and stands at around 41%. In this interpretation, the three largest metropolitan areas (Hanoi, Ho Chi
![]()
Table 1. Urban typology according to the city and % of the urban population (Source: J.-C. Bolay, based on data from The World Bank, 2012a).
Minh City and Hai Phong) have 18.325 million inhabitants (77% core population + 23% commuting zone population), followed by nine metropolitan areas that are home to 6.39 million inhabitants (51% core population and 49% commuting zone population), 31 medium-sized urban areas, with 31 FUAs for a total population of 9.66 million inhabitants (50 % core population and 50% commuting zone population), and 20 small urban areas representing 2.71 million inhabitants (65% core population and 35% commuting zone population).
These figures show the speed and scale of the urban transformations Vietnam is undergoing today. It is important to add that this urbanization process has largely occurred as a result of the development of the two main metropolitan areas: in the North, the city of Hanoi (population in the urban area: 4.53 million; Hanoi City population: 1.43 million6, but thought to be closer to 8.1 million in 20197), and in the South, Ho Chi Minh City (population in the urban area: 8.42 million; HCMC population: 3.47 million8, HCMC metropolitan population: generally estimated at 8 - 9 million, with some estimates at 13 million9,10,11).
In the words of Thang Toan (2018), this urbanization is now polycentric and has resulted in an unbalanced distribution of the population over the country’s six geographical regions, with a concentration in the two delta areas surrounding the aforementioned cities and large agglomerations of over 200,000 inhabitants. This phenomenon is directly linked to the industrialization that began in larger urban areas in the 1980s and 90s (Peilei et al., 2019). Census data shows that in 2009, rural-urban migration affected more than 2 million people, twice as many as in 1999. Urban-urban movement was less pronounced (1.7 million people) (Hoang Xuan et al., 2015). Ho Chi Minh City and Hanoi are also the two major hubs of immigration in the country due to their economic power.
This is accentuated by the role the Vietnamese government plays strategically and politically in supervising the country’s major cities (Gilbert & Segard, 2017). Although the actors involved in the urban field are diversifying, with increasingly marked privatization of production and services, decisions regarding Hanoi—the political capital—and Ho Chi Minh City—the country’s main economic hub—are made at the level of the central government and then passed down to local levels (Figure 3).
5.3. The Economic Dimension of Urban Changes
Urban growth and economic growth are closely linked, a fact that has not been denied in recent years. For example, the GDP (Gross Domestic Product) rose from $193 billion in 2015 to $245 billion in 2018, with annual growth rates steadily rising and among the highest in the world (3.78% in 2015, 6.23% in 2016,
9.01% in 2017 and 9.46% in 2018). This translates into a rise in wealth per capita. In the past 30 years, Vietnam has transitioned from a poor country to an emerging one that, moreover, is booming, with the economic and financial means to meet its ambitions. The per capita GDP in 1989 was US $95. In 2000, this figure reached US $390, rose to $1318 in 2010, $2085 in 2015, and finally US $2564 in 2018. Nearly 45% of the industrial production is concentrated in the southeastern region, of which Ho Chi Minh City is the largest national economic center, followed by the Red River Delta and the country’s capital, Hanoi, with 27%. The Mekong Delta is the third largest industrial region in Vietnam, contributing roughly 10% of the country’s industrial production (Garschagen et al., 2012) (Figure 4).
Annual growth in terms of economic output is 7.1%12. In 2018, the primary sector (agriculture, forestry and fishing) accounted for 13.9% of the national GDP, industry and construction for 33.49% and the service sector for 42.54%13.
These macro figures are impressive and reflect Vietnam’s overall evolution: economic growth and a consequent decline in mass poverty that prevailed in the 1980s, before the country’s economic opening. The famous doi moi14 for which
the government topted in 1987 (Bolay et al., 1997; Gironde & Tessier, 2015), liberalized the business world (de-collectivization of agriculture, recognition of private businesses and liberalization of “land use rights” starting in the 2000s), also allowed for private and international investments and indirectly facilitated the internal migration within the country (relaxation of individual control measures). Following Gironde and Tessier (2015: p. 165), the most characteristic is that “the urban footprint reflects the country’s industrialization and growth of the service sector, which was initially concentrated around the two major cities and has now stretched along corridors, such as the Hanoi-Haiphong and Ho Chi Minh City-Ba Gia Vung Tau axes”. As these authors further explain on p. 166 of their article, “Beyond the metropolises and major cities, the economic dynamism of the entire urban fabric, including the district capitals, is remarkable. Small cities obviously have less of an impact than large ones, but their development has essential—and in this case increasing—spillover effects on the countryside.” The agricultural fabric is shrinking, but production is intensifying and diversifying. New activities in the secondary and service sectors aimed at marketing in national urban and international markets are being developed. This inevitably implies a growing demand for available land, putting pressure on cultivable land and land prices, particularly in the Red River and Mekong delta regions, as well as at the periphery of other urban centers on the thin coastal plain linking these two regions. These are heavily populated areas of compact cities and dense networks of villages, with over 10,000 people per square kilometer (Labbé, 2016). The road network is expanding and new, better quality roads now connect the cities to one other, facilitating the movement of people and goods. Moreover, new infrastructure is enhancing the attractiveness of these newly urbanized areas.
The most traditionally prosperous agricultural regions are becoming the backbone of metropolitan industrialization and benefit from migratory flows that lend to the country’s selective urbanization. They are also extensions of the country’s current economic prosperity and a symbol of the segregation that exists between “modernized” and “marginalized” regions. Beyond the cities and their direct peripheries, this urbanization process is sparking movement among rural populations from agricultural to non-agricultural activities in rural areas, with an increase in household income and expenses, greater rural-urban mobility and increased remittances of urban migrants to their rural relatives (Ben Youssef et al., 2016). Thus did Nguyen Minh and his colleagues (2019), following an econometric study of urbanization in Vietnam between 2006 and 2016, observe that the urbanization process is gradually helping to reduce social inequalities in Vietnam, both now and for the long term. Nguyen Hao (2016) came to the same conclusion in his article on the impact of economic growth on social advancement in Vietnam, as did Nguyen Cuong and Pham Nguyet (2018).
The World Bank’s statistics confirm this relationship between the regional expansion of urbanization and the reduction of poverty. The most urbanized areas are proportionately those that are the least affected by poverty (The World Bank, 2018). The poverty rate has drastically decreased in recent years, from 20.8% in 2010 to 9.8% in 2016. This still represents 9 million poor people, 94.7% of whom live in rural areas. The rural-urban divide is therefore clear, as this population represents 13.6% of individuals in rural areas versus 1.6% in urban areas. Poverty is also particularly high among ethnic minorities (nearly 58% of indigenous populations) (Nguyen Cuong & Pham Nguyet, 2018). More generally, however, this downward trend in poverty in Vietnam is largely due to strong job creation in recent years: the Vietnamese export boom has resulted in a 13.3% increase in the manufacturing sector, creating 1.4 million jobs and a rise in wages, while agricultural employment fell by 4%.
Despite these undeniable trends, income-based or expenditure-based poverty measurements, which take into account not only income but also housing conditions, access to urban, health and education services, etc. according to the national statistics produced by the Ministry of Labor, Invalids and Social Affairs (MILISA), obscure the multidimensional criteria of poverty. These criteria, in short, reflect both the standard of living of households and the urban and environmental qualities of their neighborhoods.
In addition, Thanh et al. (2013) have shown that, as they are attached to their place of origin administratively, urban migrants are not taken into account in urban poverty measures. Yet, this category of precarious mobile workers plays an important role in the incomes of rural households and represents the “invisible” face of urban poverty statistics.
These elements offer us a glimpse into the issues linking poverty reduction and rural-urban ties in Vietnam—issues that are particularly evident in small and medium-sized cities. We will see this later in the case study of Chau Doc, where poverty is “nonexistent” according to official statistics, but precarious, rundown neighborhoods still exist and economic opportunities are still too limited to provide enough work for the local working population (Figure 5).
According to information provided by the French Development Agency (Albrecht et al., 2010), the World Bank estimates that the financial effort needed to put Vietnam at an acceptable urban standard by 2020-2025 would require an additional 262 million euros for water supply, 195 million for sanitation and 576 million for housing, in addition to the 1.4 - 2.1 billion the provinces and cities already spend on public investments in urban areas (The World Bank, 2019). This additional investment is not disproportionate, especially given that the economic situation is extremely positive. However, the capacity to absorb the value of the expenditure incurred on investments and maintenance so as to be as close to actual costs as possible should be assessed carefully. In order to do this, it is necessary to develop a viable economic and financial model based on tax collection from successful companies and families to support local governments in aiding the poor, notably through a system of social and trans-provincial equalization.
These recommendations will help take into account the growing socio-economic inequalities in Vietnam. More awareness must also be fostered with regard to territorial differentiations so that major cities do not become the exclusive focus. Rather, investments must be divided between metropolitan areas, intermediate cities and small towns, so as to also meet the needs of rural, peri-urban and urban populations across the country in a fair and balanced way. The Mekong delta region merits particular attention, given its fragile ecosystem. Care must be taken in when urbanizing it, to avoid accentuating the population’s exposure to growing environmental risks.
![]()
Figure 5. Poverty in Vietnam (by district in % of the population for each district). (Source: The World Bank, map Vietnam Home, based on data from 200916).
6. The Mekong Delta Region: The Most Dynamic Region in the Southern Vietnam
Little data is available on the urban situation in the Mekong Delta, where the city of Chau Doc (which we will discuss later) is located. Even less captures the dynamics that permeate this vast region, though we know that, after Hanoi and Ho Chi Minh City, it is the most populous region in Vietnam and among the most economically dynamic.
As illustrated in Figure 6, the Mekong Delta region covers only 12% of the country’s surface. But its 17 million inhabitants represent nearly 20% of the
![]()
![]()
Figure 6. The Mekong Delta region (12 provinces and the city of Can Tho) (Source: Wikipedia17).
national population distributed over 132 towns and cities in 2010. The province of An Giang, where the city of Chau Doc is located, is one of the 12 provinces of this region, with a population of 2149.457 inhabitants in 201018. This global demographic figure of the Mekong Delta region is forecasted to increase to 30 million by 2050. Its urban population is 25%, which is less than the national average (Partners for Waters, 2013). It is interesting to note, as the RUA and SIPS’s report (2013) does, that while the population of the delta increased by 10.3%, from 15.84 million to 17.48 million, between 1994 and 2013, this increase is small in comparison to the national population (roughly 23.71% for the same 20 year period). The main reason is the massive emigration of individuals from the delta to the HCMC metropolitan area. It is thus the region with the highest emigration index in the entire country. Between 2000 and 2009, emigrants from the region accounted for 734,000 individuals, 97% of who went to the Southeast—including Ho Chi Minh City—in search for employment. The Delta region saw only 70,000 immigrants during this same period. Hence, it is above all a region of expatriation. The question therefore arises as to whether the regional and national governments’ projections for the Mekong Delta provinces for the next 30 years will change the dynamics that have gradually been building up over the past several decades.
Urban growth in the Mekong Delta region has long been lower than elsewhere in Vietnam. Between 2004 and 2013, its annual urban growth rate was only 2.3%, versus 3.6% for the whole country. Yet, this trend has reversed in recent years (3.7% in the MDR versus 2.7% for Vietnam between 2007 and 2013) (RUA & SISP, 2013). The most urbanized province of the region is Can Tho, followed by the neighboring province of An Giang, where Chau Doc is located. GGGI (2014) confirms this trend and evokes an urban growth rate of around 3.3% of between 2005 and 2012 (Figure 7).
Yet, these migratory movements do not translate into poor economic health. The modernization of the region’s economic fabric and the sectoral changes that are occurring there are combine with Ho Chi Minh City’s strong attractiveness in terms of industrial and service jobs.
The Mekong Delta region provides 40% of the nation’s agricultural production and accounts for more than 50% of agro-food export. In 2008, it already accounted for nearly 32% of national industrial production. The food-related industry—especially food processing—is the region’s strongest sector, followed by the production of agricultural inputs and aquaculture (e.g. fertilizers, pesticides, seeds and fish feed), machinery and equipment, textiles, building materials and low-tech manufacturing industries. Industrial production is concentrated in the region’s three largest provinces—Can Tho (18%), Long An (16%) and Kien Giang (11%)—representing almost half of the region’s secondary production (Garschagen et al., 2012) (Figure 8).
At environmental level, with an average elevation of less than three meters above sea level, the Mekong Delta region is highly sensitive to climate change. The level of the sea is expected to rise 30 - 70 cm by 2050 (The World Bank, 2012a). Water is among the paramount issues recognized by government bodies in the Mekong Delta region: safe water supply is available for only to 60% - 65% of the urban population. This figure is much lower for the rural population. While data with regard to wastewater are less known, the experts claim that the majority (2/3 domestic and 1/3 industrial) is dumped untreated into the rivers and caves (Deltares Staff, 2011). The habitat issue is also far from being resolved. According to the most recent official statistics—in 2009—, only 8% of households lived in safe, quality housing. 22% lived in precarious, unhealthy dwellings and 70% lived in partially solid dwellings, which they supplemented with poor-quality materials. This is significantly lower than the national average, which indicates that 47% of Vietnamese households live in safe conditions (Garschagen et al., 2012).
The highly industrialized province of An Giang, where Chau Doc is located, has seen impressive growth in recent years. It is also one of the most environmentally vulnerable due to its many flood zones, as the following Figure 9 shows.
A recent World Bank (2019) document provides some additional urban information. Delta cities have annual economic growth of between 13% and 20%, mainly due to growing agriculture productivity, increased investment in industry and tourism. However, this does not change the fact that 14% to 30% of urban dwellers in these cities are considered as low-income households and live in precarious neighborhoods in cities with substandard housing, poor access to basic infrastructure and services, high levels of environmental pollution, dilapidated tertiary roads and low connectivity. Many of these cities suffer from
frequent flooding and other negative impacts due to their low elevation and infrastructure deficits. To remedy this, an impressive urban upgrading project has been designed and will be launched in six intermediate Delta cities (Ca Mau, Can Tho, Cao Lanh, My Tho, Rach Gia and Tra Vinh) outside the An Giang province and its capital, Long Xuyên (Garschagen et al., 2012).
In February 2014, the Vietnamese government approved “the master plan on socio-economic development of the Mekong Delta key economic region through 2020, with orientations towards 2030”19. Considering that the Mekong delta is a key region for Vietnam’s future, guidelines for 2020-2030 have been established in different areas in order to develop the Mekong Delta economic region into a driving-force region. In urban planning terms, the goal is to synchronously develop urban centers, residential areas and technical/social infrastructure that are environmentally friendly. To do this, we find the priorities to be taken into account in point V of the official document. Point V is specifically dedicated to urban development and regional territorial organization. We learn that the region’s urban population was expected grow at a rate of 5% between 2010 and 2015, then by 4.7% between 2016 and 2020, at which time the urban population will represent 47.8% of the region’s total population. The city of Can Tho is the center of commerce, economy and industry, as well as science, technology, culture and sports. Its population is expected to reach 2 million in 2020 (The World Bank, 2012b). Other urban agglomerations will also be developed and upgraded: Long Xuyen will be developed as a grade I provincial urban center, while Rach Gia, Ca Mau, and Chau Doc will be elevated to grade II urban centers. Other towns will be included in grades III and IV. As we will see in the next chapter, which focuses on Chau Doc, it appears that the government will support Long Xuyen, Rach Gia, Chau Doc and Ha Tien in becoming business and services centers.
All of this is highly normative and sectoral, in a tradition of regional and urban planning that undoubtedly has undoubted social and environmental effects (Bolay, 2017). However, unlike other countries Vietnam has major financial means to invest in the realization of programmed projects and an extremely hierarchical administrative and political system forged on top-down decision-making. Still, we do not find urban studies of small and medium-sized cities, neither nationally nor with respect to the Mekong Delta provinces—a flaw that should quickly be remedied. As we recently wrote (Bolay & Kern, 2019), the intermediate cities that link the rural world to the entire urban network worldwide are those with the highest urban growth. In addition, these cities also serve to retain populations and halt flight towards large cities. In this sense, the study of Chau Doc can be considered as a pilot study to be replicated in other cities in the region.
7. Chau Doc, Booming Regional Center
7.1. The Characteristics and Issues of a Medium-Sized in the Mekong Delta
Chau Doc City is one of the main economic, political, cultural, scientific and technical centers in the An Giang province. The city is located at the intersection of the Bassac and Chau Doc Rivers (branches of Mekong), some 250 km from Ho Chi Minh City. Its proximity to the Cambodian border and attractiveness to tourists make it an intermediate business and service center not only in its direct environment but also internationally.
In 2018, Chau Doc had a population of 111,577 (Statistical Office of An Giang Province, 2017). The total area of Chau Doc city is 10,523.11 ha, or 2.98% of the provincial area. Regarding land-use planning, agriculture land accounted for 78% of the total area in 2015, but is expected to decrease to about 72% in 2020. Contrarily, non-agricultural land has increased from 19% in 2015 to nearly 26% in 2020, as a consequence of urban development, as illustrated in Figure 10.
As a border-city, Chau Doc is an important trading and tourism gateway, from the An Giang province and Mekong Delta region to Cambodia and South East Asia by both road and waterway. Chau Doc has many well-known tourist attractions for both the local populations and international tourists, including Ba Chua Xu Nui Sam Temple, Bung Binh Thien, the Chau Doc floating village and Cham villages. In 2018, Chau Doc city received 7 million visitors, 300,000 of who
were from abroad. Although spiritual tourism sites are attractive destinations to many visitors, the percentage of tourists that stays overnight in Chau Doc city is low. For example, the number of tourists who stay overnight only accounted for 6% of all visitors in 2016 (Vo Van et al., 2017) (Photo 1).
In terms of urbanization, the periphery surrounding the center of Chau Doc, the pilgrimage center of Nui Sam and the axe connecting these two areas have all developed rapidly.
And the urban population continues to grow. Although estimated at about 110,000 inhabitants according to 2017 statistics, the local authorities we consulted orally during our work on site specified that the population was closer to 158,787 inhabitants in 2015, 146,964 of who lived in the inner city. With an annual population growth rate of 1.7%, the city should have reached 161,157 inhabitants in 2018. Such flagrant differences in demographic estimates cannot be explained. Instead, we will have to wait for the next official population census to get a more accurate idea of the number of people actually living in the city and province. The average density of the city is 1255 inhabitants per km2, but can reach 5400 and 2365 inhabitants/km2 in the two oldest urban districts, Phuong Chau Phu A and B, which were urbanized starting in 1977.
The city’s population is estimated to reach 202,982 inhabitants by 2035, 189,495 (93.4%) of who are concentrated in 45.7% of the city’s surface (see Figure 11).
According to information gathered from the administrative officials of An Giang province and Chau Doc city, the per capita income of Chau Doc was 63.32 million Vietnamese dong (2870 US dollars) in 2014, with an economic growth rate of 16.03% and 1.0% of total households living under poverty line. Five years later, poverty remains more or less absent, with 100% of households enjoying access to clean water and electricity, according to national statistics.
Chau Doc serves as a regional pole, with many primary, secondary and high schools, but no university. In terms of sanitation, it has four public hospitals with a total capacity of 1000 beds. It is also home to a huge central fresh food
![]()
Photo 1. Chau Doc located along a branch of the Mekong (Source: Photo J.-C. Bolay, 2018).
![]()
Figure 11. Chau Doc administrative boundaries and population projection (Source: Adapted from chaudoc.angiang.gov.vn).
market and other commodities, as well as a floating market, a traditional form of commerce in the Mekong Delta.
That said, the existing infrastructure seems to not be compatible with the city’s development. The lack of a drainage system results in flooding and water pollution, as waste water is evacuated to canals and rivers. Rubbish collection and treatment is another worrisome issue for the city. Traffic jams and the lack of parking and public transportation are particularly problematic during festival periods due to the archaic road network comprised of many narrow streets and no installations to regulate.
According to the information provided on the city government’s website, several projects to modernize infrastructure and beautify the city are planned. This includes the widening of road axes and the construction of a new 667-meter-long bridge to supplement the ferry service currently linking Tan Chau to Chau Doc. In addition, there are plans for new housing developments, a new cultural/sports center with a recreational field, the remodeling of the Nui Sam historic site, as well as the linkage of Chau Doc, Can Tho and Soc Tran via a 150-km highway extension, all for 2030. These projects can be found in the 2025-2030 planning document, which will be briefly discussed later.
On the environmental front, the An Giang province has decided to close its 33 open dumps and replace them with a solid waste incineration plant. This new infrastructure, which will also meet the needs of Chau Doc, will be built and managed by a private company and will treat 195 tons of waste daily (though the province produces 1128 tons). This is nonetheless a first step in the right direction, but it will not solve all of the evacuation and solid waste treatment issues (Photo 2).

Photo 2. Floating habitat in Chau Doc (Source: Photo by J.-C. Bolay, 2018).
Its natural relationship to and interdependency on water for the economy (agriculture, aquaculture, trade), transportation, sanitation, housing (floating houses, stilt houses), tourism (floating markets) make the city highly vulnerable to rapid urbanization and climate change. As one of the main sources of surface water for the city, the Hau River has an average flow of approximately 13,800 m3/s, up to 24,000 m3/s during the rainy season and only about 5000 m3/s in the dry season. The results of monitoring done in June 2018 showed that the DO, TSS, COD, BOD5, Amoni, and Coliform parameters measured in the Chau Doc River and urban canals exceed norms (QCVN 08-MT:2015/BTNMT), which means poor water quality for people living in the area.
Like most areas in the Mekong Delta, Chau Doc is also being affected by climate change, with specific manifestations such as: increased intensity and frequency of flooding; increasing soil erosion of tourist resorts and accommodation facilities; decline in surface and groundwater resources; drought in the dry season as well as in the rainy season, which is abnormal (Phan Thị & Tran Trong, 2019).
The provincial authorities, however, are not passive in view of this situation. A development plan has been defined for 2025-2030 (Nguyên Nuh, 2016). The document, which is very general, is not exactly an urban master plan with precise spatial and environmental indications, but it provides for both territorial projects and planned infrastructure and facilities. This geo-referenced translation should be a priority task for the provincial government; otherwise, a pileup of sectoral projects with no overarching spatial or societal coherence, which we have denounced on other occasions, is bound to occur (Bolay, 2019).
The themes evoked in this prospective document range from training to health, and even the planned infrastructures scheduled over the next few years. Out of the 120,000 individuals estimated to be living in Chau Doc in 2030, 81,600 will be of working age. Working people with a basic education account for 50.60% of the reference population, this rate should reach 90% by the end of 2030. The percentage of people working outside of the agricultural sector is currently 80% and is estimated to reach 92% in 2030.
The government’s formative strategy is twofold: 1) to better train the working population of Chau Doc with regard to local priority needs such as tourism, tertiary services and transportation and 2) to develop the city in such a way as to attract individuals with a high education level. This will be done primarily through investments in specialized facilities, namely 35 new schools ranging from primary to secondary education.
In terms of spatial planning, highly classical solutions that have already been tried and tested with elsewhere in Vietnam still prevail. Zoning in the urban area means new housing developments (an extension of the current urban center by some 600 hectares) and the creation of more touristy green spaces. These works will mainly be financed by the federal and provincial governments, with support from international lending institutions.
In short, we can conclude that the main directive for the next 10 years is to bolster Chau Doc’s tourism potential, rather than rehabilitate existing buildings or manage environmental issues.
These dimensions, which are still secondary in the current strategy, can nonetheless be integrated into the vision the government is promoting, once an appropriate way of doing so has been determined. This could be made possible through more direct interaction between inhabitants, local/provincial officials and potential job providers. A more horizontal dialogue addressing current and future problems from an inter- and transdisciplinary perspective and based on technical and socio-economic studies could indeed enrich the objectives of the provincial government and stimulate a local and regional dynamic of sustainable urban development.
7.2. Learning from Inhabitants: Information on the City in Transformation
Individual interviews with 33 households provided an overview of some of Chau Doc’s priority issues.
A grid of 23 questions was used as a basis for semi-structured interviews in three areas of the city: 11 in the old center, eight near the Phuong Nui Sam tourist hub (around the pilgrimage center), and 14 in the intermediate zone connecting the two, a sparsely populated area, whose rice fields and farmland are rapidly giving way to housing developments.
The two maps that follow show the location of the interviews.
The first (Figure 12) shows households’ date of arrival in the neighborhood and the type of real estate. Our first observation was the relatively few situations of illegal occupation. In most cases, the individuals owned both their home and the land it was on (14 households), just the home itself (8 households), or only the land (5 households). The amount of time since the family had settled was not an influencing factor on ownership. The interviews made allowed us to discuss the introduction of building and renovation permits, which previously were not necessary and are still largely ignored according to the interviewees (they build illegally on agricultural land or expand existing homes without permits).
The second map (Figure 13) provides an overview of how the municipality is managing the works to improve infrastructure. The failings of the drainage network, a major issue for the city as evidenced by the field observations and interviews with residents and the local government, have not been improved by the road works. Indeed, the many improvements (asphalting, widening, elevation), do not always result in the extension of the drainage network. While the old center is gradually being serviced, the new planned neighborhoods are underserviced, even though costly housing developments and infrastructure works (electricity, drinking water) are being carried out by the city government. Meanwhile, the inhabitants’ strategies impact the environment and the quality of the water, as their wastewater drains directly into the rice paddies, fields, canals and river.
![]()
Figure 12. Map based on interviews results: Type of ownership relative to the year of arrival (Source: Created by the authors).
![]()
Figure 13. Map based on interviews results: Sanitation and infrastructure improvement (Source: Created by the authors).
Respondents stressed this lack of coherence and clear planning, though they noted public investment efforts. Similarly, they mentioned the lack of transparency in terms of public action on several occasions: four people raised concerns about eviction due to public projects. The lack of information from the local government regarding the projects details and timeframes creates uncertainty for people living in the areas concerned by the future works, whose fate lies in the balance (encroachment of new rights of way on their property or relocation).
Regarding the changes observed in recent years, the inhabitants surveyed cited (20 times out of 33) above all value the road restructuring works (elevation of the roadway as a mitigation measure against flooding, asphalting of dirt tracks, widening of main roads: see Figure 4). The municipality’s action is indeed highly visible and, according to respondents, has had positive impacts not only on mobility but also on trade and tourism. Respondents also note general improvements in access to electricity (5 responses) and running water (4 responses), making for, in the words of one respondent, “an overall improvement in living standards”. While safety was a recurring topic in the responses, six people felt the latter has been improved through nighttime lighting and greater police presence. Two others felt the increase in tourism in Chau Doc was to blame for the increasing incivility (theft, conflicts, etc.). Finally, the environment was a key concern for 12 of those interviewed: although four felt the environment had improved in recent years, eight were alarmed by the increasing pollution of the canals and river, and the number of trees cut down as a result of the road works without replantation. It is interesting to note that those who mentioned pollution were residents of either the historical center (some lived above or facing the canals) or the rapidly developing intermediate zone (where the agricultural land is quickly becoming urbanized).
According to those interviewed, Chau Doc’s priority issue is twofold: improving the city’s health and strengthening and diversifying its economic potential. Seven stressed the lack of drainage, 15 focused on the need to revitalize economic activities (five of whom mentioned tourism and making the city more attractive by expanding the tourist offering) and 10 emphasized the importance of diversifying economic activities (especially border trade) to keep the labor force from migrating to larger cities.
8. Chau Doc and Sustainable Development Indicators
Klopp and Petretta (2017) report that, in 2015, the United Nations defined 14 urban indicators that include areas as diverse as the preservation of built and cultural heritage, slum rehabilitation, and citizen participation in urban planning processes, among others. Yet, there is still no consensus with regard to the methodology to be applied. This, again, reflects the complexity of translating the objectives of sustainable development into action and programs adapted to cities and their populations. The authors add that these indicators should be adapted to each local context and serve as a guiding tool, without acting as an additional constraint. This is especially true in many cities where the data needed to inform these indicators is lacking.
What might seem like an insurmountable task can just as easily be taken as an opportunity to encourage urban governments and populations to consider what data are essential for planning an (economically) sustainable and (socially) inclusive city that respects its environment through a coherent organization of its territory.
Ways to better determine useful indicators for monitoring the city’s evolution can be explored based on the interviews and surveys conducted in Chau Doc.
A clearer vision must be forged of the major economic issues surrounding the two priority sectors: agriculture and tourism. The growth in the latter sector will inevitably have an impact on land use in terms of housing and infrastructure. This is reflected in two ways. Indeed, with 7 million annual visitors including 300,000 foreigners, multidimensional organization is key, be it in terms of accommodation, transportation, traffic routes or services required by periodic visitors. This increase in tourism moreover attracts a workforce. Hence, Chau Doc’s working population is also growing due to a whole set of basic needs to be met (housing, health and education, among others).
A second area to investigate—and for which indicators will be useful—is infrastructure itself. An assessment will be made of the quantitative and qualitative plans, given that the “sanitation” sector is lacking. An inspection of social access to basic infrastructure, which should confirm the viability of the resident population’s socio-economic level, will also be conducted. However, this only makes sense if the sources of water contamination and possible solutions are also taken into account, as well as the factors that contribute to flooding, its social and economic impact on inhabitants, and the means to remedy them more generally.
With Chau Doc’s ever-increasing population, housing is also a concern. Field surveys were conducted in three different neighborhoods. A more systematic census of homes and their spatial location will help in determining the various forms of residential appropriation and potential material and environmental improvements to be made. It will also identify the best habitat areas for future constructions, in order to take into account territorial and environmental constraints.
Tallying the initial information we collected, be it Chau Doc’s demographic growth and spatial extension, economic changes and the rise of tourism, or the recognized lack of infrastructure (sanitation, waste management, traffic routes and transportation modes), one might conclude that indicators will also be needed to measure the environmental impact of Chau Doc’s urban transformation. The city borders the river where some inhabitants still live traditionally; others do business in the floating market. Yet we know that rivers often serve as dumps for garbage, industrial waste and even human excretion. Hence, the risk of contamination and diseases is high. The issues of water and solid waste treatment must be examined for, as we have seen, the future solid waste incineration plant will not suffice for the city’s needs. Moreover, it would seem that no water treatment plant has been provided for in the current investments.
These first indicators to build around these five urban fields—economy, demography, infrastructure, habitat and environment—are not exhaustive; others must be added to the list based on priorities determined by the government and by the fundamental principles that guide sustainable urban development, which are necessary for ensuring the city and region’s future (Photo 3).
9. Conclusions and Recommendations: Towards Local Indicators for Intermediate Cities in Vietnam
Implementing such an approach in Chau Doc would be a pioneering initiative for a city of this size in Vietnam, in a favorable national context.
Since March 2019, the General Statistics Office (GSO) of Vietnam has launched a set of statistical indicators specifically designed to measure the country’s progress in terms of sustainable development. This impressive set of 158 indicators should provide tailored measurement tools for monitoring the indicators (Vietnamese Sustainability Development Goals—VSDGs) set out in the country’s various sectoral plans. For the moment, the only institutional reference at the local level is a set of local indicators established in 2013, as mentioned above (Vietnam Prime Minister, 2013). According to this grid, the valid indicators for the region—the Mekong Delta—of which Chau Doc is a part are:
• Area of urban greenery per capita (m2/population)
• Ratio of days on which the air pollution concentration exceeds Vietnamese standards per year
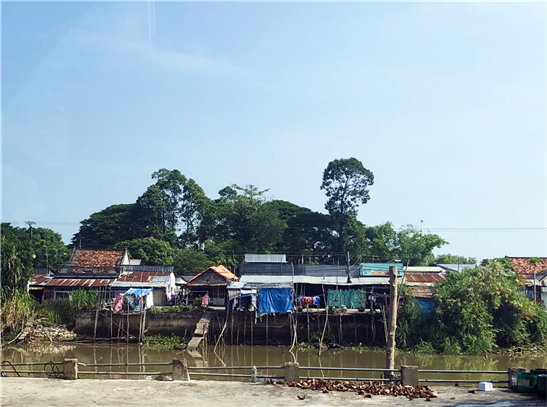
Photo 3. Precarious housing in Chau Doc (Source: Photo by J.-C. Bolay, 2018).
• Indicators specific to the Delta regions
• Ratio of annual crop area is irrigated
• Ratio of protected wetland and biodiversity land areas
While these indicators point to major challenges for Chau Doc in the future, e.g. agriculture and the Delta region’s environmental balance, they largely fail to take into account urban issues and the specific local issues of the municipal territory.
It is therefore an entire protocol for the development of local SDI that must be implemented in Chau Doc, as in other intermediate cities of this kind. Further researches ought to support the public authorities of the province of An Giang and the town of Chau Doc in order to define identifiable indicators in the field and through existing statistical data. This would facilitate decision making processes regarding future urban management.
This would be an innovative approach in the Vietnamese context, but is nonetheless founded on solid theoretical underpinnings and international practices, both scientific and technical carried by municipalities.
Certain preliminary criteria (partially adapted from Tanguay et al., 2010) could be included in this approach:
1) Local (municipal) SDI have to be coherent with existing SDIs at the national and regional levels, by detailing predetermined priority phenomena, but also supplementing them by focusing on little analyzed phenomena, such as the impact of urbanization and tourism on the Delta’s ecological systems;
2) They must take into account the pioneering nature of the experiment, i.e. spend the time necessary for their development and document the method used to construct the indicators to reproduce the experiment in other cities in Vietnam;
3) The indicators have to take into account the availability of city-wide data, but more importantly the city’s actual capacity to produce new data: it is a question of simplifying and limiting the number of indicators while building indicators robust enough to capture complex phenomena (the multisectoral impacts of tourism, for example);
4) A balance has also be found between indicators that document the specific nature of the challenges Chau Doc faces, but can be partially adapted and transposed to similar cities in the Delta or the country for comparison purposes in the future;
5) Finally, the indicators will support local action plans aimed at sustainable development in Chau Doc, so that the efforts made to build these indicators serve public policy (monitoring, transparency, accountability), as they are not especially useful in and of themselves.
Taking into account the attention the Vietnamese Government pays to sustainability issues and aware of the urban changes Vietnam is undergoing, the implementation of urban planning based on Local Sustainable Development Indicators (SDI) would be a pioneering work. Implemented in a city like Chau Doc and monitored technically and socially by university researchers specializing in urban issues, such an experience can serve as a pilot study for other small and medium-sized cities in the Mekong Delta region and other provinces. It will thus serve as a model that can be applied to other municipalities, taking into account their local and regional dynamics, and that is open to interactions between populations, businesses and public administrations. The indicators, which will be sensitive to questions of urban intermediation and based on verifiable data, will serve as a basis for urban planning not only at the national level and in large Vietnamese cities, but also in the hundreds of small and medium-sized towns that make up the country’s urban network. This first experiment between Vietnamese geographers from the University of Social Sciences and Humanities of HCMC and the urban researchers of the CODEV EPFL in Switzerland has highlighted the interest of local and regional authorities. It also makes relevant the information that can be collected from the inhabitants. It is strongly recommended that Vietnamese scientists continue this work in an official collaboration with the City of Chau Doc and by associating the neighborhood committees in the field studies. It will be immediately usefull for the local authorities. At the same time, this will expand the knowledge to be acquired on intermediate cities in Vietnam through such an innovative approach.
Acknowledgements
Our sincere thanks go to our fantastic translator Ms Jessica Strelec and to the public authorities of the city of Chau Doc and of the An Giang province, as to the dwellers of Chau Doc who accepted to take part in our survey.
NOTES
1https://www.indexmundi.com/facts/vietnam/indicator/SP.URB.TOTL.IN.ZS.
2All this statistical data comes from the site: https://www.macrotrends.net/countries/VNM/vietnam/population.
3https://www.worldometers.info/world-population/vietnam-population/.
4http://worldpopulationreview.com/world-cities/ho-chi-minh-city-population/.
5https://www.worldscapitalcities.com/capital-facts-for-hanoi-vietnam/.
6https://populationstat.com/vietnam/ha-noi.
7https://populationof2019.com/population-of-hanoi-2019.html.
8https://populationstat.com/vietnam/ho-chi-minh-city.
9https://www.indexmundi.com/vietnam/demographics_profile.html.
10https://www.citypopulation.de/en/vietnam/cities/.
11https://en.wikipedia.org/wiki/Ho_Chi_Minh_City.
12https://www.populationdata.net/pays/viet-nam/.
13https://www.populationdata.net/pays/viet-nam/.
14In Vietnamese, doi moi means “renewal” and is the name of the economic reform started by Vietnam from 1986.
15https://www.vietnam-briefing.com/news/vietnams-key-regions-economic-zones-new-issue-vietnam-briefing-magazine.html/.
16http://www5.worldbank.org/mapvietnam/.
17https://fr.wikipedia.org/wiki/Delta_du_Mékong_(région) + https://fr.wikipedia.org/wiki/Province_d’An_Giang.
18http://english.angiang.gov.vn/wps/portal/.
19https://www.landportal.org/fr/library/resources/lex-faoc167648/decision-no-245qd-ttg-approving-master-plan-socio-economic.