The Endocannabinoid, Anandamide, Induces Cannabinoid Receptor-Independent Cell Death in Renal Proximal Tubule Cells ()
1. Introduction
Endocannabinoids (ECs) are endogenous lipids that have been gaining more interest during the last years as the exogenous equivalent is known as Δ9-THC (Δ9-tetrahydrocannabinol), the active psychotropic natural product of Cannabis [1] .
The EC system is extensively studied in immune system function and the central nervous system, as it is involved in memory processing, regulation of pain, neuroprotection, addiction and appetite [2] [3] [4] . In peripheral organs like the liver, the endocannabinoid system contributes to cell death mechanisms that involve cyclooxygenase 2 (COX2) [5] , as well as hepatic injury and fibrogenesis [6] [7] . The EC anandamide (AEA) can reach an intracellular level of up to 50 µM upon proinflammatory activation of cells [8] [9] .
In renal tissue, the EC system has gained more interest during the last years and a role for the cannabinoid receptor 1 (CB1) in pathogenesis of interstitial fibrosis has been proposed, while the cannabinoid receptor 2 (CB2) has been regarded as protective in chronic renal disease [10] [11] . Ritter and colleagues proposed in 2016 the necessity of further studies to define and exploit the role of the EC system in the kidney [12] . In this study, we considered renal disease models resulting in cell loss, like nephritis or ischemic damage during kidney transplantation as well as a renal cell carcinoma (RCC). Understanding those mechanisms resulting in cell loss and the possible involvement of the EC system is an important step towards understanding disease entities.
For a long time, apoptosis or necrosis were the only forms of cell death known. Currently, processes not classified as apoptosis or necrosis are referred to as regulated necrosis [13] . The identification of several other pathways leading to cell death, besides apoptosis and necrosis, has evolved during the last decade and is still growing. The recently identified cell death pathways in renal tissue are apoptosis, necroptosis and ferroptosis [14] [15] [16] .
Apoptosis is cell death mainly regulated via caspases that determine cellular fate and can be subdivided into an intrinsic (regulated via cellular stress stimuli) and extrinsic pathway (mediated via death receptors like fatty acid synthase receptor (FasR), tumor necrosis factor receptor (TNFR) or TNF related apoptosis inducing ligand-receptor (Trail-R)) [17] . zVAD (z-Val-Ala-Asp-(OMe)-Fluoromethyl Ketone) is a selective caspase inhibitor and, therefore, used to block apoptotic cell death.
Necroptosis is mediated by serine-threonine kinase receptor-interacting protein 1 (RIP1) and RIP3. RIP1 can selectively be blocked by necrostatin-1 (Nec-1) [18] [19] .
Ferroptosis is associated with: ROS accumulation, activation of mitogen activated protein kinases (MAPK), release of arachidonic acid metabolites, glutathione (GSH) dependence as well as small mitochondria [20] , and can be blocked by Ferrostatin-1 (Fer-1) through the reduction of lipid oxidation [15] .
Hepatic cell death upon anandamide (AEA) treatment has been shown to be cannabinoid receptor-independent, as G protein-coupled receptors CB1, CB2 and transient receptor potential vanilloid receptor 1 (TRPV1) are not involved [21] .
In this manuscript, we identify the effect of the endocannabinoid AEA upon renal proximal tubule cells.
2. Materials and Methods
2.1. Cell Culture and Treatment
Caki-1 cells (Caki-1) were kindly provided by Prof. Dr. Grünewald and were cultured in DMEM (Invitrogen, Darmstadt, Germany) supplemented with 10% FCS (PAN Laboratories, Aidenbach, Germany) and 1% Penicillin/Streptomycin (Invitrogen). Primary renal proximal tubule epithelial cells (RPTEC; Lonza, Basel, Switzerland) were cultured in REBM (Lonza) at 37˚C and 5% CO2. For all experiments, cells were grown to a confluency of 80% and serum-starved prior to the experiment. Cells were treated with AEA (Cayman Chemicals, Ann Arbor, USA) or vehicle (ethanol; 0.1% final concentration). Where indicated, cells were pretreated with AM251 (CB1 receptor antagonist, 1 µM) from Tocris (Wiesbaden, Germany); SR144528 (CB2 receptor antagonist, 1 µM), Capsazepine (TRPV1 receptor antagonist, 25 µM), Trolox (antioxidant, 100 µM), Necrostatin1 (Nec-1, necroptosis inhibitor, 1 µM), Ferrostatin1 (Fer-1, ferroptosis inhibitor, 60 nM), zVAD (caspase inhibitor, 25 µM), arachidonic acid (25 µM), ethanolamine (25 µM), URB597 (FAAH inhibitor, 10 µM), all from Cayman Chemicals; glutathione reduced ethyl ester (antioxidant, 4 mM), buthionine sulfoximine (GSH depletor, 100 µM), methyl-β-cyclodextrin (membrane cholesterol depletor, 1 mM), ActD (Actinomycin D, 0.4 µg/ml), Tnf alpha (Tumor necrosis factor alpha, 40 ng/ml), TritonX (0.1%); and H2O2 (1 mM), all from Sigma-Aldrich (Deisenhofen, Germany). Cell treatment was based on the manufacturers’ instructions and literature [5] [22] and was tested. Each concentration of inhibitors was adapted according to the cell types used by previously performed dose-response experiments.
2.2. Cell Death Determination
Detection of cell death was performed using the cytotoxicity detection kit (Roche Applied Sciences, Mannheim, Germany) to measure lactate dehydrogenase (LDH) release. 10 µL of cell culture free medium were added to 90 µL of LDH reaction mixture. After an incubation time of 20 minutes in the dark, the assay was measured at 490 nm on a 96 well microtiter plate with the help of an ELISA reader (SPECTROstar Omega, BMG Labtech, Ortenberg, Germany). As a negative control culture medium was used-The negative control was acquired by adding 1 µl TritonX to the cells, thereby, causing cell death and subsequent rupture of cellular membranes, therefore representing the 100% LDH release control.
2.3. Experimental Kidney Transplantation
Allogeneic renal transplantation was performed in male Dark Agouti (DA (RT1av1)) to Lewis (LEW (RT1l)) rat strain combination at an age of about 2 month, while transplants between Lewis rats (isotransplantation) and non-transplanted Lewis rats served as control [23] . Recipients of isografts were sacrificed 10 days after transplantation; recipients of allografts were sacrificed 6 to 8 days after transplantation. Kidneys were removed and snap-frozen followed by HPLC-MS/MS analysis. Range of morphological alterations in allo- and isotransplanted kidneys were equivalent to those published before [23] .
Animal experiments were approved, according to the German national laws for animal protection, by the local ethics committee (V54-19c20-15(1) GI20/27: 36/2004; 23/2008; 51/2010).
2.4. FACS
APC AnnV and PI staining was performed according to the manufacturers protocol (BD Pharmingen). APC AnnV was detected with a 633 nm FACS filter, whereas PI was detected with a 488 nm FACS filter.
Confluent and treated cells were washed twice with PBS, detached from the cell culture plates and washed again with PBS. The pellet was resuspended in 500 µl of 1× binding buffer. To the stain cells, 3 µl APC AnnV and 5 µl PI supplied staining solution was added and the solution was kept in the dark. As positive control, Jurkat cells were treated with 100 ng/ml alpha-FAS for 4 h to induce apoptosis. The cells were then stained as described above. Flow cytometry was performed by FACSCanto I (Becton Dickinson) and the obtained data was analysed using FlowJo (Tree Star).
2.5. Human Biopsies
Formalin-fixed and paraffinized human renal biopsies were selected from the archives of the Department of Pathology, University Hospital of Cologne, Germany. Histologic evaluation was based on independent analyses by two staff pathologists (J.W.U. Fries and H. Löser) using Haematoxylin-Eosin (H&E)-stained paraffin sections. Since human renal tissue was used, procedures were followed as outlined in accordance with ethical standards formulated in the Helsinki Declaration 1975 (and revised in 1983), or the Declaration of Istanbul (for control transplant biopsies), respectively, with pre-approval by the Ethics Committee at the University Hospital, Cologne (reference number: 09-232). Informed consent forms from each patient or parents of children were obtained.
2.6. Histology
Histology was performed as previously published [24] . Primary antibodies against N-acetylphosphatidylethanolamine-hydrolysing phospholipase D (NAPE-PLD, AEA formation enzyme, Sigma-Aldrich) and fatty acid amide hydrolase (FAAH, AEA degradation enzyme, Cayman Chemicals) were used and evaluated using a Leica DM IL (Leica, Wetzlar, Germany).
2.7. Liquid Chromatography
Liquid chromatography was performed as previously published [25] . Briefly, for LC/MRM analysis of human biopsy samples, 20 µl of the sample were injected and separated in a Phenomenex Luna 2.5 µm C18(2)-HST column and a pre-column (C18, 4 × 2 mm2). The separated samples were analysed using MRM with a 5500 QTrap triple-quadrupole linear ion trap mass spectrometer with a Turbo V Ion Source (AB SCIEX). Precursor and product ion m/z transitions were used for the detection of AA, AEA and 2-AG respectively as 303 > 311, 348.3 > 62.3, 379.1 > 287.2.
For HPLC-MS/MS analysis of experimental kidney transplantation in rat samples, 10 µl of the sample were injected and separated in a ACE 3 C8, 100 × 2.1 mm, 3 µm with guard column. The MS system used was a triple quadrupole ion-trap 4000 QTRAP mass-spectrometer (Applied Biosystems) equipped with Turbo Spray ionisation interface.
Precursor and product ion m/z transitions were used for the detection of OEA, PEA, AEA and 2-AG respectively as 326.30 > 62.10, 300.10 > 62.10, 348.1 > 62.10, 379.10 > 287.50.
The methods were chosen according to the expertise of the participating researchers AEA and 2-AG present comparable precursor and product ion m/z transitions (LC/MRM by LB, BL; HPLC-MS/MS by DAB, SS, CAO).
2.8. Reactive Oxygen Species (ROS)
Detection of ROS was performed as previously described [26] . 5-(and-6)-Chloromethyl-2‘,7‘-Dichlorodihydrofluorescein Diacetate, Acetyl Ester (CM-H2DCFDA; ThermoFisher Scientific, Darmstadt, Germany) was loaded and ROS formation measured using excitation and emission filters of 485nm and 535nm (Leica DM IL, Leica, Wetzlar, Germany), respectively.
2.9. RT-PCR and Quantitative Real-Time PCR (qRT-PCR)
RT-PCR and qRT-PCR were performed as previously published [27] [28] . qRT-PCR was evaluated using the ΔΔ-ct method, as described in User Bulletin 2 (PE Applied Biosystems, Darmstadt, Germany). H2O was used as negative control. Primers were obtained by Invitrogen for β-actin (forward: TTGGCAATGAGCGGTTCCGCTG, reverse: GACAGCACTGTGTTGGCGTA), CB1 (forward: CATCACCACTGACCTCCTGT, reverse: TTGTCTCCCGCAGTCATCTT), CB2 (forward: CTGCGCTATCCACCTTCCTA, reverse: CGGAAAAGAGGAAGGCGATG), TRPV1 (forward: CGCTGATTGAAGACGGGAAG, reverse: GCATGTTGAGCAGGAGGATG), FAAH (forward: CTGCTCTGGACTTGAATGCC, reverse: CCCCAAAGTAGCCCCTGTAA-3’). PCR was performed with a number of 40 cycles, starting with a denaturation temperature of 95˚C for 15 seconds, an annealing temperature of 55˚C for 1 minute followed by an elongation temperature of 72˚C for 30 seconds. A final extension step for 10 minutes at 72˚C was chosen before cooling to 4˚C.
2.10. Western Blot
Western blot analysis was performed as previously described [29] . Briefly, 20 µg protein determined with Bradford (Sigma-Aldrich, Deisenhofen, Germany) per sample were loaded into a 10% polyacrylamide gel. Following gel electrophoresis, the gel was blotted onto a nitrocellulose membrane and blocked in 3% TBS-T milk. Antibodies against CB1, CB2, TRPV1 (Biorbyt, Cambride, UK) and PARP, cleaved caspases 3 and β-actin (Cell Signalling, Danvers, USA) were used in a dilution of 1:1000. All antibodies were tested for specificity with peptides corresponding to the peptide sequences used for immunization (Santa Cruz Biotechnology, Santa Cruz, CA). HRP-labeled secondary antibodies were used in a concentration of 1:10.000.
2.11. Statistical Analysis
All data represents the mean of three independent experiments. Densitometric analysis was performed with the ImageJ program, according to the manufacturer’s protocols, to quantify Western blots. GraphPrism 5 (GraphPad Software, La Jolla, Calif., USA) was used to calculate statistical significances with the Student’s unpaired t-test (*p < 0.05, **p < 0.01, ***p < 0.001).
3. Results
3.1. AEA Mediates Cell Death in RPTEC and Caki-1 in a Dose Dependent Manner
It is known that AEA can induce cell death in hepatic stellate cells [21] . LC/MRM measurements of human renal biopsies and HPLC-MS/MS analyses in experimental rat renal allografts and isografts (Suppl. Figure 2) revealed the presence of AEA and 2-AG in renal tissue. This is a crucial method to introduce further research in the field of EC signaling within renal tissue. Nevertheless, these analyses only represent the physiological levels of EC within the tissue, while a pathological EC increase is not within the determination.
To further support the observation of an expression of EC signaling by liquid chromatography, the effect of AEA within the renal cell lines Caki-1 and RPTEC was considered. Treatment with different concentrations of AEA over time show rapid and dose-dependent induction of LDH release in Caki-1 and RPTEC (Figures 1(a)-(d)). Additionally, degradation products of AEA, ethanolamide
![]()
![]()
Figure 1. Time- and dose-dependent LDH release and morphological changes in RPTEC and Caki-1 after AEA treatment. (a) Caki-1: dose-dependent LDH release after 2 h AEA treatment; (b) Caki-1: dose-dependent LDH release after 4 h AEA treatment; (c) RPTEC: dose-dependent LDH release after 2 h AEA treatment; (d) RPTEC: dose-dependent LDH release after 4 h AEA treatment. As positive control, ActD (0.4 µg/ml) Tnf alpha (40 ng/ml) for 16 h were used and as 100% LDH release control 1 µl TritonX was added to the cells. EtAm and AA were used to control the effect of degradation products of AEA. Vehicle control ethanol (untreated) was used as negative control. Unpaired Student’s t-test against 100% LDH release control was performed and all differenced in values are statistically significant; (e) Untreated Caki-1 with normal morphology; (f) 4 h 70 µM AEA in Caki-1 showing blebbing, detachment of cells and loss of cell-cell contact; (g) Untreated RPTEC with normal morphology; (h) 4 h 70 µM AEA in RPTEC cells showing detachment of cells, round morphology and loss of cell-cell contacts. *=p > 0.5, **=p > 0.05, ***=p > 0.001.
(EtAm) and arachidonic acid (AA) were used for treatment as well to prove that the degradation products of AEA are not toxic to the cells, as it is known from literature that free fatty acids can present a source of cellular toxicity [30] [31] [32] .
RPTEC have a higher sensitivity against AEA-induced cell death as the dose-dependent LDH release is already visible after 2 h of treatment. EtAm as degradation product of AEA, as well as ethanol (untreated vehicle control), did not cause any increase in LDH release. We observed an increase in LDH release after treating RPTEC with 25 µM AA up to 30% compared to positive control TritonX. RPTEC, as primary cells, seem to have a higher susceptibility for LDH loss after AA treatment. Compared to AEA treatment, LDH release does not increase over time but stays constant at approximately 30% (data not shown).
To further confirm the findings obtained with LDH release and to represent the findings with another method, time-lapse videos were produced during 4 h of treatment with 70 µM AEA (Figures 1(e)-(h)) in both Caki-1 and RPTEC. The characteristically morphological blebbing of the cells indicates a non-apoptotic type of cell death (Figure 1(f), Figure 1(h)).
LDH release and morphology of Caki-1 and RPTEC led to the conclusion that renal cells undergo cell death upon AEA treatment. As an increase in the concentration of AEA leads to an exponential increase in LDH release, it is not likely that the cell death results from free acid. Additionally, treatment with the degradation products of AEA, namely arachidonic acid and ethanolamide, or ethanol as a vehicle control did not lead to an increase in LDH release above vehicle control levels. An influence upon cell death due to higher free acids or alcohol is not likely to cause increased cell membrane damage.
Since the effect of AEA in the following experiments should result in clear readout of LDH release, the concentration of 70 µM AEA was used for all other experiments as it obtained the best signal-to-noise ratio. The LDH release amounts to approximately 70% and therefore represents an adequate level of cellular leakage. Additionally, higher doses of AEA can be found in proinflammatory processes within organs and are pathologically possible.
3.2. Cannabinoid Receptors in Caki-1 and RPTEC
Cannabinoid receptors are expressed in several peripheral organs at the mRNA and protein levels. Here, cannabinoid receptor mRNA and protein expression were investigated in Caki-1 and RPTEC. PCR results lead to the conclusion that Caki-1 and RPTEC express CB1, CB2 and TRPV1 (Figure 2(b)). qRT-PCR results in Caki-1 and RPTEC underline the results of the PCR analysis. There is transcription of the most common cannabinoid receptors CB1, CB2 and TRPV1 (Figure 2(a)).
Western blot analysis revealed that Caki-1 express CB2 irrespective of the treatment with 70 µM AEA for 4 h. An increase in TRPV1 protein was observed after AEA treatment. There is no protein for CB1 detectable (Figure 2(c), Figure 2(d)). TRPV1 protein is not found in RPTEC. After treatment with 70 µM
![]()
Figure 2. Western blot and qRT-PCR analysis of RPTEC and Caki-1 treated with 70 µM AEA for 4 h. (a) qRT-PCR of CB1, CB2, TRPV1, β-actin as control in RPTEC and Caki-1. Vehicle control ethanol (untreated) was used as negative control. There is a significant decrease in CB1 receptor expression in RPTEC, whereas CB2 expression is significantly increased. No significant expression difference of TRPV1; (b) RT-PCR product of CB1 (product size 156 bp), CB2 (product size 208 bp), TRPV1 (product size 246 bp), β-actin control (product size 133 bp) in RPTEC and Caki-1; (c) Densitometry of Western blots of Caki-1 with a significant increase of CB2 and TRPV1 treated with 70 µM AEA; (d) Western blot of CB1 (55 kDa), CB2 (47 kDa), TRPV1 (80 kDa), and β-actin (46 kDa) as control in Caki-1. CB1 is marginally transcribed in Caki-1; (e) Densitometry of Western blots of RPTEC with significant increase of CB1 and CB2 after 4 h treatment with 70 µM AEA. All values under the 100% control of β-actin are not considered for evaluation; (f) Western blot of CB1, CB2, TRPV1, β-actin as control in RPTEC. TRPV1 is not transcribed in RPTECs and CB1 cannot be found in untreated RPTEC. *=p > 0.5, **=p > 0.05, ***=p > 0.001.
for 4 h, CB1 protein expression increases as compared to untreated RPTEC. CB2 protein is detectable in treated and untreated cells. (Figure 2(e), Figure 2(f)).
3.3. AEA-Induced Cell Death in Caki-1 and RPTEC Is Not Mediated via Cannabinoid Receptors or FAAH
As cannabinoid receptors are expressed by Caki-1 and RPTEC, the dependence of LDH release and cell death was analyzed by selectively blocking: CB1 with AM251, CB2 with SR144528, TRPV1 by capsazepine and the AEA degradation enzyme fatty acid amide hydrolase (FAAH) by URB597 (Figure 3(a), Figure 3(b)).
LDH release is significantly increased in cells pretreated with the CB1 blocker (AM251) or the CB2 blocker (SR144528) and followed by subsequent AEA treatment in Caki-1 cells. Blocking of TRPV1 (capsazepine) and FAAH (URB597) did not change the LDH release as compared to AEA treatment alone (Figure 3(a)). LDH release in RPTEC is not altered when CB1 is blocked by AEA treat-
![]()
Figure 3. LDH release by Caki-1 and RPTEC after blocking of cannabinoid receptors, FAAH and block of apoptosis, necroptosis and ferroptosis. (a) LDH release of Caki-1 after blocking with URB597 (FAAH receptor block, 10 µM, 1 h), Cap (capsazepine, 25 µM, 1 h, TRPV1 antagonist), SR (SR144528, 1 µM, 1 h, CB2 antagonist), AM251 (1 µM, 1 h, CB1 antagonist); (b) LDH release by RPTEC after blocking with URB597 (FAAH receptor block, 10 µM, 1 h), Cap (capsazepine, 25 µM, 1 h, TRPV1 antagonist), SR (SR144528, 1 µM, 1 h, CB2 antagonist), AM251 (1 µM, 1 h, CB1 antagonist); (c) LDH release by RPTEC after block of apoptosis (25 µM, 1 h, zVAD), necrosis (1 µM, 1 h, Nec) and ferroptosis (60 nM, 1 h, Fer), followed by 4 h 70 µM AEA treatment. For 100% LDH release as control 1 µl TritonX was added to the cells. Positive control using ActD and Tnf alpha, 100% LDH release as control 1 µl TritonX was added to the cells. Vehicle control ethanol (untreated) was used as negative control. *=p > 0.5, **=p > 0.05, ***=p > 0.001.
ment. The application of inhibitors of CB2, TRPV1, and FAAH after AEA treatment leads to a significant increase in LDH release (Figure 3(b)). AEA-induced cell death seems to be independent of the known cannabinoid receptors and FAAH. It is possible that the increase in LDH release and therefore the cell death induced by the inhibitors alone can be explained by the protective functions of cannabinoid receptors and by the role of FAAH in the metabolism of arachidonic acid.
3.4. AEA-Induced Cell Death Depends on ROS but Not on Membrane Cholesterol
As cannabinoid receptors and FAAH do not participate in cell death processes in Caki-1 or RPTEC, the underlying cause of cell death was investigated. As cell death is often related with an increase of ROS or membrane cholesterol, both systems were modified with membrane cholesterol depletor (MCD), antioxidants (GSH-EE, Trolox), or GSH depletor (BSO). Afterwards, the LDH release was analyzed (Figure 4(a), Figure 4(b)).
Upon single treatment with MCD, Trolox and BSO, Caki-1 and RPTEC show LDH release comparable to untreated cells. Treating Caki-1 with MCD, Trolox or GSH-EE together with 70 µM AEA for 4 h resulted in a significant increase of LDH release. The LDH release of Caki-1 treated with BSO and AEA versus RPTEC treated with MCD and AEA were not significantly different in comparison with AEA treated cells alone (Figure 4(a)).
LDH release by RPTEC after GSH-EE treatment is slightly increased to approximately 37%. Pretreatment of RPTEC with GSH-EE or BSO and AEA over 4 h lead to a significant increase of LDH release. Treating RPTEC with Trolox and 70 µM AEA for 4 h significantly reduced the LDH release towards the control level of LDH release found in untreated RPTEC (Figure 4(b)).
To verify these results, we used H2DCFDA, a well-known method to visualize ROS formation within the cytoplasm by fluorescence microscopy. We performed H2DCFDA in RPTEC (Figure 4(c), Figure 5). Results show that there is a significant increase of H2DCFDA signal after treatment of RPTEC with Trolox and 70 µM AEA over 4 h (Figure 4(c)). Additionally, the H2DCFDA signal significantly decreases after treatment with BSO and 70 µM AEA over 4 h, which reflects the results of LDH release. Pretreatment with GSH-EE in RPTEC did not lead to any significant changes of the H2DCFDA signal.
3.5. AEA-Induced Cell Death in RPTEC Cannot Be Blocked by Common Cell Death Inhibitors
To characterize the dominant type of cell death in RPTEC, apoptosis was blocked by zVAD, whereas necroptotic cell death was prevented by Necrostatin-1 (Nec-1) and ferroptosis by Ferrostatin-1 (Fer-1) (Figure 3(c)). Blocking of three known cell death pathways by zVAD, Nec-1, and Fer-1 did not lead to a significant reduction of the LDH release in RPTECs. Using a combination of all
![]()
![]()
![]()
Figure 4. LDH release by Caki-1 and RPTEC after blocking of ROS and H2DCFA positivity in RPTEC. (a) LDH release by Caki-1 after GSH-EE (4 mM, 1 h, antioxidant) MCD (1 mM, 1 h, membrane cholesterol depletor), Trolox (100 µM, 1 h, antioxidant), BSO (100 µM, 1 h, GSH depletor), followed by 4 h 70 µM AEA treatment displaying a significant increase of LDH release after MCD, Trolox and GSH-EE treatment. 100% LDH release as control 1 µl TritonX was added to the cells; (b) LDH release by RPTEC after GSH-EE (4 mM, 1 h, antioxidant) MCD (1 mM, 1h, membrane cholesterol depletor), Trolox (100 µM, 1 h, antioxidant), BSO (100 µM, 1 h, GSH depletor), followed by 4 h 70 µM AEA treatment. GSH-EE and BSO pretreatment followed by 4 h AEA leads to a significant increase in LDH release whereas pretreatment with Trolox and subsequent 4 h AEA treatment lead to a highly significant decrease of LDH release in RPTEC. For 100% LDH release as control 1 µl TritonX was added to the cells. Positive control using ActD and Tnf alpha, 100% LDH release as control 1 µl TritonX was added to the cells. Vehicle control ethanol (untreated) was used as negative control; (c) Cytoplasmic H2DCFDA positivity in RPTEC with a significant increase in H2DCFDA positivity of cells treated with MCD and Trolox together with 70 µM AEA compared to 70 µM AEA alone and significant decrease of H2DCFDA positivity after BSO pretreatment with subsequent treatment of 70 µM AEA. Vehicle control ethanol (untreated) was used as negative control. *=p > 0.5, **=p > 0.05, ***=p > 0.001.
![]()
Figure 5. Phase contrast, fluorescence cytoplasmic H2DCFDA and nuclear counterstain with DAPI in RPTECs upon 4 h 70 µM AEA treatment with prior block with MCD ( mM, 1 h), BSO (100 µM, 1 h), GSH-EE (4 mM, 1 h) and Trolox (100 µM, 1 h). There is a reduction in cell amount after 4 h 70 µM AEA treatment. Pretreatment with BSO and subsequent AEA treatment lead to a decrease in H2DCFDA positivity as compared to AEA alone, whereas Trolox and MCD before AEA treatment leads to an increase in H2DCFDA positivity. Vehicle control ethanol (untreated) was used as negative control.
three compounds with an addition of AEA, resulted in a significant increase of LDH.
A combination of components from different cell death pathways seems to be most likely. Despite the missing decrease of LDH release after blocking cell death pathways, we suggest a ferroptotic component of cell death due to a combination of morphological changes, decrease of LDH release after Trolox treatment and increase of H2DCFDA after Trolox pretreatment.
3.6. Acute Renal Injury in Humans
The endocannabinoid system is a complex metabolic system and the degradation of lipids, like AEA, is strictly regulated. Therefore, it is important to determine the enzyme production of both synthesis and degradation by NAPE-PLD and FAAH in the processing of AEA.
It is difficult to extrapolate systemic physiological effects of ECs by cell culture studies. To analyze the potential pathological importance of this system in diseases with acute renal injury, these two enzymes were studied in two different renal disease entities. Using human renal biopsies, control kidneys (Suppl.Figure 1(a)-(e)
4. Discussion
This study newly describes the effect of increased levels of the endocannabinoid AEA upon renal proximal tubule cells during proinflammatory processes. Caki-1 and RPTEC were chosen for two reasons: i) as cell culture models to represent renal proximal tubule cells, and ii) to use primary cells that represent a more physiological representation of renal morphology. The endocannabinoid AEA can be measured under physiological conditions in human and rat renal tissue (Suppl.Figure 2). As the EC system is present in renal proximal tubule cells, pathological increase of AEA during proinflammatory processes is likely. In comparison to other organs, like the liver, kidney cells represent a vast variety of different cell types therefore representing one of the most complex organs in mammals. A homogenous culture model has the advantage of representing one cell type without an effect of dilution due to the different cell regulatory mechanisms of numerous cell types. Additionally, it is possible to vary cell culture treatments in different concentrations (like the one used in vitro concentration of AEA) to ensure an optimal signal-to-noise ratio without fearing an increased systemic effect on the respective treatments.
Compared to hepatic stellate cells, in which AEA induces necrosis [21] , renal cells undergo cell death via another, more complex mechanism. This cell death is dose-dependent and morphologically defined by cell blebbing, which is highly characteristic for non-apoptotic cell death. In contrast, cell budding is a characteristic feature of apoptotic cell death [17] . AnnexinV and propidium iodide staining and subsequent FACS analyses of RPTEC and Caki-1 did not lead to any results (data not shown). Despite several experimental repetitions and a functional positive control for Annexin V and propidium iodide (Jurkat cells treated with alpha-FAS), cell debris and cell fragments were detectable as soon as 2 hours after treatment. These findings of cell debris and cell fragments within the FACS analyses were approved by time-lapse observations and LDH release of RPTEC and Caki-1 cells. Cell blebbing already began within 2 hours after treatment.
Cell blebbing is a feature of non-apoptotic cell death. The influence of Trolox within the cell and the opposite effects of GSH-EE and BSO, respectively, on LDH release and rapid ROS formation is an additional aspect pointing towards ferroptotic cell death [33] .
As seen in Figure 4, Trolox and AEA treated RPTEC show a decrease in LDH release but an increase in H2DCFDA as compared to AEA treatment alone. According to literature in previous studies in hepatic stellate cells and AEA [21] , we should expect a decrease in both LDH release and H2DCFDA after treatment of Trolox and AEA. Nevertheless, there seems to be some compensatory effect. Even though ROS increases after Trolox and AEA treatment, LDH leakage significantly decreases. Caki-1 cells, as a cell line with RCC background, show a different behavior towards ROS modulation. There is no significant decrease in LDH release measureable after treatment of BSO; GSH-EE or Trolox together with AEA. Caki-1 cells seem to be more adept to deal with cellular stress presented by ROS.
To further extend our understanding of the potential the role of this system in acute renal injury, we analyzed the expression level of NAPE-PLD and FAAH in two renal disease entities (Suppl.Figure 1). Surprisingly, we did not find any significant changes between the control tissues and the diseased kidneys despite inflammatory alterations in interstitial nephritis or immunologic destruction of proximal tubuli in rat renal transplants, which is in contrast to the aforementioned findings after toxic [15] or metabolic [34] tubular injury.
Martin-Sanchez and colleagues verify ferroptosis as the dominant cell death mechanism in acute kidney injury [15] . Acute injury occurring in diabetic nephropathy with subsequent tubular inflammation can lead to a local upregulation of the endocannabinoid system [34] . According to the acquired results, our data show a non-apoptotic type of cell death which cannot completely be characterized with the help of the methods utilized. The absence of LDH reduction after blocking LDH release with common cell death blockers against apoptosis, necroptosis, and ferroptosis does not necessarily lead to rejection of the evidence towards the analyzed cell death mechanisms. This could be due to the fact that the process of, for example, ferroptotic cell death might be regulated downstream of the effect of Fer-1 [33] .
AEA induces cell death in a dose- and time-dependent manner in renal proximal tubule cells. An effect in vitro can be measured at concentrations above 25 µM. Select 70 µM AEA with an LDH release of 70% is especially important in experimental setups modifying ROS or blocking cell death receptors. As the baseline LDH release is on average at 12% (which is expected for adherent growing cells) selecting AEA levels resulting in an LDH release in between positive and negative control and biological levels of AEA are increased in proinflammatory processes. This effect is not mediated via cannabinoid receptors, FAAH or membrane cholesterol but is mediated via ROS. AEA-induced cell death leads to a blebbing of cells and additionally to ROS activation, so that ferroptotic cell death is most likely. Furthermore, this mechanism is not a general response to acute tubular injury but seems to be activated only in very specific tubular damage such as inflicted by specific toxins or metabolic alterations.
In summary, the endocannabinoid AEA induces cannabinoid receptor- and membrane cholesterol-independent cell death in renal proximal tubule cells via ROS. While AEA can induce cell death, the detailed mechanism behind this process has to be further evaluated in the future using newly developed blockers and methods to differentiate non-apoptotic cell death mechanisms.
Acknowledgements
This project was supported by Koeln Fortune Program/Faculty of Medicine, University of Cologne and excellence cluster initiative supported by University of Cologne and DFG.
Supplementary Figure/Table
Supplementary Table:
List of Abbreviations:
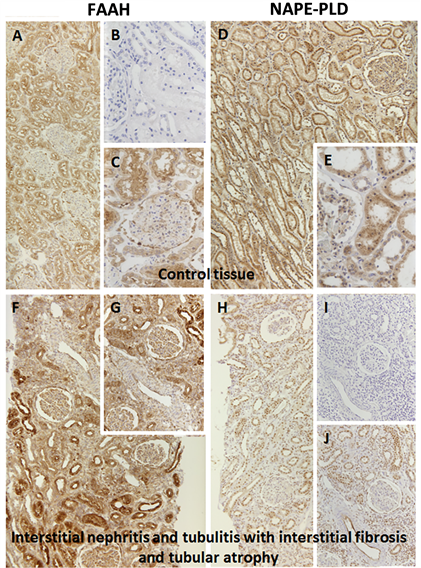
Supplementary Figure 1. Histology of human renal control tissue (a)-(e) and renal tissue with interstitial nephritis and tubulitis with interstitial fibrosis and atrophy (f)-(j) using FAAH and NAPE-PLD. (a) control tissue stained against FAAH 1:50; (b) control tissue negative control; (c) control tissue stained against FAAH 1:50; (d) control tissue stained against NAPE-PLD 1:100; (e) control tissue stained against NAPE-PLD 1:100; (f) interstitial nephritis stained against FAAH 1:50; (g) interstitial nephritis stained against FAAH 1:50; (h) interstitial nephritis stained against NAPE-PLD 1:100; (i) interstitial nephritis negative control; (j) interstitial nephritis stained against NAPE-PLD 1:100.