Understanding the Competitive and Cooperative Interactions between Probiotics and Autochthonous Intestinal Bacteria ()
1. Introduction
Probiotics are live microorganisms which are thought to confer a health benefit on the host, when administered in adequate amounts [1] . For several decades, probiotic bacteria have been studied for their potential beneficial effects upon their host organism [2] [3] [4] . Probiotics are believed to affect the abundance of autochthonous intestinal bacteria by competing with pathogenic bacteria for host binding sites [5] . By reducing the permeability of the intestinal wall, probiotics may protect against the invasion of other bacteria [5] . Other studies have shown that probiotics can reduce the frequency of respiratory infections [6] , prevent a high number of antibiotic-associated diarrhea cases [7] , help maintain remission of inflammatory bowel diseases [5] , may reduce the occurrence of diarrhea and yeast infections in AIDS patients [8] , and significantly reduces high cholesterol levels [9] . Other benefits of probiotics include fewer infections, fewer antibiotics prescribed, and shorter hospital stay [10] .
Given the benefits and harms of probiotics, there is a strong need to unpack the underlying mechanisms governing the interactions between probiotics and intestinal bacteria. Using a mathematical modeling approach, the main objective of the present work is to investigate the effects of probiotics administration on the microbial ecology of the intestine. To achieve this goal, we focus on a group of probiotics with the genus Bifidobacterium. Previous studies suggest that certain dosage of Bifidobacterium may positively influence human health [14] [15] . In particular, while researchers found that a dose of 108 live Bifidobacterium cells helped alleviate many symptoms associated with Irritable Bowel Syndrome, the same team found that 106 live cells and 1010 live cells actually exacerbated the same symptoms [15] . Additionally, a study on severe acute pancreatitis patients found that adding 1010 probiotics (the mixture included but was not limited to Bifidobacterium) to the diet of these patients actually increased their mortality rate [11] . Thus, the effect of supplemental Bifidobacterium upon the host is potentially determined by dose size, but currently there is no clear explanation of why this is.
Patients with Irritable Bowel Syndrome and patients with Infectious Colitis exhibit very similar deviations from gut bacteria homeostasis when compared with healthy patients. Both Clostridium coccoides and Bifidobacterium populations are suppressed in the afflicted patients when compared with healthy subjects [16] [17] . Moreover, the balance between C. coccoides and members of the order Bacteroidales has been observed to be quite different in obese animals when compared with average healthy animals [18] . With this in mind, there seems to be a need to understand the relationship between Bifidobacterium and C. coccoides populations. For, if they compete against one another strongly, then perhaps the ingested Bifidobacterium can overpower the C. coccoides and produce some sort of deleterious effect. Conversely, if they facilitate one another’s populations, then Bifidobacterium supplementation can be seen as likely positive for the maintenance of the C. coccoides intestinal population.
Using a mathematical modeling approach and the collected data, this paper investigates the potential interactions between the Bifidobacterium and C. coccoides species, and we posit that such interactions exist because several studies suggest that bacteria populations within the intestines interact with each other [19] [20] . The goal of probiotic therapy should be to bring bacteria populations back to a homeostatic level [21] , so it is important to know how Bifidobacterium effects C. coccoides. Therefore the practical significance of this study is that mathematical models may ultimately reveal and quantify the possible interrelationships between the intestinal bacterial groups.
In the present work, C. coccoides species was selected because several studies have also used the Erec482, C. coccoides group, in human and animal studies [22] [23] [24] [25] . Also, this group is related to health in dogs [26] and showed high abundance and stability among individual healthy dogs in a paper from our research group [27] , thus making this group a good candidate to be found and quantified.
The rest of this paper is organized as follows. Section 2 provides details of data collection, model construction, model fitting, and analysis of the model. Section 3 provides the main finding of the present work including the possible outcomes of the model and prediction of the interactions between the species both in the presence and absence of probiotics administration. Section 4 provides a discussion of the results and delivers the main conclusions of this study.
2. Method
2.1. Overview
The present study combines the theory and the experimental data to predict the changes on intestinal bacterial populations during ingestion of beneficial probiotic bacteria. The temporal data of C. coccoides and Bifidobacterium species are collected before, during, and after probiotic (i.e., Bifidobacterium species) administration. Using a Lotka-Volterra Modeling approach, a mathematical model of probiotics and intestinal bacteria is constructed. The model is analyzed to determine the conditions for existence and stability of equilibria. The model is also fitted to data to determine the interaction between the species and to provide quantitative estimates of intestinal bacteria in response to probiotic administration.
2.2. Data Collection
A healthy Schnauzer adult dog received 2 tablets (2 times 108 cfu (numbers of bacteria) of Bifidobacterium species) of Prostora® daily for a total of 4 days. During the 10 days of this study, the dog defecated approximately 30 grams of feces per day (~15 grams in the morning and ~15 grams at night). Fecal samples were collected before probiotic administration (Days 0, 1, and 2), during probiotic administration (Days 3, 4, 5, and 6) and after probiotic administration (Days 7, 8, and 9). Total fecal bacteria and two different fecal bacterial groups (i.e., the C. coccoides group and the probiotic group) were quantified in feces using fluorescent in situ hybridization. This technique relies on the bounding of fluorescently-labeled oligonucleotides probes to specific RNA sequences of the bacterial ribosomal RNA. This bounding allows the visualization and quantification of microorganisms by means of fluorescent detection. Figure 1 shows the estimated total number of C. coccoides group, the Bifidobacterium species and all other species. Moreover, Figure 2 shows the average amount of fecal Bifidobacterium and C. coccoides before, during, and after probiotic administration. Note that, high-throughput sequencing is another widely used method to determine the majority of all microbial groups but this technique relies on PCR amplification of genes (i.e. 16SrRNA gene) that have different copy numbers within each genome [28] and possess considerable intra-genomic variation [29] . Therefore, not even high-throughput sequencing can detect all bacteria. In fact, FISH is superior compared to sequencing in terms of true quantification of bacteria.
2.3. The Mathematical Model
Previous mathematical models for probiotic (in this case, Bifidobacterium and Lactobacillus) intervention have found it necessary to include parameters which
![]()
Figure 1. Estimated number of fecal bacteria before (days 0 - 2), during (days 3 - 6), and after (days 7 - 9) probiotic administration.
![]()
Figure 2. Average amount of fecal Probiotics (i.e., Bifidobacterium) and C. coccoides before, during, and after probiotic administration.
express the potential negative effects of probiotics upon the host organism by a degradation of the integrity of the intestinal wall [5] [30] [31] [32] [33] . Consequently, our model followed a similar approach using a Lotka-Volterra modeling approach. Specifically, the mathematical model (a set of ordinary differential equations) allows for cooperative or competitive interactions between the species, and it was employed to simulate the temporal variations of microbial flora due to administration of probiotics. The Lotka-Volterra models have proven to be useful when attempting to unpack the interactions within and between species in various ecological systems (see for example, [34] ). When we assume that dynamics of intestinal bacteria can be expressed by a Lotka-Volterra model of three bacterial groups, then the set of ordinary differential equations is given by:
Before and after During
probiotic administration probiotic administration
 (1)
(1)
where the population growth of species i, carrying capacity of species i and interactions between the species i and j are denoted by  and
and , respectively. Parameters f, h and g relate to the possible interactions between the species during the probiotics administrations. Parameters
  and
and  are the entry and consumption rates of the probiotics during the administration, respectively. Figure 3 is a compartmental diagram representing the mathematical model. Moreover, Table 1 provides a summary of the model variables and the parameters.
2.4. Model Fitting and Stability Analysis
Using direct calculations and a geometric argument, the equilibrium solutions of model (1) were determined both in the presence and absence of probiotics administration. By linearizing model (1) about each equilibrium, the conditions for stability of each equilibrium were determined. The stability of the coexistence equilibrium was numerically verified for different sets of parameter values. Finally, using the Matlab optimization toolbox (the function fminsearch. m), mo- del (1) was fitted to the data and the specific parameter values were determined.
3. Results
3.1. Existence and Stability of Equilibria
Since variables A(t), C(t), and P(t) are bacterial population, we have
 , for all
 , where N(t) >0 is total bacterial population at time t. By focusing on the last two equations of model (1) and substituting
 . The model can be rewritten as:
![]()
Figure 3. A compartmental diagram representing the model of oral probiotic and intes- tinal bacterial groups A, C and P.
![]()
Table 1. Summary of the variables and parameters of the mathematical model.
Note: The parameters indicated in the last two rows are experimental parameters, which are set to zero before and after administration
 (2)
(2)
where
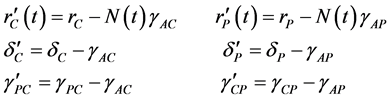 (3)
(3)
Suppose that  can be rewritten
 (4)
(4)
where  is a positive constant and
 .
.
In an unrealistic case, we may consider![]() . Then, as shown in Appendix A, model (2) has up to four equilibria for the cases of before and after probiotics administration (i.e. when
. Then, as shown in Appendix A, model (2) has up to four equilibria for the cases of before and after probiotics administration (i.e. when![]() ). These equilibria are the Extinc-
). These equilibria are the Extinc-
tion![]() , Probiotics-free
, Probiotics-free![]() , C. coccoides-free
, C. coccoides-free
![]() , and the Coexistence equilibrium
, and the Coexistence equilibrium![]() . Details of the li-
. Details of the li-
near stability analysis of these equilibria is given in Appendix A. Table 2 is a summary of the model outcomes and the conditions for stability and existence of the equilibria.
As shown in Appendix B, for![]() , model (2) has up to three equilibria for the case of probiotics administration (i.e. when
, model (2) has up to three equilibria for the case of probiotics administration (i.e. when ![]() and g are nonzero). These equilibria are the C. coccoides-free equilibrium
and g are nonzero). These equilibria are the C. coccoides-free equilibrium ![]() and the Co- existence equilibria
and the Co- existence equilibria ![]() and
and![]() . Details of the linear stability analysis of these equilibria is given in Appendix B. Table 3 is a summary of model outcomes and the conditions for stability and existence of the equilibria.
. Details of the linear stability analysis of these equilibria is given in Appendix B. Table 3 is a summary of model outcomes and the conditions for stability and existence of the equilibria.
When![]() , the number of equilibria is increased and the local stability of the above-mentioned equilibria may change. For small values of
, the number of equilibria is increased and the local stability of the above-mentioned equilibria may change. For small values of![]() , the local stability of the above-mentioned equilibria (i.e.,
, the local stability of the above-mentioned equilibria (i.e.,![]() ) remains the same. This can be verified using perturbation methods. Also the following theorems are used to further investigate the stability of equilibria.
) remains the same. This can be verified using perturbation methods. Also the following theorems are used to further investigate the stability of equilibria.
Theorem 1. Consider the system![]() ,
, ![]() continuous for
continuous for
![]()
Table 2. Possible outcomes of Model (2) for ![]() and in the absence of probiotic administration.
and in the absence of probiotic administration.
Notes: (1)the symbol ~ indicates that one of the following conditions must be violated; (2)depending on the initial conditions, the solution may converge to either equilibrium
![]()
Table 3. Possible outcomes of Model (2) for ![]() and in the presence of probiotic administration.
and in the presence of probiotic administration.
Note: There can be up to two coexistence equilibria, ![]() and
and![]() .
.
![]() with the properties that
with the properties that
1) the eigenvalues λk of A, ![]() have
have![]() , the eigenvalues corresponding with
, the eigenvalues corresponding with ![]() are distinct;
are distinct;
2) ![]() is bounded
is bounded
then the solutions of the system are bounded and ![]() is stable in the sense of Lyapunov stability.
is stable in the sense of Lyapunov stability.
Proof: See ( [35] , pages 71-72).
Theorem 2. Consider the system![]() ,
, ![]() continuous for
continuous for ![]() with
with
1) A is a constant matrix with eigenvalues ![]() and
and![]() ;
;
2) ![]()
then for all solutions of the system, we have ![]() as
as ![]() and
and ![]() Model (2) can be rewritten as
Model (2) can be rewritten as
![]() (5)
(5)
where![]() ,
, ![]() is the vector function of the right hand
is the vector function of the right hand
side of model (2) with ![]() and
and![]() .
.
In system (5), by substituting the linearization ![]() about the equilibrium
about the equilibrium![]() ,
, ![]() , and using the linear transformation
, and using the linear transformation
![]() we get to
we get to
![]()
where ![]()
The general solution of system (6) is of the form![]() , where
, where ![]() is the solution of
is the solution of![]() , and
, and ![]() is a particular solution of the system. Assume that
is a particular solution of the system. Assume that ![]() as
as![]() . Then, under the conditions of theorem 1 (or similarly theorem 2), the equilibrium
remains locally asymptotically stable. Further investigations on the case
. Then, under the conditions of theorem 1 (or similarly theorem 2), the equilibrium
remains locally asymptotically stable. Further investigations on the case ![]() are left for another study and in the next two subsections we numerically study the model for the case
are left for another study and in the next two subsections we numerically study the model for the case![]() .
.
3.2. Numerical Verifications
Figure 4(a) shows a numerical verification of model (2) for before and after pro- biotic administration when parameters are set to values which allow for coexistence. The graph was generated by using Matlab’s ODE45 function to verify that the model allows for coexistence at these parameter values. The specific values used are![]() ,
, ![]() ,
, ![]() ,
, ![]() ,
, ![]() ,
, ![]() , and
, and![]() . All the experimental parameters are set to zero because they are associated with the supplemented probiotics and therefore not involved in the model during times of no probiotic ingestion. Similarly, the coexistence during probiotic administration was verified. As shown in Figure 4(b), a stable spiral was found when
. All the experimental parameters are set to zero because they are associated with the supplemented probiotics and therefore not involved in the model during times of no probiotic ingestion. Similarly, the coexistence during probiotic administration was verified. As shown in Figure 4(b), a stable spiral was found when![]() ,
, ![]() ,
, ![]() ,
,
![]() ,
, ![]() ,
, ![]() ,
, ![]() ,
, ![]() ,
,![]() .
.
![]() (a) (b)
(a) (b)
Figure 4. (a) We used MatlabODE45 to numerically verify the presence of coexistence equilibrium before and after intervention when using the given parameters. The specific parameter values are![]() ,
, ![]() ,
, ![]() ,
, ![]() ,
, ![]() , and
, and![]() . All experimental parameters are set to 0. (b) Similarly, the coexistence during probiotic administration is possible. A stable spiral was found when
. All experimental parameters are set to 0. (b) Similarly, the coexistence during probiotic administration is possible. A stable spiral was found when![]() ,
, ![]() ,
, ![]() ,
, ![]() ,
, ![]() ,
, ![]() ,
, ![]() ,
, ![]() ,
,![]() .
.
![]()
Table 4. Summary of the estimated parameter values for before and after probiotics administration and during the administration.
Notes: The Sum of the Squared Error (SSE) was 27.6153 for before and after probiotics administration and 88.6003 during the administration. The negative value of ![]() is meaningful due to the fact that
is meaningful due to the fact that![]() .
.
3.3. Model Fitting
After running MATLAB’s ODE45 and fminsearch. m, the parameter estimations yielding the lowest error were calculated for two cases of presence and absence of probiotics administration. Figure 5 shows the data and the solution curves of the fitted model. Also, the estimated values are shown in Table 4. The values of g and h are both positive during the probiotics administration, which indicate that Bifidobacterium and C. coccoides are cooperative. On the other hand, from ![]() and
and ![]() we get that the
we get that the ![]() provided
provided
![]() . Also
. Also ![]() since
since ![]() and
and![]() . There- fore, the estimated parameter values suggest that the Bifidobacterium and C. coccoides can be competitive before and after probiotics administration provided
. There- fore, the estimated parameter values suggest that the Bifidobacterium and C. coccoides can be competitive before and after probiotics administration provided![]() . Otherwise (i.e., when
. Otherwise (i.e., when![]() ), the Bifidobacterium may reduce the growth rate of C. coccoides while it benefits from the presence of C. coccoides. Additionally, adding probiotics promotes the growth of both probiotics and C. coccoides, and their population growth curves are synchronized and oscillatory (see Figure 5 for days 3 - 6).
), the Bifidobacterium may reduce the growth rate of C. coccoides while it benefits from the presence of C. coccoides. Additionally, adding probiotics promotes the growth of both probiotics and C. coccoides, and their population growth curves are synchronized and oscillatory (see Figure 5 for days 3 - 6).
![]() (a)
(a)![]() (b)
(b)![]() (c)
(c)
Figure 5. Using the Matlab optimization toolbox, the model was fitted to the data, solid and dashed curves represent the model solutions for days 0 - 9. (a) The model solutions represent three spikes, where the spike during the probiotics administration (days 3 - 6) is the highest; (b) the spikes of C. coccoides are synchronized with those of probiotics. The proportions of C. coccoides and probiotics bacteria indicate that they have a cooperative relationship both during and in the absence of probiotics administration; (c) the proportion of all other bacteria is inversely related to those of probiotics and C. coccoides, which suggests a competitive relationship between all other bacteria and the latter two bacterial groups.
4. Discussion
The main objective of this study was to compare the changes in the parameter values before, after, and during the experiment. The primary parameters of interest are![]() ,
, ![]() ,
, ![]() , and
, and ![]() because they are best for showing the interactions between Bifidobacterium and C. coccoides. The computations indicate that when probiotic is not administered (i.e. during normal homeostasis), Bifidobacterium compete against C. coccoides species and inhibit its population growth because
because they are best for showing the interactions between Bifidobacterium and C. coccoides. The computations indicate that when probiotic is not administered (i.e. during normal homeostasis), Bifidobacterium compete against C. coccoides species and inhibit its population growth because![]() . Alternatively, the interactive factor
. Alternatively, the interactive factor![]() , and therefore indicates that C. coccoides actually helps promote the Bifidobacterium population somewhat albeit with a very small magnitude.
, and therefore indicates that C. coccoides actually helps promote the Bifidobacterium population somewhat albeit with a very small magnitude.
Additionally, this relationship appears to be amplified in the presence of Bifidobacterium supplementation. The parameter g which denotes C. coccoides’ beneficial effect upon Bifidobacterium is significantly greater than h which signifies Bifidobacterium’s beneficial effect upon C. coccoides. Thus, it seems that C. coccoides overall assists Bifidobacterium’s population growth while Bifidobacterium is essentially ambivalent about C. coccoides.
Further of note is that the solution curves of the model indicate that C. coccoides and Bifidobacterium populations move in tandem. Their highs and lows coordinate very well, so they seem to be responding to the same stimulus for growth and decay. However, this study is unable to go into causal factors for why this correlation relationship exists.
Also, despite the fact that our parameter estimations seem to indicate that C. coccoides and Bifidobacterium have beneficial effects upon each other, it should be noted that in the raw data, C. coccoides actually decreases throughout the observation period. This could be due to the residual effects of the supraphysiological levels of Bifidobacterium given during administration and the high ![]() value. Next, since canine and human intestinal tracts are largely similar [36] , and their intestinal microbiota are also comparable [37] , it was more convenient to study the effects upon dogs when given probiotics.
value. Next, since canine and human intestinal tracts are largely similar [36] , and their intestinal microbiota are also comparable [37] , it was more convenient to study the effects upon dogs when given probiotics.
In conclusion, the present study suggests that Bifidobacterium and C. coccoides populations move nearly simultaneously and with similar magnitudes. Also, the parameter estimations imply that C. coccoides assist Bifidobacterium populations much more so than Bifidobacterium assist the C. coccoides population. However, further studies are likely needed in order to examine the after supplementation effects of Bifidobacterium administration and how the two population groups interact once supplementation has ceased.
Appendix A
Stability Analysis of Model (2) for the Cases of before and after Probiotics Administration (Case ![]() )
)
The Model is given by:
![]() (1)
(1)
![]() (2)
(2)
There are four equilibria:
![]() Extinction
Extinction
![]() Probiotics-free
Probiotics-free
![]() C. Coccoides-free
C. Coccoides-free
![]() Coexistence, where
Coexistence, where
![]()
The Jacobian matrix is given by:
![]()
Evaluating the Jacobian matrix at the first equilibrium,
![]() ,
,
which gives the eigenvalues ![]() and
and![]() .
.
Hence, ![]() is stable when:
is stable when:
![]() (C1)
(C1)
Similarly, for the probiotics-free equilibrium, we have
So, we need to have:
![]() (C2)
(C2)
Additionally, for the C. coccoides-free equilibrium, we have
![]()
which gives the eigenvalues ![]() and
and![]() .
.
So, we need to have:
![]() (C3)
(C3)
To determine the stability conditions for the coexistence equilibrium
![]() , first we shift the model to origin by setting
, first we shift the model to origin by setting ![]() and
and
![]() . We get that:
. We get that:
![]()
![]()
which has the corresponding Jacobian matrix:
![]()
![]()
![]() (3)
(3)
If![]() , then
, then ![]() is unstable.
is unstable.
If![]() , then we need to consider different cases.
, then we need to consider different cases.
We have
![]() (4)
(4)
Also, we require that ![]() and
and![]() , where
, where
![]()
There are two cases:
If![]() , then
, then ![]() only if
only if
![]() (5)
(5)
and
![]() (6)
(6)
But (2) and (3) imply that![]() , which makes
, which makes ![]() unstable.
unstable.
If![]() , then
, then ![]() only if
only if
![]() (7)
(7)
and
![]() (8)
(8)
which implies![]() , and therefore
, and therefore ![]() is stable.
is stable.
In summary, (i) ![]() is unstable if either
is unstable if either
(a)![]() (C4)
(C4)
Or
(b)![]() (C5)
(C5)
Moreover,
![]() (C6)
(C6)
2) ![]() is stable only if
is stable only if
![]() , and (C7)
, and (C7)
![]() , and (C8)
, and (C8)
![]() (C9)
(C9)
Appendix B
Stability Analysis of the Model for the Case of Probiotics Administration
The model is given by:
![]() (9)
(9)
![]() (10)
(10)
There are only two possible equilibria:
1) ![]() C. coccoides-free equilibrium, where
C. coccoides-free equilibrium, where ![]() is the root of
is the root of
![]() . Since we need to have
. Since we need to have![]() , we must have
, we must have
![]() and
and![]() . Since
. Since![]() , we get that
, we get that ![]() results in a positive root
results in a positive root![]() .
.
2) ![]() Coexistence equilibrium. By setting the right-hand side of (11) equal to zero, we get that:
Coexistence equilibrium. By setting the right-hand side of (11) equal to zero, we get that:
![]() (11)
(11)
Substitute (13) into (12) and set equal to zero.
We get that ![]() must satisfy
must satisfy
![]() , where (12)
, where (12)
![]() , and
, and
![]()
We need to have ![]() to have a real root.
to have a real root.
There are four possibilities.
1)![]() . Since
. Since![]() , there will be a positive root.
, there will be a positive root.
2) ![]() and
and![]() . Since
. Since![]() , there will be no real roots or two negative roots.
, there will be no real roots or two negative roots.
3) ![]() and
and ![]() and
and ![]() will produce two positive roots.
will produce two positive roots.
Suppose that (14) has a real positive root![]() . Then, we must make sure that
. Then, we must make sure that ![]() in equation (13), i.e.
in equation (13), i.e.![]() .
.
Stability of![]() :
:
If we compare model (11), (12) with model (1), (2) on page 1, we get that the Jacobian matrix of model (11), (12) is the same as that of model (1), (2) except for the following changes:
![]() becomes
becomes![]() , and
, and
![]() becomes
becomes![]() , and
, and
![]() becomes
becomes ![]()
Hence, following the same procedure, we get that ![]() is stable when:
is stable when:
![]() ,
, ![]() and
and
![]() (C10)
(C10)
We also get that ![]() is stable when
is stable when
![]() , and (C11)
, and (C11)
![]() , and (C12)
, and (C12)
![]() (C13)
(C13)
![]()
eq(12):![]() , where
, where ![]()
![]()
Submit or recommend next manuscript to SCIRP and we will provide best service for you:
Accepting pre-submission inquiries through Email, Facebook, LinkedIn, Twitter, etc.
A wide selection of journals (inclusive of 9 subjects, more than 200 journals)
Providing 24-hour high-quality service
User-friendly online submission system
Fair and swift peer-review system
Efficient typesetting and proofreading procedure
Display of the result of downloads and visits, as well as the number of cited articles
Maximum dissemination of your research work
Submit your manuscript at: http://papersubmission.scirp.org/
Or contact jbm@scirp.org