1. Introduction
Studies on income inequality, which progressed with masterpieces being series of empirical researches by Thomas Piketty and his colleagues ( [1] - [8] etc.), have entered a new stage since [9] showed the appropriate income distribution by developing a theoretical framework to complement the empirical researches and bridge the wide conceptual gulf that exists between economics, which assumes rational agents who maximize their utility or profit, and econophysics, which assumes purpose-free agents who act randomly with near zero intelligence as [10] showed. More precisely, [9] explained the goal-driven behavior of agents, by constructing a theoretical model of purpose-free agents.
The present paper is another attempt to bridge the gulf between economics and econophysics. That is, we construct a chaos-based theoretical model where, in contrast to [9] , the behavior of the goal-driven agents exhibits the behavior of the purpose-free agents.
2. Basic Model
Let us consider an intertemporal economy that consists of one representative firm and two classes of people, namely, working class people (i.e., laborers) and middle class people (i.e., consumers). The firm inputs the labor of the working class people to sell the products to the middle class people whose income source is the dividend from the firm and the capital gain from their assets. As in [11] , we assume that consumers (i.e., middle class people), who purchase either 0 or 1 unit of products, are heterogeneous in that each of these consumers has different willingness-to-pay for the products, to generate the demand curve as aggregate of such demands. In the following, letting subscript t denote the period, we specify the aggregate demand function in period t as , where pt is the product’s price, xt is the aggregate demand for the product, at is the highest willingness-to-pay among the middle class people and bt is a positive parameter that expresses the distribution of the willingness-to-pay of the middle class people. We assume the willingness-to-pay of each consumer relates positively to her/his income in period t so that the shape of the aggregate demand curve reflects the income distribution. In the following, also for the simplicity of the analysis, we assume that each consumer’s willingness-to-pay is equal to θ × 100% of her/his income, and letting c be a positive constant, we specify the relationship between at and bt as
 (1)
(1)
by assuming that the income distribution of the middle class people is constant over time.
As for the decision making of the firm, we assume she/he determines the wage rate to maximize her/his profit in each period, anticipating, as in the efficiency wage model ( [12] [13] and so on), that higher wage rate pulls up the efficiency of the labor, and hence the quality and the price of the product. Letting wt and pt denote the wage rate and the price of the product in period t, we specify the relationship between wt and pt as pt = Atwt, where At is a positive variable that expresses the efficiency of the labor in period t, which we assume to go down if the supply of the product (which is equal to the demand for the product) xt increases. We also assume that xt relates positively to the highest willingness-to-pay at, so that At relates positively to at. In the following, letting η be a positive parameter, we specify the negative relationship between at and At as
 (2)
(2)
Finally, if we specify that one unit of production requires φ units of labor, the firm’s profit in period t,πt = (pt − φwt)xt, is expressed as
 (3)
(3)
Since the firm’s control variable is wt, we have the firm’s first order condition for the profit maximization as , to obtain the profit maximizing wage rate in period t as
 (4)
(4)
By substituting (4) into (3), we have the firm’s maximum profit in period t as
 (5)
(5)
from which we can see that increase in the highest willingness-to-pay in period t (at) has two effects, that is, profit enhancing effect caused by price increase (which is expressed by the term,  and profit reducing effect caused by wage increase (which is expressed by the term,
 . Now the model is complete.
3. Fixed Inequality and the Chaos
Based on the above analysis, this section shows that fixed income inequality among the middle class people, as well as the immobility between the two classes (i.e., the middle class and the labor class), generates chaos.
For this purpose, let us assume that the firm’s profit in each period is allocated to the middle class people so as to maintain the distribution of the income, which is equivalent with the distribution of the willingness-to-pay. Assuming that total income of the middle class people (i.e., sum of the dividend from the firm plus the capital gain from their assets) is γ times as large as their total income gain (which is equal to πt), total willingness-to-pay of the middle class people is γθπt, since, as mentioned above, each consumer’s willingness-to-pay is equal to θ × 100% of her/his income. Thus, aggregate demand curve in period t + 1 is depicted as a triangle as in Figure 1, with its area and the width of the bottom being γθπt and c, which establishes the following equation:
 (6)
(6)
![]()
Figure 1. Aggregate demand curve in period t + 1.
This relationship between πt and at, combined with (5) generates the dynamics of at as
 (7)
(7)
Thus, by assuming  and
and , and substituting these into (7), we obtain
 (8)
(8)
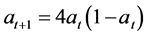
which is the logistic map [14] demonstrated to generate chaos. Figure 2 is the logistic map of Equation (8) that shows the unpredictable cobwebbing behavior of at.
In this case, since supremum of at is 1, η is the infimum value that one unit of wage generates. So that, we have the following proposition.
Proposition 1: Intertemporal fluctuation of the market becomes chaos if 1) the capital gain of the middle class people is large enough for them to consume eight times as much as their income gain and 2) the infimum value that one unit of wage generates is the same as the amount of products made by one producer.
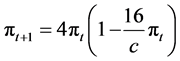
If we combine (8) with (6), we have the dynamics of πt as
 (9)
(9)
Thus, by assuming  and substituting these into (9), we obtain
 (10)
(10)
which is also the logistic map that generates chaos whose behavior is shown virtually the same as in Figure 2.
Proposition 2: Economy becomes chaos if 1) the capital gain of the middle class people is large enough for them to consume eight times as much as their income gain and 2) market for the middle class people is large enough number of the middle class people is 16 times as large as the amount of products made by one producer.
4. Conclusions
The present paper attempted to bridge the gulf between economics and econophysics by constructing a chaos-based theoretical model where the behavior of the goal-driven agents exhibits the behavior of the purpose-free agents.
Main conclusion is: economy becomes chaos if 1) the capital gain of the middle class people is large enough for them to consume eight times as much as their income gain and 2) market for the middle class people is large enough and number of the middle class people is 16 times as large as the amount of products made by one producer.
We truly hope this research note will contribute to the progress of studies on the income inequality and the chaos.