1. Introduction
Recently, increasing developments in the electronics industry, electronic components have been required with smaller size, higher performance, and multifunction capability. Therefore, composites, especially ferromagnetic-ferroelectric composites, have been attracting more and more attention [1] [2] [3] [4] . When ferromagnetic and ferroelectric phase coexist in one material, novel properties, such as magneto-electric and magneto-optic properties, are expected due to the interaction between magnetization and electric polarization. Therefore, much work on ferromagnetic-ferroelectric composites has been carried out. From history and development of magnetoelectric phenomenon (ME), the coupling between electric and magnetic fields was initially discovered by Rontgen in 1888 [5] when he found that a moving dielectric placed in an electric field has become magnetized, and then was theoretically described by Curie in 1894 [6] on the base of crystal symmetry considerations. The discovery of the phenomenon of ferroelectricity was made by Valasek in 1920 [7] . Fox and Scott [8] have also shown that ferroelectricity can produce magnetic order and vice versa. This has provoked interest in study and understanding of “multiferroics” and “magnetoelectric” materials. However, many reports indicate that the introduction of low-dielectric-constant (ε) ferrite and the defect reaction between the ferrite and ferroelectric phases would result in a low dielectric constant for the composite, which is not compatible with the trend for higher capacitance and smaller size for electronic components [3] . On the other hand, according to percolation theory, the dielectric constant depends strongly on the conductivity ratio of the ferroelectric and ferrite phases [9] [10] . A higher dielectric constant can be obtained by increasing the conductivity of the ferrite phase, especially for composites with a ferrite volume fraction in the neighborhood of the percolation threshold. As is well known, the conductivity of ferrites, such as (Ni, Zn)Fe2+xO4, is tunable by adjusting the value of x. Fe-rich ferrite (x > 0) has higher conductivity because of electron hopping between Fe+3 and Fe+2. This implies that a ferromagnetic-fer- roelectric composite with a high dielectric constant can be fabricated by introducing Fe-rich ferrite fillers into a ferroelectric matrix of high resistance.
2. Experimental
2.1. Sample Preparation
2.1.1. Ferrite Preparation with Ceramic Method
In the presence investigation sample, having Ni0.45Co0.2Zn0.35Fe2O4 structure was preparation. The starting materials were NiO, CoO, ZnO, and Fe2O3. All material used were of highly chemically pure grade (99.99%), Suitable proportions of these starting materials(oxides) were weight by using a digital balance type (OHAUS B 100) as shown in Table 1.
Then, all oxides were grinded in an agate mortar in order to obtain very fine powder and then mixed thoroughly in presence of distilled water to improve the homogeneity using a retch ball mix. The resulting mixture was calcined in air for 4 h at 950˚C, then the calcined products was well grinded again in order to obtain fine powder. The fine powder was pressed at room temperature in the form of discs and triodes at constant pressure of 8 kp/cm2 in stainless steel mold. The
![]()
Table 1. The weights of starting material, NiO, CoO, ZnO, and Fe2O3, in gram for Ni0.45Co0.2Zn0.35Fe2O4.
samples finally sintered at 1100 ˚k for 5 hour in air and then left to cool gradually inside the electric furnace. The samples were polished to obtain discs with two uniform parallel surface. Contacts on the sample surface were made by silver paste.
2.1.2. Ferrite Preparation with Co-Precipitation Method
Ni0.45Co0.2Zn0.35Fe2O4 ferrite particles was prepared by chemical precipitation of [NiCl2, CoCl2, ZnCl2] and [FeCl3] (1:2 molar ratio) by addition 25% ammonia solution [11] . The volume of reaction mixture have been mixed using magnetic stirring during continuous slow addition of 25 ml ammonia solution and the heating continued for thirty minutes. The powder precipitate was decanted in and washed with 500 ml distilled water [12] .
2.1.3. Preparation of Sodium Acetylacetonate
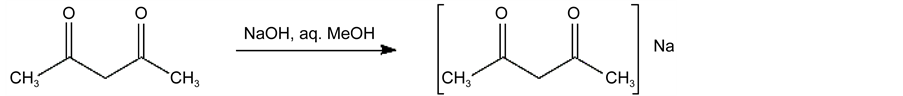
Sodium acetylacetonate is prepared by dissolving 40 g (1 mole) of sodium hydroxidein 50 ml of water and adding to this 200 ml of methanol. This solution is added, slowly with hand stirring, to 100 g (1 mole) of acetylacetone contained in a 500-ml flask. The creamy-white crystalline salt separates from solution immediately. The flask is stoppered and cooled in ice (or in a refrigerator) for 2 hours or overnight. The sodium salt is collected on a Büchner funnel and washed with two small portions of cold methanol. After the salt is air dried, it is dried further either by allowing it to stand in a vacuum desiccator at room temperature or by heating it in a vacuum oven at 100˚ for 3 hours. The anhydrous product is stable and can be stored indefinitely in a stoppered jar [13] .
2.1.4. Preparation of the Composites
Ni0.45Co0.2Zn0.35Fe3O4 [NCZF] and Sodium Acetylacetonate [Na(acac)] were mixed with the percentage according to formula [[(NCZF)1−x(Na(ac.ac))x], (x = 0%, 20%, 40%, 60%, 80%, 100%). The composites were mixed and ground very well for 12 hours using agent mortar. Finally, all samples were ground and pressed at room temperature into tablets under of 10 Tonn/cm2 of diameter 1cm and 0.4 cm thickness.
2.2. Experimental Processes
XRD - TEM - SEM - IR Spectroscopy.
3. Results and Discussion
3.1. X-Ray Diffraction Pattern
Figure 1(a) shows the diffraction pattern of pure spinel phase of Ni0.45Co0.2Zn0.35 F2O4 [NCZF] prepared by co-precipitation method and ceramic method whereas
![]() (a)
(a)![]() (b)
(b)
Figure 1.(a) Comparison between XRD of pure NCZF ferrite preparation by ceramic method and co-precipitation method; (b) XRD pattern characteristic the Na(ac.ac).
Figure 1(b) shows the different pattern of Na(ac.ac). All peaks were found to be in good agreement with that obtained by JCPDS card. The d-spacing for as prepared pure Na(ac.ac) were calculated and agreed with that of published Na(ac.ac) as shown in Table 2. Peak intensity is given at 2θ = 22.01˚, the other stronger diffraction peak 16.9˚, 17.55˚, 24.5˚ were in agreement with previous work for (Na(ac.ac)). The XRD of nanocomposite in Figure 2 is showed that the addition (Na(ac.ac)) has considerable effect on crystalline morphology structure of both ferrite and (Na(ac.ac)) [14] [15] .
The ferrite diffraction peaks intensity decrease by increasing (Na(ac.ac)) ratio. The (XRD) diffractogram of the composite showed broad peaks because of the presence of nanoparticles. The changes occurred at peak intensities for the two phases indicates the interaction between ferrimagnetic and ferroelectric phases, and the formation of composite with two phases.
![]()
Table 2. Diffraction pattern of ferroelectric phase (Na(ac.ac)).
![]()
Figure 2. XRD for [(Ni0.45Co0.2Zn0.35Fe2O4)x−1 + N(acac)x], x = 0%, 20%, 40%, 60%, 80%, 100%.
The XRD patterns were used to estimate the crystallite size from the most intense peaks using Scherer’s equation [16]

where
・ K = 0.89 is Scherer constant.
・  is the full width at half maximum, intensity of X-ray diffraction.
・  is the wave length of the X-ray for CuKα radiation (1.541178A˚), and
・  is angle of diffraction in redial.
The calculated average crystallite size was found 25 - 30 nm for ferrimagnetic phase and from 47 - 52 nm for ferroelectric phase. The dependence of crystallite size for both phases on Na(ac.ac) content is shown in Figure 3.
The average crystallite size of both phases increase by increasing Na(ac.ac)) content whereas the value of crystallite size of Na(ac.ac) is higher than that of ferrite phase. The presences of Na(ac.ac) improve the crystalline state of the samples which lead to the increase of crystalline size. The calculated lattice Constance (α) as a function of Na(ac.ac) content for ferrimagnetic phase shown in Figure 4, which show that, there is increase of the Lattice constant by increasing Na(ac.ac) content up to 0.4 and then decreases. The increase of lattice constant may be due to the expansion of unit cell because the presence of Na(ac.ac) increases of internal strain in the composite. After certain limit the Na(ac.ac) phase precipitates at grain boundaries and prevent the ferrite phase from expansion, leading to decrease the crystallite size.
![]()
Figure 3. Crystallite size for composites [(NCZF)1−x Na(ac.ac)x]
![]()
Figure 4. Lattice constant (α) as a function of Na(ac.ac) content.
The theoretical density and bulk density Dx, D of ferrite phase as a function of Na(ac.ac) content shown in Figure 5. It decreases by increasing Na(ac.ac) contents due to the lower density of Na(ac.ac) (2.1 g/m3). The theoretical density Dx was calculated, and was higher than the bulk density due to the presence of pores. Table 3 shows the mean ionic radius of the A- and B-sublattices (RA and RB) which can be calculated for Ni0.45Co0.2Zn0.35F2O4 [NCZF] phase prepared by ceramic and co-precipitation method, using the cation distributions. The radius of octahedral site rB and tetrahedral site rA for (NCZF) for ferrite phase prepared by ceramic and co-precipitation method calculated by the relations [17]


where r denotes to the ionic radius and y to the number of the M = Ni2+ or Co2+ ions at the A-sites. The rA and rB for both sample have the same value depending on the cation distribution proposal. The expected cation distribution for a ferrite samples under consideration is given in the same table. The result confirmed that all the samples crystallize in the spinel structure irrespective the method of preparation. The as prepared sample by co-precipitation method has spinel phase without any calcination, which consider the successful process for preparation
![]()
Figure 5. The theoretical density and bulk density Dx, D of ferrite phase as a function of Na(ac.ac) content.
![]()
Table 3. The radius of cathedral site RB and tetrahedral site RA for (NCZF) for ferrite phase prepared by Ceramic (S1) and Co-precipitation method (S2).
of the ferrite sample. The Lattice parameter of the first sample (ceramic method) equal 8.4727 and for (co-precipitation method) equal 8.485, the broad peak of the sample (S1) indicate that crystallite size has lower value (25 nm) than that of S2 (36 nm).
3.2. Transmission Electron Microscopy (TEM)
Figure 6 shows that the transmission electron microscope photos of the composite samples prepared by co-precipitation method (as prepared) at different
ratios of Na(ac.ac). It is apparent that the cubic nanoparticles diameter where ranged from (26 - 36 nm) and the particle size of Na(ac.ac) is greater than NCZF.
The analysis of TEM micrograph shows that the crystalline size was found to be in agreement with that obtained in XRD in Table 4. The same behavior has also confirmed from XRD beaks indicating polycrystalline nature of prepared sample. The size of the particles was observed to increase with Na(ac.ac) contents. The increase in crystalline size is most likely due to the agglomeration process of crystalline resulting in an increase in its size. We can conclude that the particle size may be controlled by either varying the annealing temperature of the sample or the addition Na(ac.ac) content. The crystallite size estimated from Scherrer’s equation formula agrees well with that obtained from the corresponding TEM micrograph [18] [19] .
Thus it is possible to control particle size by adjusting the ratio of Na.ac.ac content.
From TEM micrographs, the presence of Na(ac.ac) causes the repairing particles fused which lead to the increase of the particles size. Thus it is possible to control particle size by adjusting the ratio of Na(ac.ac) content
The TEM micrograph of ferrite nanoparticle synthesized by co-precipitation method and ceramic technique are shown in Figure 7. It is observed that the ceramic particle is slightly agglomeration and a particle size is higher than that of the co-precipitation method, moreover the ceramic particles are of irregular shape. This is evidence that the particle size of the co-precipitation method is smaller than these of the ceramic particles.
It is indicated from the TEM images that nanoparticles agglomerated for low value of Na(ac.ac) because of the isolation effect of Na(ac.ac) among the magnetic nanoparticle.
3.3. Scanning Electron Microscope (SEM) Micrograph Study
Figure 8 shows the surface morphologies of the as prepared nanoferrite prepared by co-precipitation method and the composite samples of [NCZF(1−x) + Na(ac.ac)(x)], x = 0%, 20%, 40%, 60%, 80%, 100%. It is illustrates that the grain size of NCZF is symmetrically and uniform. Two type grains appear at the composite sample one of them referred to NCZF and the other has needle shape
![]()
Table 4. The calculated crystallite sizes.
![]()
![]() (a) (b)
(a) (b)
Figure 7. The comparison between the TEM micrographs NCZF nanoparticles prepared by (a) Ceramic method and (b) Co-precipitation method.
referred to Na(ac.ac). As seen in Figure 8 the needle shape grains accumulate around the NCZF grains and become the predominant at higher content of Na(ac.ac). The grain size of NCZF increases by increasing Na(ac.ac) content. The presence of Na(ac.ac) enhances the grain growth which is varied from 0.1 - 3 µm. The microstructure of NCZF/a Na(ac.ac) composite has a very small pore with a good point contact. Finally we conclude that, ferrite grain growth has been enhanced when Na(ac.ac) exist as impurity phase [20] [21] .
Figure 9 shows the SEM photograph for NCZF prepared by ceramic method at 1100˚C for 4 hours; the average grain size estimated from micrograph was found ≈5 µm. The influenced of sintering temperature in ceramic method on the grain growth is high enough to make the grain size of NCZF is greater than that prepared by co-precipitation method. It is difficult to obtain dense, homogenous and fine grains by solid-state reaction (ceramic method) because of the large difference between sintering behavior and thermal expansion coefficient of the constituents of ferrite.
Figure 9 describes the comparison between the SEM micrographs of the ferrite samples prepared by sintering process and co precipitation. The inhomogeneity of grain distribution in the sintered ferrite is shown as a good homogeneity of the grains in the ferrite prepared by co-precipitation method is also noticed giving rise to larger grain size of ceramic samples.
3.4. IR Spectral Analysis of the Composites
Figure 10 shows IR spectral analysis of single phase of ferrite and Na(ac.ac) and their composites. The spectra of ferroelectric phase has characteristic assigned band at 1010 cm−1 is due to the stretching vibration of (C-H) bond and the band at 866 cm−1 due to the binding vibration of (C-H) bond. The absorption band at 413 cm−1 is due to the (Na-C) bond vibration. On the other hand the appearance of IR absorption band near 3427 cm−1 is assigned to stretching vibration of (O-H) bond. The absorption band at 1507 cm−1, 1614 cm−1 were assigned to (C=O) and
![]()
Figure 8. The SEM micrograph for the composite samples [NCZF(1−x) + Na(ac.ac)(x)], x = 0%, 20%, 40%, 60%, 80%, 100%.
![]() (a)
(a)![]() (b)
(b)
Figure 9. The comparison between The SEM micrographs NCZF nanoparticles prepared by (a) Ceramic method and (b) Co-precipitation method.
(C=C) stretching mode respectively. The intensities of these absorption bands decrease by increasing ferrite content and completely disappear at 100% ferrite. The two characteristic bonds is at 590 and 419 cm−1 are due to stretching vibration of (Fe3+-O2−) bond at tetrahedral (υ1) and octahedral (υ2) mode of vibration. The characteristic absorption bands υ1 and υ2 values decreases by increasing Na(ac.ac) contents. This may be due to the shorting of Fe3+ bond length by introducing Na(ac.ac). Figure 11 shows IR-spectra of ferrite samples prepared by ceramic and co-precipitation method. It appeared from the figure that the frequencies of characteristic band (υ1) shift to higher frequency from 575 - 590 cm−1
![]()
Figure 10. IR spectral for the nanocomposite samples [NCZF(1−x) + Na(ac.ac)(x)], x = 0%, 20%, 40%, 60%, 80%, 100%.
![]()
Figure 11. IR spectral for the nanocomposite Ni0.45Co0.2Zn0.35F2O4 prepared by coprecipitation method (co) and ceramic method (ce).
![]()
Table 5. The force constant of both tetrahedral and octahedral increase by introducing Na(ac.ac).
for υ1 and nearly constant for υ2. These results show the preparation method affect the molecular character of ferrite [20] .
Since of the vibrational frequencies are proportional to the force constant according to the formula [22]
F = 4π2υ2c2μ
where, c: is velocity of light, υ: is frequency band and μ: is reduced mass of (Fe3+-O2−).
The force constant of both tetrahedral and octahedral increase by introducing Na(ac.ac) as given in Table 5. This mean that the electronic distribution of (Fe-O) bond is greatly affected by the addition of Na(ac.ac) which causing change of electric dipole moment of this bond. In conclusion, the presence of Na(ac.ac) effect of inter molecular character of ferrite. The difference between the two characteristic frequencies υ1 and υ2 is about 171 cm−1 for pure ferrite and decreases by increasing Na(ac.ac) and reaches to 141 cm−1 for 60% Na(ac.ac). These indicate that the ratio of ferrimagnetic phase decreased by introducing the ferroelectric phase.
4. Conclusion
The addition (Na(ac.ac)) has considerable effect on crystalline morphology stru- cture of both ferrite and (Na(ac.ac)). The average crystallite size of both phases increases by increasing (Na(ac.ac)) content whereas the value of crystallite size of Na(ac.ac) is higher than that of ferrite phase. Density of ferrite decreases by increasing Na(ac.ac) contents due to the lower values of Na(ac.ac) density (1 kg/m3). It is evidence that the coprecipitation method gives ferrite particle smaller size than the ceramic particles and the inhomogeneity of grain distribution in the sintered ferrite, whereas good homogeneity of the grains in the ferrite is prepared by coprecipitation method. The addition of Na(ac.ac) may change the molecular character of ferrite leading to the change of band frequency.