A Within-Host Model of Dengue Infection with a Non-Constant Monocyte Production Rate ()
1. Introduction
Dengue is a virus belonging to the Flavivirus genus. The Flavivirus genus includes mostly mosquito-borne viruses such as the West Nile virus and the yellow fever virus. The dengue virus exists in four different serotypes. A serotype is a distinct variation within a species of viruses that may present a different configuration or slightly different kind of antigen. All serotypes of the dengue virus can cause the full spectrum of disease symptoms [1] .
The World Health Organization estimates that nearly 50 million infections occur annually in over 100 countries [2] . As there are no specific anti-viral treatments for dengue infection, supportive care is the usual treatment. This may include bed rest, antipyretics and analgesics. A small subset of infections result in dengue hemorrhagic fever which can be fatal.
The incubation period of the virus in an infected host ranges from 5 to 10 days [3] . At the end of the incubation period, viral particles enter the bloodstream and cause the onset of symptomatic fever. Viremia, the presence of virus in the blood stream, occurs roughly two days before the onset of symptoms and lasts 5 to 6 days [4] . Viremia tends to peak at the time of or shortly after the onset of illness. The clearance of virus is performed by the immune system.
There have been many mathematical studies of dengue infection. Of those, relatively few [5] [6] [7] [8] [9] are concerned with within-host dynamics. In these, it is assumed that the production of target cells is constant. This assumption is adequate in healthy individuals but the production of monocytes can vary, especially during infection [10] . In fact, the data in [10] show that monocyte levels are actually elevated during dengue infection, which is rather counter-intuitive. In general, the production is controlled by the Macrophage Colony Stimulating Factor (M-CSF). We account for this additional aspect in our model and show that this modification allows for better agreement with the data.
The remainder of the paper is organized as follows: in Section 2 we formulate the homogeneous viral infection model. Section 3 is the analysis of the model’s equilibria. Section 4 contains the parameter sensitivity analysis and comparisons with previous models. In Section 5 we make some concluding remarks.
2. The Model
Within this section, we formulate a model of population growth of the dengue virus within the human body based on the model in [9] . The model starts with the beginning of the detectable viremia period. It is assumed that one serotype of dengue virus circulates within the infected host and that the virus infects the monocyte cell population of the host.
In [9] , the authors studied the following model:
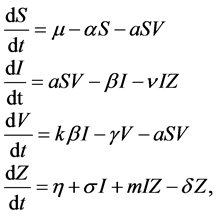 (1)
(1)
where , and
, and  represent the density of susceptible monocytes, infected monocytes, free virus particles and immune cells in
  blood at time
 , respectively. The production of susceptible monocytes is assumed to be a constant
  and they also have a constant death rate
 . This model always shows that monocyte population significantly decreases during infection, which is not always the case [10] . In order to obtain a model that more closely resembles the data in [10] , we have chosen to model the production of monocytes dynamically. First, we account for the fact that the primary catalyst for monocyte production is a cytokine called the Macrophage Colony Stimulating Factor (M-CSF). Other components of the blood are also controlled in a similar way. For example, the production of erythrocytes is controlled by the hormone erythropoietin. In several previous works, including [11] [12] [13] , it was assumed that the rate of production was proportional to the hormone concentration. We will make the same assumption here and will require that in the absence of infection, the rate of production is indeed the constant
 . This changes the first equation in (1) to
 (2)
(2)
where  is the normal concentration of M-CSF. We are now required to model the dynamics of the M-CSF production. First, we will model how the body regulates its control under normal conditions, i.e., no infection. In this case, the production’s purpose is to maintain a normal monocyte count [14] , which we will call
 . We want a function that increases when
  and decreases when
  To achieve this, we
have chosen the function 
It is also known that M-CSF production increases as a result of susceptible cells being infected [15] [16] . Therefore, we will assume that the rate of increased production is proportional to the rate of infection, . Thus we will have the term
 , where
  is the constant of proportionality. Finally, M-CSF has a natural decay rate which we will call
  This results in the equation
![]() (3)
(3)
The infection of susceptible monocytes depends on the successful invasion rate ![]() of virus into susceptible cells per unit time. The infection period of infected monocytes
of virus into susceptible cells per unit time. The infection period of infected monocytes
is assumed constant as![]() . Upon infected cell death,
. Upon infected cell death, ![]() free virus particles are released into the blood. The free virus particles are assumed to be cleared at a rate of
free virus particles are released into the blood. The free virus particles are assumed to be cleared at a rate of![]() .
.
It is assumed that the immune cells are produced at a constant rate ![]() and they have a lifespan of
and they have a lifespan of![]() . Additionally, we assume immune cell production is stimulated by the
. Additionally, we assume immune cell production is stimulated by the
current level of infection ![]() at a constant rate
at a constant rate![]() , as well as from contacts with infected cell at constant rate
, as well as from contacts with infected cell at constant rate![]() . Lastly, we assume that immune cells will eliminate the infected monocytes at a constant rate
. Lastly, we assume that immune cells will eliminate the infected monocytes at a constant rate![]() .
.
With these assumptions, we formulate the model for with-in host dengue viral infection with immune response and variable monocyte production rate, as the following.
![]() (4)
(4)
We were able to find the values for normal susceptible counts and the normal M-CSF concentration, ![]() and
and ![]() in the literature. The same is true for the decay rate of M-CSF,
in the literature. The same is true for the decay rate of M-CSF, ![]() [17] . The value of
[17] . The value of ![]() was chosen so that in the absence of infection,
was chosen so that in the absence of infection, ![]() and
and ![]() form part of the disease-free equilibrium. This results in
form part of the disease-free equilibrium. This results in
![]() The value of
The value of ![]() was determined by a statistical analysis based on data
was determined by a statistical analysis based on data
found in [10] , which we will discuss in detail in Section 4. Since we can express ![]() and
and ![]() in terms of the other parameters, we decided to do so and work with the following version of the model:
in terms of the other parameters, we decided to do so and work with the following version of the model:
![]() (5)
(5)
All model parameters are assumed to be positive.
3. Model Equilibria and Analysis
We will focus on the disease-free equilibrium![]() , where
, where![]() ,
, ![]() , and
, and ![]() and the death equilibrium
and the death equilibrium![]() .
.
The Jacobian of the model is expressed below
![]() (6)
(6)
Substituting the disease-free equilibrium into the Jacobian matrix results in
![]() (7)
(7)
And the tedious calculation of ![]() gives the characteristic polynomial:
gives the characteristic polynomial:
![]() (8)
(8)
which, conveniently, is a product of three linear polynomials and a quadratic. Finding the roots of these four polynomials gives us the expressions for the eigenvalues given below.
![]() (9)
(9)
where ![]()
This allows us to formulate the following theorem:
Theorem 1. If ![]() then the disease-free equilibrium,
then the disease-free equilibrium, ![]() , is locally asymptotically stable.
, is locally asymptotically stable.
Proof. Recall that all parameter values are positive. Upon inspection, we can clearly see that all ![]() aside from
aside from ![]() are either negative or will have real parts that are negative. In order to ensure that
are either negative or will have real parts that are negative. In order to ensure that ![]() has a negative real part we must require
has a negative real part we must require
![]() (10)
(10)
which leads to the result. W
By substituting![]() , the model reaches the equilibrium
, the model reaches the equilibrium
![]() We refer to this as the “death” equilibrium even though the immune
We refer to this as the “death” equilibrium even though the immune
cells are still present. We call this the “death” equilibrium since individuals do not function without monocytes. The resulting Jacobian in this case is:
![]() (11)
(11)
Here the resulting characteristic polynomial is:
![]() . (12)
. (12)
In this case also we can get expressions for eigenvalues, which are given below:
![]() (13)
(13)
Since ![]() for all sets of positive parameters, we see that this equilibrium is always unstable. We have also seen an interior persistence equilibrium in numerical simulations where
for all sets of positive parameters, we see that this equilibrium is always unstable. We have also seen an interior persistence equilibrium in numerical simulations where![]() .
.
4. Parameter Values and Simulations
In this section we provide numerical simulations of different theoretical treatment techniques. We were able to find all parameters in the model in literature [9] [17] except the parameters ![]() and
and![]() . The parameter
. The parameter ![]() was calculated as mentioned in Section 2. To calculate the parameter
was calculated as mentioned in Section 2. To calculate the parameter![]() , we used the data provided in [10] , which gave monocyte counts in individuals infected with dengue. It was found that the individuals had a mean monocyte count of
, we used the data provided in [10] , which gave monocyte counts in individuals infected with dengue. It was found that the individuals had a mean monocyte count of ![]() with a standard deviation of 370. We used MATLAB’S “randn” function to generate 200 random data sets (each with 15 points) from a normal distribution with that same mean and standard deviation. The 15 points were used as data values measured every 12 hours during a one week period. For each data set, we used MATLAB’S “fminsearch” function to find the value of
with a standard deviation of 370. We used MATLAB’S “randn” function to generate 200 random data sets (each with 15 points) from a normal distribution with that same mean and standard deviation. The 15 points were used as data values measured every 12 hours during a one week period. For each data set, we used MATLAB’S “fminsearch” function to find the value of ![]() that minimized the function
that minimized the function
![]()
where![]() . After these 200 values of
. After these 200 values of ![]() were found, we calculated their mean. We repeated this process many times and consistently got values in the lower-fifties, and we finally settled on the value
were found, we calculated their mean. We repeated this process many times and consistently got values in the lower-fifties, and we finally settled on the value![]() .
.
The rest of the parameter values are given in Table 1. We should also mention that this parameter set and all of the modified ones that follow result in![]() .
.
4.1. Comparisons with Previous Models
As previously mentioned, this model displays dynamics of the monocyte population that are more in agreement with the data in [10] than previously studied models. Specifically, according to the data in [10] , monocytes levels are actually elevated above the normal count of ![]() cells per L. We will demonstrate this with a comparison of the models in [8] [9] . We used the same values for the common parameters in each model and started with the initial conditions
cells per L. We will demonstrate this with a comparison of the models in [8] [9] . We used the same values for the common parameters in each model and started with the initial conditions ![]() and
and ![]() respectively. We provide a plots of the monocyte counts in each of the three models. The results are plotted in Figure 1 and Figure 2.
respectively. We provide a plots of the monocyte counts in each of the three models. The results are plotted in Figure 1 and Figure 2.
We see that in both models with constant monocyte production the monocyte levels are never higher than the equilibrium. The new model with dynamic monocyte production does demonstrate this behavior and agrees quite well with the data in [10] .
4.2. Treatment Scenarios
There are several theoretical approaches to treating the disease. For example, the illness
![]()
Figure 1. Comparison of monocyte counts.
![]()
Figure 2. Comparison of monocyte counts.
might be less severe if the death rate of the infected cells, ![]() , were increased. Another approach might be to reduce the infection rate,
, were increased. Another approach might be to reduce the infection rate, ![]() , so that fewer monocytes are infected. We will present this case first. We held all other parameters fixed and examined theoretical treatments that could reduce
, so that fewer monocytes are infected. We will present this case first. We held all other parameters fixed and examined theoretical treatments that could reduce ![]() by 10%, 25%, and then 50%. We then plotted the results along with the results from no treatment at all. The results are presented in Figure 3.
by 10%, 25%, and then 50%. We then plotted the results along with the results from no treatment at all. The results are presented in Figure 3.
We see that while this type of treatment appears successful in reducing the viral and infected cell loads, it also prolongs the infection. Still, it seems like a promising approach. We can now compare this scenario with the previously mentioned increase in![]() , the infected monocyte death rate. In this simulation we increase the value of
, the infected monocyte death rate. In this simulation we increase the value of ![]() by 10%, 25%, and then 50% and then plotted the results along with the case without treatment. The results are shown in Figure 4.
by 10%, 25%, and then 50% and then plotted the results along with the case without treatment. The results are shown in Figure 4.
It can be seen here that the model has nearly no sensitivity to the parameter ![]() and is predicting that treatments of this type are likely not worth exploring. Another approach might be to increase the death rate,
and is predicting that treatments of this type are likely not worth exploring. Another approach might be to increase the death rate, ![]() , of free viruses. In Figure 5 we present the resulting plots from increasing
, of free viruses. In Figure 5 we present the resulting plots from increasing ![]() by 10%, 25%, and 50%.
by 10%, 25%, and 50%.
Again the model reacts very little to adjusting this parameter suggesting that increasing the free viral death rate is not a useful strategy. Another logical approach is to reduce the number of new viruses produced by an infected monocyte,![]() . In Figure 6 we present plots resulting from reducing
. In Figure 6 we present plots resulting from reducing ![]() by 10%, 25%, and 50%.
by 10%, 25%, and 50%.
One can see the most drastic reaction in this case. By reducing ![]() by 50% we see a more than 50% reduction in the viral load. Therefore it appears that treatments that reduce the number of new viruses produced by infected monocytes are the most efficient.
by 50% we see a more than 50% reduction in the viral load. Therefore it appears that treatments that reduce the number of new viruses produced by infected monocytes are the most efficient.
![]()
Figure 3. Infected cell and virus populations measured with varying ![]() values.
values.
![]()
Figure 4. Infected cell and virus populations measured using varying ![]() values.
values.
![]()
Figure 5. Infected cell and virus populations measured with varying ![]() values.
values.
![]()
Figure 6. Infected cell and virus populations measured using varying ![]() values.
values.
5. Conclusion
In this paper we have presented a new model for within-host dengue infection. The new approach does not assume that the monocyte production is constant throughout infection and includes a fifth equation that models the production of the primary stimulant for monocyte production, Macrophage Colony Stimulating Factor (M-CSF). By modeling the production of monocyte counts dynamically, our model has produced qualitative behavior not seen in previous models. Namely, that monocyte counts are elevated above the equilibrium during at least some period of infection. This behavior is in agreement with available data [10] . We were also able to find the net reproductive rate ![]() and thus obtain a stability result for the disease-free equilibrium. While the current treatment of dengue infection is only supportive care in the form of hydration and pain relievers, we have explored theoretical approaches that might affect viral loads and reduce the severity of symptoms. Through simulations we have seen that two approaches seem promising. The first is the reduction of the infection rate
and thus obtain a stability result for the disease-free equilibrium. While the current treatment of dengue infection is only supportive care in the form of hydration and pain relievers, we have explored theoretical approaches that might affect viral loads and reduce the severity of symptoms. Through simulations we have seen that two approaches seem promising. The first is the reduction of the infection rate ![]() of monocytes by viruses. The second and most effective theoretical treatment strategy is to reduce the number of new viruses,
of monocytes by viruses. The second and most effective theoretical treatment strategy is to reduce the number of new viruses, ![]() , produced by each infected monocyte.
, produced by each infected monocyte.
Acknowledgements
We thank the Editor and the referee for their comments. This work was partially funded by the Marquette Fellowship at Loyola University New Orleans.