Dependency of Torque on Aerofoilcamber Variation in Vertical Axis Wind Turbine ()
1. Introduction
In general, two wind turbines can be found i.e. VAWT and horizontal axis wind turbine (HAWT), which extracts and converts wind energy into useful electrical energy. Though, VAWT is very popular nowadays as it is utilizing wind energy from any direction for generation of electricity, it does not require yaw mechanism and it can be hold on a lighter weight tower. The merit of VAWT over HAWT is that the sections of this wind turbine are uniform and untwisted mostly, thereby giving ease in fabrication, reducing the maintenance and fabrication cost. The problem associated with it includes its inability to self-start and low efficiency [1] . AM Biadgo, Simonović [2] investigated that negative torque cause inability for VAWT to self-start using numerical and analytical techniques. However, researchers are investigating the causes and remedies of self-start inability due to less stability and boundary attachment to the aerofoil [3] [4] . However, Baker [5] provided an ameliorating solution to overcome the problem of self-start by adding features to aid or enable self-starting of fixed pitch low solidity VAWT. By keeping in mind the problem associated with self-start of the wind turbine researcher have put effort to enhance the performance of wind turbine. Beri and Yao [6] investigated that cambered aerofoil in VAWT have improved self-starting capability as to initiate the rotation of wind turbine quickly. Furthermore, this self-starting mechanism lack in the VAWT due to rotational axis being perpendicular to the oncoming airflow. Researchers have also found that using different number of blades have varied performance, however, the best performance is given by 3 bladed wind turbine [7] . Nobile R. et al. [8] [9] focused on the phenomena of VAWT performance and aerodynamic forces at different tip speed ratios based on CFD. Lanzafame, Mauro [10] performed flow simulations on VAWT by varying the rotor radius along with the blade chord length and found out decrease in performance co-efficient by reducing the radius. Kaminsky, Filush [11] performed CFD simulation on fixed and variable pitch symmetrical blade VAWT, although variable pitch bladed VAWT performed better in power generation case, but by varying wind speed there were sudden fluctuation in power graph. Edwards, Durrani [12] performed wind tunnel experiment and found experimentally that with increased wind speed and decreased number of blades there was increase in wind turbine performance. Roh and Kang [13] found the effect of blade profile on the performance of Darrieus VAWT by using multiple stream tube (MST) numerical analysis approach and concluded that low-digit symmetrical NACA aerofoil generate more power than high digitaerofoil. Abu-El-Yazied, Ali [14] performed CFD simulation with K-epsilon turbulence model by varying number and chord length of VAWT. It was concluded that by increasing blade chord length and decreasing number of blades, maximum co-efficient of power can be achieved. Due to high focus on the VAWT, this research focuses on the optimization of 3 bladed wind turbine by changing camber of aerofoil.
2. Modeling and Simulation
2.1. Geometric Modeling
Geometry parameters were considered from Biadgo, Simonović [2] study. This study consist of wind turbine with three blades as it provides better efficiency [7] [12] [14] . VAWT model was made by importing Java Foil generated aerofoil to CATIA for generation of 2-D CAD model. Figure 1 represents aerofoil geometry of all samples whereas Figure 2 illustrates simulation domain and turbine rotor design.
![]()
Figure 1. Aerofoil models (a), (b), (c), (d) and (e) with coordinate.
![]()
Figure 2. Geometry Sketch and description.
After designing model of wind turbine an enclosure was made around the aerofoil. Figure 2 shows the geometry. It has three aerofoils with 200 mm chord length and they are part of VAWT with 2 m rotor radius. The design of Darrieus-type straight-bladed vertical axis turbines were studied using different models [15] [16] [17] . However, this research paper provides results based on six VAWT samples each with different cambered aerofoil; the design of aerofoil were varied from symmetric to asymmetric. Six wind turbines 2D models were generated using NACA 0012. Samples were generated by changing cambers with keeping other parameters of aerofoil fixed. After changing camber percentage values from 0 to 1, 3, 5, 7 aerofoils with code NACA 1412, NACA 3412, NACA 5412 and NACA 7412 respectively, were used for comparison of performance parameters. After generation of CAD geometry file, it was exported to mesh module of ANSYS.
2.2. CFD Methodology
Mesh
CFD analysis of VAWT was performed on ANSYS Fluent module. Triangular type mesh element with 108,384 number of nodes and 141,154 number of elements were used for meshing as it is considered more appropriate for 2D model [18] . It can be observed from the Figure 3 that mesh near the VAWT is fine for achieving higher accuracy solution near the wind turbine blades, for this reason minimum element size was used i.e. 0.0035 m. Large domain was used for smooth flow conditions and minimizing the disturbance created by back flow from wall.
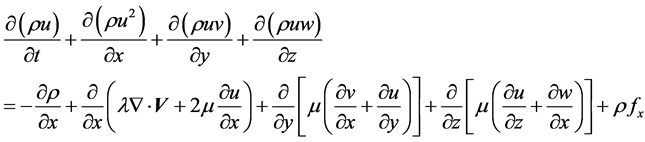
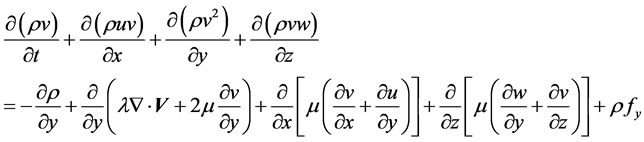
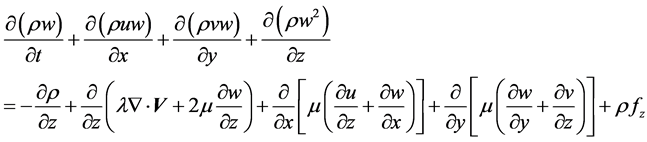
2.3. Theoretical Formulation and Governing Equations Discretization
In CFD we want to compute velocities and pressure at different points in model. For
this we consider a control volume and by using conservation of mass and momentum principle we develop N-S equations as sown by following equations [19]
 (1)
(1)
 (2)
(2)
 (3)
(3)
 (4)
(4)
where  represents density, first viscosity coefficient, second viscosity coefficient and
  are velocity and body force components. N-S equations cannot be solved as it have no analytical solution possible due to non-linear coupled partial differential equations. So we use numerical method in which we find solution at discrete points and use mathematical technique which in case of Fluent is Finite Volume Method (FVM) in this technique calculation is performed at the center of face in 2-D geometric case.
If we solve N-S equations numerically, method is known as DNS which is difficult to compute. To overcome this difficulty we compute average solution of actual solution and this is done by using RANS model in which value of any variable in turbulent flow can be found by sum of mean value plus fluctuating value. N-S equations solved after averaging operation is known as RANS equations as shown in Equation (5).
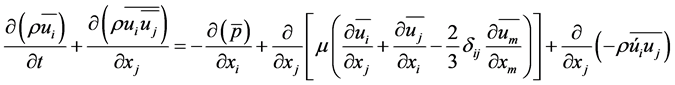 (5)
(5)
where  is Reynolds stress tensor computed by transport equations. Standard k-ε model compute turbulence energy using the transport equation as in Equation (6).
 (6)
(6)
where,  is mean component of velocity,
  is dissipation rate, k is turbulence energy reference and
  is fluctuating component of velocity.
Figure 4 indicates a general overview of RANS approach through the family tree. In this study K-ε model RNG turbulence model was used for N-S equations normalization because of its capability of predicting flow separation, wind velocity and swirl [20] . For solution simple pressure-velocity coupling with Green-Gauss Cell Based gradient discretization was used. Furthermore, second order spatial discretization approach was used for pressure, momentum, turbulent kinetic energy and dissipation rate. Mesh motion was implemented for the blade region whereas outer and inner domain was kept stationary.
2.4. Boundary Conditions
Air is used as compressible fluid flowing around the wind turbine for power generation. Velocity of fluid at inlet was set to 5 m/s and symmetry wall was set to no slip condition. Internal rotor and outer domain was set stationary. Ring containing aerofoil was considered movable with 0.5 and 4 tip speed ratio. Monitors for moment, coefficients of drag (CD), lift (CL) and moments (CM) for individual as well as combined blades was established. Figure 5 provides a visual aid about the data collection procedure from geometry to contour results progression and then data compilation. These steps were followed throughout the study for all the wind turbine samples.
![]()
Figure 4. Scheme of general RANS approach.
2.5. Post Processing
Data for TSR 0.5 was compared with Biadgo, Simonović [2] as a standard and for TSR 4 data was collected directly from monitors. Values for CD, CL, CM and torque was collected for one complete revolution after periodic behavior of residuals was achieved.
2.6. Data Acquisition
Values of lift, drag and co-efficient of moment at different azimuth angles during one revolution collected from fluent was exported to excel. Performance of the wind turbine can be predicted using power, torque and there co-efficient which depends upon area of the wind turbine, velocity and density of the fluid. Torque was calculated using co-effi- cient of torque or moment formula shown in Equation (8) [21] , whereas power was calculated by multiplying torque with velocity. Co-efficient of torque was calculated directly through fluent and forco-efficient of power Equation (7) was used [21] . Angular velocity was calculated using TSR Equation (9) [21] .
 (7)
(7)
![]() (8)
(8)
![]() (9)
(9)
where CP is the co-efficient of power, CM is the co-efficient of moment, A is area of the wind turbine, ![]() is the density of fluid and R is rotor radius. In fluent, coefficient of toque CT and coefficient of moment CM is same and can be calculated from same Equation (8) by replacing M with T.
is the density of fluid and R is rotor radius. In fluent, coefficient of toque CT and coefficient of moment CM is same and can be calculated from same Equation (8) by replacing M with T.
3. Results
Results were collected right after seven revolutions were carried out. By doing this residuals were periodic and convergence criteria was met. Value of CM was obtained using the Fluent directly for all VAWT models for one revolution out of 7 revolutions. Comparison of aerofoils at different cambers were made and it can be observed from the Figure 6(a) between CM and azimuth angle that CM for camber 3 approached the highest value in the graph and CM for camber value 1 is in the lowest point in case of TSR 4.
Torque was calculated by utilizing CM values collected from fluent multiplying with available wind power as in Equation (4). It can be seen from Equation (4) that torque and CM is dependent upon each other so there graph trend will be same but values will
![]()
Figure 6. Fluctuation with rotation angles (a) Co-efficient moment and (b) Torque.
be different. Therefore, it can be visualized in Figure 6(b) that aerofoil NACA 0012 with camber value of 3% is more suitable and will provide best torque as compared to other cambered aerofoils.
Before attempting these simulations, initially the data of the torque of Camber 0 aerofoil with TSR 0.5 was compared with Biadgo, Simonović [2] results of similar camber and TSR values, this was performed as a control simulation. By doing a control simulation, it provides a validation that further prediction are reasonably correct. The comparison data has been flourished in Table 1.
Fluctuation of torque and CM with azimuth angle provide good approximations as viewed from Figure 6(a) and Figure 6(b), that fluctuation is less in case of CL and is maximum in case of C3 aerofoil.
Power values cannot be directly collected from software so it was calculated using torque value from Figure 6(b) numerical data and the angular velocity of the wind turbine. Graph for power shown in Figure 7(a) was generated using torque values of one revolution. It can be observed from the power graph that max power achieved is 130 watt for the case of TSR 4 by C3 cambered aerofoil VAWT model whereas for TSR value 0.5 maximum power is approximately 8 watt. This tells that TSR value changes the power output of wind turbine. CP graph provides a good observation of performance of aerofoil which will provides ease in selecting an aerofoil for VAWT case. Figure 7(b) represents co-efficient of power variations with azimuth angles which represent energy conversion efficiency by wind attacking on aerofoil.
4. Discussion
For each camber, CM data was collected directly from the Fluent and a mean value was used for comparison. Camber effect on CM and torque can be seen from Figure 8(a) and Figure 8(b) respectively. It can be observed that for camber 0 to 3, CM value shows increment however as the camber was increased beyond 3, the value of Cm decreased. Graphs indicate the similar trend for both Cm and torque that is due to dependency on each other both have identical reason for increase and decrease.
The bar chart in Figure 8(a) illustrates the variation in CM by changing the camber percentage from zero to seven. It can be observed that highest CM obtained is 0.089 for the case of 3% camber, whereas, the minimum CM value is 0.031 for 0% camber. Furthermore, chart illustrates that first trend of CM rise fast till 3% and then begin to fall. Chart in Figure 8(b) depicts that change in torque value with different camber value. It
![]()
Table 1. Percentage error of torque between the referenced result and this study.
![]()
Figure 7. Fluctuation with rotation angles; (a) Power and (b) Coefficient of power.
can be seen that value of torque was 4 Nm in case of symmetric aerofoil whereas by varying camber it reaches 10.5 Nm for 3% camber, which is considered optimum. The slight decrease in the trend was encountered by increasing camber percentage further. The torque average values from camber 0 to 7 for TSR 4.0 demonstrate to be within the range as predicted by Beri and Yao [6] which is between −20 Nm to 20 Nm. They are getting negative torque as they are using a non-self-startingaerofoil i.e. NACA 2415, this is also suggested by Micha Premkumar, Seralathan [22] .
The chart in Figure 9(a) depicts the power generation amount at different cambers. It can be visualized that the bar graph peaked from 38 W to 104 W by changing the camber percentage values from 0 to 3. After camber value 3% there is a gradual decline
![]()
Figure 8. Co-efficient variation by camber; (a) Change in moment and (b) Torque.
in the power generated which illustrates that by increasing camber further above 7%, the power generation rate will decrease below 65 W. Coefficient of power is a constant value that depicts conversion efficiency of wind energy to electricity. Figure 9(b) demonstrates the mean CP for different camber values, it can be determined that there is sudden jump in CP from camber C0 to C1 and it kept on increasing till C3 and after that a decline in performance value was observed. This provides result that at camber value 3% can provide maximum electricity generation as efficiency of conversion is at its peak.
It can be seen from Figure 7 and Figure 8 trends that cambered aerofoil C3 behavior is efficient. C5 model generate power near to C3 but difference between maximum and minimum periodic points is greater in C5 case resulting in more variation than C3. Variation from C0 to C7 is due to geometry. As camber increases aerofoil geometry
![]()
Figure 9. Camber variation effect due to changing; (a) Power and (b) Cp.
become more aerodynamic for moving in circular region but further increase in camber decrease performance as geometry become less aerodynamic. This probability occurs due to more drag and early flow separation from aerofoil. Thus, making flow more turbulent and causing interfering towards other aerofoil of VAWT model.
Bar graph in Figure 10 show VAWT performance variation by changing the camber values. It can be depicted that from C0 to C1 there is a sudden jump in performance by 92%, whereas, performance by changing camber from C1 to C3 is 41.6%. However, from C3 to C5 percentage begin to decrease resulting in demotion of performance.
![]()
Figure 10. Percentage increase and decrease in CP by changing camber value.
Table 1 depicts comparison of torque data of individual blade and combined, in case of literature [2] and this research. By initiating a formal planning process, this study involves reference geometry [2] for data comparison. Both have same geometric parameters but this study include more technically refined mesh and major contribution involves multiple sample for extending investigation to cambered aerofoil. Last column on the extreme right in table provides information about percentage error in case of blades. The cause of error is due to difference in number of nodes and elements between reference paper [2] and this study. Reference paper has 84,839 total nodes and 83,641 elements, however, our study has 108,384 no of nodes and 141,154 elements.
5. Conclusion
The camber increment has shown a relative increase in the performance of the VAWT, however, as the camber changes from 3% to 5% a downward trend is observed. This sudden drop in the performance shows that there is a certain limit for elevating the efficacy of the VAWT using camber. The initial increment of the performance from camber 0% to 3% can be due to the changing pressure differential profile around the aerofoil geometry. Furthermore, the drop after 3% camber is due to increased turbulence and flow separation. Future work may involve 3-D analysis of complex model of VAWT.
Nomenclature
![]()
Submit or recommend next manuscript to SCIRP and we will provide best service for you:
Accepting pre-submission inquiries through Email, Facebook, LinkedIn, Twitter, etc.
A wide selection of journals (inclusive of 9 subjects, more than 200 journals)
Providing 24-hour high-quality service
User-friendly online submission system
Fair and swift peer-review system
Efficient typesetting and proofreading procedure
Display of the result of downloads and visits, as well as the number of cited articles
Maximum dissemination of your research work
Submit your manuscript at: http://papersubmission.scirp.org/
Or contact wjm@scirp.org