Integrating Lithostratigraphic Units and GIS-Analysis Techniques to Modified Surface Water Quality Index ()
Received 12 June 2016; accepted 18 July 2016; published 22 July 2016

1. Introduction
Water is one of the most vital substances on earth. All organisms must have water to survive. Jordanian has one of the lowest levels of water resource availability in the world. Access to clean water in Jordan has become increasingly problematic due to climate change and the population doubles as a result of the added pressures of successive waves of refugees living in Jordan, particularly the Syrian crisis that begins from March 2011. Jordan is considered by several experts as the second most water-poor country in the world that is increasingly stressed by the influx of Syrian refugees seeking safety across the border [1] . Jordan relies mainly on ground and surface water for its supply (54 and 37 percent, respectively) [2] . The scarce availability of surface water makes the government authorities dependent on ground water resources to fulfill people needs.
In Jordan, the over extraction of the groundwater resources to meet demand during the last decade, has resulted in water level falls and ceasing off some of spring and base flows. Water has two dimensions that are closely linked―quantity and quality. Water quality is commonly defined by its physical, chemical, biological and aesthetic (appearance and smell) characteristics [3] . Increasing water demand on the existing resources combined with declining rainfall and increasing temperatures as a result of climatic changes causes the most serious problems [4] . Monitoring and assessing the quality of surface water will help protect our waterways from pollution, so the more we monitor our water, the better we will be able to recognize and prevent contamination problems [5] . The water quality evaluation may be complicated practice in compound parameters causing numerous anxieties in general quality of water [6] . The traditional methods for evaluating quality of water for huge samples containing concentrations for many parameters are based on the comparison of determined parameter values with the standard guidelines. Water quality indices minimize the data volume and simplify the expression of water quality status in a single value.
Water quality index calculation is based on different physical, chemical and bacteriological parameters. Examples of different water quality indices developed worldwide are US National Sanitation Foundation Water Quality Index (NSFWQI), Canadian Council of Ministers of the Environment Water Quality Index (CCME- WQI), British Columbia Water Quality Index (BCWQI), and Oregon Water Quality Index (OWQI) [7] - [10] . Water quality indices are categorized into the following four main groups [11] : public, specific consumption, planning and statistical indices. In the recent decades, many studies showed interest in water quality in both surface water and groundwater [12] - [14] .
The first three indices are also called as Expert Opinion (EO) approach. Due to different weights given for the same variables by various panel of experts, EO becomes a subjective approach [15] . Therefore, several alternative indexes were developed. Increasing objectivity and comparability are possible by using statistical approaches because of the similar ratings given by the experts. Statistical approaches are also beneficial in identifying the significance of important parameters in water quality assessment [16] . In order to assess the status of surface waters (e.g., reservoir), specifically under Jordanian conditions, Lithostratigraphic units of the catchment area are proposed as one of the respective major contributors of water quality. So, in the present study, new alternative index is developed by integrating the lithology as a parameter with other different parameters. The pH of a body of water is affected by factors such as the bedrock and soil composition through which the water moves. Some rock types, such as limestone, can, to an extent, neutralize acid, while others, such as granite, have virtually no effect on the pH [17] [18] .
Geographic Information System (GIS) is widely used to monitor of resources of water and has a good techniques to temporal and spatial quality analyze water, where GIS considered useful environment to diverse spatial data and for overlay analysis in spatial register domain to represent spatially variable phenomena [19] - [21] . Therefore, this study seeks to modified surface water quality index by integrating lithostratigraphic units in the catchment area and GIS-techniques, generally intergrated water quality index and GIS technology which are collected different available data of water quality parameters into an easily understood format in GIS environment [22] [23] .
2. Methodology and Materials
2.1. Study Area
The study area is located in the northern part of the Jordan Valley, on the east bank of the Rift Valley. Wadi AL- Arab occupying an area of 265 Km2, and the type of the Wadi Al-Arab is Zoned Rockfill with center core [24] . The delimited between latitudes (32˚43' and 32˚54' N and longitudes 35˚30' and 35˚45') (Figure 1). The area is
![]()
Figure 1. Surface geology of Wadi Al-Arab.
characterized by a Mediterranean type of climate. It is characterized by hot and dry summers, and cool, wet winter. Relative humidity ranges from 49% in June to 67% in February. Average annual of precipitation in the Wadi A-Arab about 400 mm separated between Jordan valley (North Shuneh) and over of highland of Irbid in the drainage area [25] . Most rainfall occurs in October through May, while the dry summer season extends from June until September. Water of Wadi Al-Arab dam is mainly used to irrigate the cultivated lands (agriculture lands) and farms in Jordan Valley, where the reservoir water comes partially from the King Abdallah Canal and partly from precipitation. Generally the lithostratigraphic units covered the catchment area and reservoir site consist of three major formations as the following: Rijam formation (B4), Muwaqqar formation (B3) and Amman/Wadi Sir formation (B2/A7) which mainly consists of Mesozoic to Cenozoic marl and limestone as base rock.
2.2. Method
The data were obtained by ministry of water and irrigation, and these data were selected for investigation, where Water samples from a depth of 0 - 35 cm below. Water Samples were collected monthly during the study period 2012-2014 (in the years 2015 and 2016, the data were not available for use). These samples were tested for physio-chemical parameters and compared with the prescribed drinking water standards by Jordan irrigation water standards. Samples for chemical analysis were taken from the surface water using water Sampler scientific method and kept in polyethylene bottles for further analysis in the laboratory.
The major parameters namely pH, Electrical Conductivity (EC), Total Dissolved Solids, Total hardness, Ammonia, Nitrate and BOD of the samples were analyzed. This study was modified the Indian Water Quality Index by using additional parameters such as calcium and bicarbonate as an alternative to lithostratigraphic units. The Schemes 1 summarized the method of this study.
Generally, based on special conditions in arid and semi-arid areas, such as aridity, rainfall amount and physical characteristic of area, a water quality index needs to be developed and evaluate using new techniques to both of water resources groundwater and surface water. This study has evaluate surface water quality using GIS and parameters which bases mainly on the gradient of the physical and chemical properties, surface geology and land use/land cover of area.
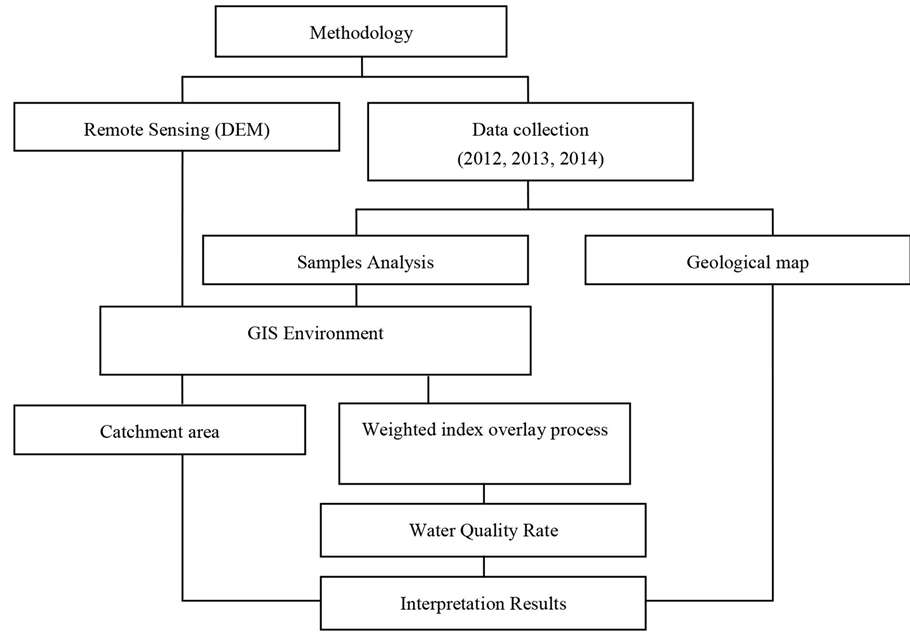
Schemes 1. Methodology of study.
This study used some water quality parameters such as pH, Electrical Conductivity (EC), Total Dissolved Solids, Total Suspended Solids, Ammonia, Nitrate and BOD, as well as carbonate and bicarbonate which represent the impact of surface geology where the major lithostratigraphic units in the area are marl and limestone shown in (Figure 2). It was determined surface geology parameter which covering Wadi Al-Arab through determines the catchment area of water for the area as shown in (Figure 2). The catchment area was extracted using Digital Elevation Model (Remote Sensing data from United State Geological Survey USGS).
GIS and Water index modeling
All the data were integrated using GIS through a weighted index overlay process and score results (sum multiplying of weight and ranking). The rating of theses variable depends on their importance concerning water pollution and Jordan irrigation water standards (Table 1). The general equation for the water quality Index is (Equation 1) [26] .

The variable wi represents how important each parameter is with respect to other parameters, and the ri variable shows how extreme each parameter is within its own subset. Note that a higher WQI means a higher pollution.
Carbonate and Calcium are important factors in area which covered mainly by limestone, where the chemical formula of limestone is CaCO3, therefore these factors play attentions in surface water index, in other hand, different types of rock which existing in catchment area; valley streams and small wadis strongly affect surface quality of water dam through runoff with time. Therefore the equation of modified water quality index is Equation 2:
![]()
![]()
Figure 2. Surface geology of Wadi Al-Arab.
![]()
Table 1. Criterion table showing Weight ages and Ranking assigned for different Water Quality parameters (modified according Jordan irrigation water standards and after Kumar et al., 2013 [26] ).
*Indian index 2013; **Modified parameters.
3. Results and Discussion
Water Quality Index
Water quality index was concluded through integrate the attributes database and temporal data of water quality parameters such as (pH, Electrical Conductivity (EC), Total Dissolved Solids, Total Suspended Solids, Ammonia, Nitrate and Sodium Absorption Ratio (SAR), Bicarbonate and Calcium that were used to generate temporal variation for surface water index Table 2 and Table 3. Based on the variation values of quality parameters, an integrated water quality factor of Wadi Al-Arab was prepared using GIS environment. Thus the WQI is useful and helpful to know the water situation of the study area.
These tables shows the water quality index decreases during years from 2012 to 2014, while increasing in the same year during season from winter to autumn, and these results match with increasing of precipitation during 2012, 2013 and 2014 as shown in Table 4. Generally, the trend of water quality increases in the autumn season. The water quality index values of the temporal variation have been constant increasing after using Bicarbonate and Calcium parameters in the calculations of the modified equation. The elevated values may be attributed to the influence of carbonate stone dissolution and mechanical erosion under weathering conditions that are prevalent during winter season in the catchment area in addition to other parameters on the quality of water using GIS techniques.
The temporal variations of the water quality index before and after development using Bicarbonate and calcium during the period of study are shown in Figure 3. The temporal variations of the water quality index before using Bicarbonate and calcium are known as normal index (N) and termed as modified index (M) after using Bicarbonate and Calcium during three years and seasons.
The results in Figure 3 showed that the values of the modified water quality index is 180 in winter 2012 and decreasing to 165 in the same season of 2013 and 2014. This likely matched to highest inflow for 2013 and 2014, but the lowest in 2012. These low values that occurred in winter 2013 and 2014 are possibly attributed to mixing and dilution processes following heavy rainfall events. The water quality index is 185 in spring 2013, and 165 for 2012 and 2014, the elevated value of spring 2013 may be due to intense rainstorm precipitations during winter and large events of runoff discharged into the reservoir (Table 4), that contributed by dilution processes.
![]()
Table 2. Temporal variation of the water quality index during three years and seasons.
![]()
Table 3. Temporal variation of the water quality index after modification using Bicarbonate and Calcium during three years and seasons.
![]()
Table 4. Effluent and Influent of the Wadi Al-Arab dam (MM3) (JVA [27] ).
![]()
Figure 3. Temporal variation of the water quality index (WQI) before (N; Normal Index) and after (M; Modified Index) development using Bicarbonate and calcium during three years and seasons.
The highest water consumption (outflow) was expected in summer seasons, while the lowest was corresponded with the winter seasons. During the dry periods, water consumption increased exceeding the amount flowed into the reservoir. The elevated water quality index values in summer seasons during the study period may be referred to these conditions in addition to evaporation, and seepage water.
The continuous water consumption concurrent with high rate of evaporation, and seepage water may be responsible for the increasing of the water quality index to 210, 200 and 180 during 2012, 2013 and 2014 respectively. Furthermore, this is also related to the storage at the end of the year during the dry autumn season. In other word, whenever the amount of water stored at the end of the year has increased, the values of the water quality index is increasing, but stay consistently higher than that of the cold water months (Table 5).
The integrated parameters show that the area was classified as the following: very good, good, moderate and poor water quality in the present study, divided them to four classes as the following: <25% very good, 25% - 50% good, 50% - 75% moderate and >75% poor), these range after normalize of modified water quality index values (Table 4).
Based on integrated and normalization processes, most of water quality values are good and only autumn season has poor water quality in the 2012 and 2013, while 2014 has good water quality in the same season. These results can be attributed to number of factors or variables, and test that exceed, or less than the objectives such as the pH, Total Dissolve Solid (TDS), Electrical Conductivity (EC) Sodium Absorption Ratio (SAR).
Finally, quality of water is suitable at least for agriculture use, otherwise, if it’s used to drinking, must be increase treatment process, specifically in autumn season to obtain potable water. This explanation is in agreement with the conclusions of [28] .
4. Conclusions
In Jordan, all the factors that probably affect on the water quality and reduce the use of water in drinking or in irrigation should be taken in consideration. Therefore, in the present study, the temporal variation of major water quality parameters such as pH, Electrical Conductivity (EC), Total Dissolved Solids, Total Suspended Solids, Ammonia, Nitrate, SAR, Calcium and Bicarbonate was analyzed using GIS techniques. GIS can be used as a
![]()
Table 5. Normalization of modified water quality index values.
powerful tool and useful for developing solutions for water resources problems. Moreover, this study shows the impact of Lithostratigraphic units (dissolved and weathered as Calcium and Bicarbonate) parameter on water quality index during 3-years (2012-2014(.
Based on physico-chemical parameters, the calculated values for Indian Water Quality Index over the 3-year study period from 2012 to 2014 were 169, 168, and 157, respectively. But they have increased to 184, 183 and 172, respectively, as a result of incorporated Bicarbonate and Calcium parameters in WQI calculations. The elevated values may be attributed to the influence of carbonate stone dissolution and mechanical erosion under weathering conditions that are prevalent during winter season in the catchment area. The lithostratigraphic units product and GIS technique integration and normalization processes, indicate that most of water quality ranks are good. The analysis shows that the modified water quality values of the WADR vary after using Bicarbonate and Calcium parameters by constant value, in comparison with the World Health Organization (WHO) and Jordanian Standards (JS 286: 2008). Generally, the results signify that the WADR is not polluted based on the physical and chemical characteristics of water.
This study helps us to understand the importance of the rock types or the lithostratigraphic units of the catchment area on the quality of the water as well as to develop suitable management practices to protect the water resources. This study recommends to undertake temporal as well as spatial analysis for water quality by sampling and integrated with GIS techniques.
Acknowledgements
The authors are thankful to Jordan Valley Authority, the Secretary General Eng. Saad Abu Hammour, and to Eng. Fuad Suliman the Head of water Division for their assistance in providing necessary infrastructure to complete this work, and the appreciation is extended to Al-Albayt University and to Dr. Basel Mashaqbah from Hashemite University.
NOTES

*Corresponding author.