Electric Power Quality Analysis 6-10/0.4 kV Distribution Networks ()
Received 2 February 2016; accepted 26 June 2016; published 30 June 2016

1. Introduction
The power sector of the Republic of Uzbekistan as one of the key economic sectors has been developing quite intensively since the country gained its independence and meets the country’s electric power needs. Moreover, the country has become an exporter of electric power by large.
Electric power efficiency is generally defined by such a condition of its consumption that ensures the availability of required quality of electrical energy while minimum production losses will have been inherent to the process [1] .
As any other product, electric power requires mandatory certification and is characterized by certain features such as uninterrupted and simultaneous processes of its production and consumption. Electric power transfer is carried out by consuming certain portion of the product itself, which means the loss of power might be unavoidable.
Among a variety of the existing evaluation criteria of electric power quality there are indices characterizing asymmetrical property of three-phase system of voltage. Two indices of quality such as the voltage unbalance coefficient on reverse-sequence and the voltage unbalance coefficient on zero-sequence (the rated values of coefficients are regulated by GOST 32144-2013 standards) serve as the criteria of assessment of voltage unbalance [2] . Besides, symmetrical components of reverse- and zero-sequence currents, running through elements of an electrical grid, create substantial additional active losses in the electrical grid itself.
2. The Model of 6-10/0.4 kV Distribution Networks
Phase currents- and voltage-unbalances stemming from prevalence of single-phase household appliances turns out to be the main factor having impact on electric power quality and loss in the course of its transfer [transmission] from a production site to consumers. Among the most widely used techniques of calculation of losses of power and energy in electrical grids one could mention the technique of calculation at unbalanced loading which is based on the method of symmetrical components. The 0.4 kV line with single-phase consumers of various power consumption rate (Figure 1), who are evenly distributed across phases, can be considered otherwise as the line with several distributed symmetrical three-phase receivers formed by three groups of single-phase ones of various power consumption rate, the zero-point of which being connected to neutral wire [3] .
Any asymmetrical three-phase receiver can be replaced by an equivalent symmetrical one and two single- phase consumers connected to phase voltage. Equality of voltage and currents at receiver clips and equality of complexes of pulsing power output serve as a condition of equivalence of this replacement.
For asymmetrical three-phase system at receiver clips there are following equations [3] :
 (1)
(1)
where:  are phase voltages;
  are conductivity of phase wires.
3. The Method of Symmetrical Components
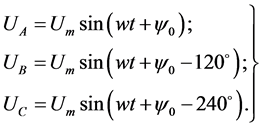
On the basis of the technique of symmetrical components the system of voltage can be presented by three equations [4] - [6] :
 (2)
(2)
where: ψ0 is initial phase of voltage UА.
Proceeding from the method of symmetrical components, any asymmetrical three-phase system can be di-
![]()
Figure 1. The line with single-phase consumers of various power consumption rate evenly distributed across phases.
vided into three symmetrical components: direct-, reverse- and zero-sequence that can be represented by three vector systems:
 (3)
(3)
where: 
Similar expressions can be written for asymmetrical system of currents as well:
 (4)
(4)
Evaluation of asymmetrical values of currents or voltage in three-phase grids is made by means of currents- or voltage-unbalance. Meanwhile, voltage- and currents-unbalance coefficients (the coefficient of unbalance k2, in general) are presented by following equations:
 . (5)
. (5)
where I2, U2 are operating values of current and voltage of reverse sequence and I1, U1 are operating values of current and voltage of direct sequence of basic frequency of three-phase system of currents or voltage.
Loss of power is characterized by the following factor:
 (6)
(6)
where: PN, P1 are losses of power at asymmetric load and caused by currents of direct sequence; K2i = I2/I1, K0i = I0/I1 are coefficients of reverse and zero sequences of currents, respectively; R0, R1 are active resistances of zero and direct sequences for grid section, respectively; I1, I2, I0 are currents of direct, reverse and zero sequences at the same section of grid.
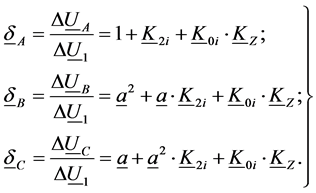
Relative values of phase losses of voltage at certain section of grid are defined as follows:
 (7)
(7)
where:  are complexes of phase losses of voltage at grid section;
  are complex of phase loss of voltage of direct sequence at grid section;
  are complex coefficients of reverse and zero sequences of currents; I1, I2, I0 are complexes of currents of direct, reverse and zero sequences;
  are
are
complex multiplier of turn of vector for 120˚.
4. Monitoring Quality of Electric Power
Researchers in the “Power Plants, Grids and Systems” Department of the Tashkent State Technical University developed the multi-purpose analyzer “MALIKA” [7] . The instrumentation is designed for conducting measurements of indicators of quality of electric power (IQEP) in electrical grids of 220 - 380 V. The analyzer proved irreplaceable for carrying out monitoring and evaluation of electrical power quality by using statistical methods, including at limited product indicators according to the relevant requirements of the GOST standards.
The analog section of the analyzer provides for connection simultaneously of three phases of alternate current. The schematic diagram is shown on Figure 2.
The general view of the analyzer is presented on the Figure 3. The results of measurements provide us with parameters necessary for analysis of electric power quality:
・ Grid frequency f (in Hz), with discretization of 10 seconds;
・ Operating values of voltage U (in V) and current I (in A) across each of 3-phase grid with discretization of 10 minutes;
・ Active P (in kW) and reactive Q (in kvar) power outputs of a first harmonic across each of 3-phase grid with discretization of 10 minutes;
・ Power coefficient cosφ = arctg(Q/P) (angles between vectors of currents and voltage) of a first harmonic across each of 3-phase grid with discretization of 10 minutes;
・ Amplitudes of direct sequence of U1 (V) and currents I1 (A) on each of 3-phase grid with discretization of 10 minutes;
・ Coefficient of unbalance of voltage of reverse K2U (%) sequence with discretization of 10 minutes;
・ Coefficient of unbalance of voltage of zero K0U (%) sequence with discretization of 10 minutes;
・ Coefficient of unbalance of current of reverse K2I (%) sequence with discretization of 10 minutes;
・ Coefficient of unbalance of current of zero K0I (%) sequence with discretization of 10 minutes.
![]()
![]()
Figure 2. General view of the transformer sub-station where measurements were taken.
![]()
Figure 3. General view of the “MALIKA” analyzer.
The analyzer is delivered as a stand-alone unit in plastic casing designed for mechanical and electrical protection both for the analyzer and the personnel who might be operating it. The analyzer is equipped with 3 current- measuring pincers for hookup to current channels in case of its using as a mobile analyzer (Figure 4, Figure 5) [6] . The built-in non-volatile memory provides for storage of data and stores the results of measurements obtained for last 10 days. The face section of the analyzer is equipped with four plugs of voltage and six fixed current inputs. The opposite face section of the analyzer is equipped with the output channel, i.e. the SD card reader.
The methods of quality indices measurement of electric power in electrical grids in systems of power supply of alternating three-phase and single-phase currents with a frequency of 50 Hz are established by interstate GOST 32144-2013 standards “Electrical energy. Electromagnetic compatibility of technical means. The methods of measurements of quality indicators of electrical energy” [2] .
As per the business Contract No. 9/15 of May 25, 2015 concluded with JSC “Tashkent Territorial Enterprise of Electrical Grids”, the authors conducted measurement activities at transformer sub-station No. 399 of the Zangiata district from August 26 to September 1. Results of measurements at the third feeder of this transformer sub-station are presented hereunder. The feeder supplies electricity to more than 50 households [8] .
The results of measurements of power quality given on the Figures 4-10, reveal that quality:
・ against the established deviation voltage doesn’t meet the requirements of GOST standards;
・ against frequency deviation meets the requirements of GOST standards;
・ against the coefficient of distortion of sinusoidal feature of voltage doesn’t meet the GOST standards;
・ against the coefficient of n-harmonic component of voltage does not meet the GOST standards;
・ against the coefficient of unbalance of voltages on reverse sequence does not meet the GOST standards;
・ against the coefficient of unbalance of voltages on zero sequence does not meet the GOST standards.
The analysis (Figure 9 and Figure 10) has shown that this feeder is characterized by the coefficient of unbalance of current on reverse sequence of K2i = 30.3%, whereas the coefficient of unbalance of current on zero
![]()
Figure 4. The voltage curve, the basic frequency considered.
![]()
Figure 5. The currents curve, the basic frequency considered.
![]()
Figure 6. The curve of the angle between voltage and current (cosφ).
![]()
Figure 7. The diagram of change of harmonic of current, the basic frequency considered.
![]()
Figure 8. The curve of change of the coefficient of non-sinusoidal property of current, the basic frequency considered.
![]()
Figure 9. The curve of change of the coefficient of unbalance of current of reverse sequence %.
![]()
Figure 10. The curve of change of the coefficient of unbalance of current of zero sequence %.
sequence turns out to be K0i = 33.5%. Obviously, there is a systematic unbalance on this feeder. Therefore, there is a possibility to lower coefficients of reverse and zero sequences of current down to 15% by merely aligning loads across phases during the evening peak hours. This, in turn, will lead to the decrease in additional losses by more than 30% [8] .
5. Conclusions
Unbalance of voltage at about 2% leads to 4% decrease in service life of transformers, whereas the unbalance coefficient on current at about 10% and more leads to the decrease of service life of isolation of transformers by 16%. Besides, voltage unbalance may lead to lower reliability of operation of household appliances [9] .
Therefore, unbalance of currents and voltages at 0.4 kV grids can be eliminated by ensuring certain arrangements, namely by replacing transformers with the scheme of connection of Y/YN and Y/ZN, redistributing loads of single-phase consumers, etc.
In order to eliminate the existing unbalance of currents and voltages at 0.4 kV grids, it is also necessary to ensure availability of balancing devices.
As the precondition of effective management of power quality one might anticipate means to use the above analyzer designed to carry out measurement periodically (in summer and winter) and on continuous basis.