Hydrological Analysis and Ability Assessing of Flood Gating of Karaj Watershed According to the Form of the Watershed ()
Received 29 April 2016; accepted 14 June 2016; published 17 June 2016

1. Introduction
Flood is one of the disasters which can cause a lot of losses in urban, industrial and agricultural regions in the rivers neighborhood. For reducing losses due to flowage measures such as building floodgates, determining rivers frontage and building overflow species on dams are survivable. One of the necessary steps in accomplishing such measures is to predict how flood overflows and subsides in different sections of river using flowage flow finding procedure [1] [2] .
Flowages cause spiritual and financial losses creation not only in developing countries but in developed and advanced countries and statistics also are indicative of growing process of such phenomena. Occurring several flowages in Karaj that in some cases accompanied with spiritual and financial losses, shows necessity of comprehensive study in the ground of flowage in upper parts of the city of Karaj. Among these flowages can be mentioned 26th of April flowage in 2007 that resulted in flowage entering into Karaj subway station and then its closure. In flowage width not only every zone but also sub zones have its own qualifications that should be surveyed independently [3] - [5] .
2. The Studied Zone
This zone is in the south side hill of central Alborz between 35 degree to 51 degree geographical coordinate, 51’ to 36.11 of northern phenomena this region is limited to water division line of Caspian sea latrine zone revers from the north, Ghazvin plain from the west, low depth stone height from the south and Robat karim and Tehran lain from the east and eastern south. 61% space of this zone is in the height of more than 2500 meters from the sea surface. The highest height is more than 4000 meters in the north of that and the lowest height is 1320 meters, in the limitation of down dam. The average height of zone is 1600 meters from sea surface [6] . Karaj aqiferous zone is of Salina aquiferous zone main subzones (Figure 1).
3. Materials and Procedures
Recognition of zones and subzones states is between the categories that recently have been discussed in aquiferous studies. In this survey, topographic plots 1:50,000 of Armed forces geographic organization and plots of 1:250,000 to study the region geological state were used. Likewise by WMS software, its zone and subnets related classification specified, then plots related to region slope directions, flow accumulated hydrological model, surfaces plots were prepared using DEM in GIS software.
Then centralization time, delay time and flow continuance curve in 365 days of a year identified. Then the whole zone divided into 4 sub zones and data related to zone form in SPSS software in process factorial analysis way and correlations related to zone form were specified, 4 factors of the highest form correlations and subzones interior specification were selected (Table 1).
Zone surface waters net is graded on the basis of the branches number and the grade of each studied hydromorphological unit is inserted in the chart upon this study subzones number 1 and 2 also has grade 3 waterway. Waterway but subzone number 3 and number 4 don’t have grade 3 water way.
In hydrological studies zone form check is very important. Likewise zones form are affective on flow water amount and flowage creation due to showering rains. Depending on zones form, flood continuation and peak Debi situation would be different. Compression and form coefficients were used to recognize zones forms compression coefficient:
Compression coefficient for the whole of zone is 2.10 upon the accomplished assessments, thus the studied zone has an oblong and rectangular oriented form.
3.1. Form Coefficient
Using this factor a relation between zone form and centralization time can be acquired.
Amount of (shape factor) for the whole zone: 4.67
Amount of (form factor) for the whole zone: 0.21
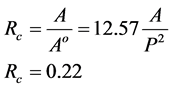
3.2. Gyrate Ratio
Gyrate ratio of Rc zone is space ratio of the zone A to gyrate space Ao that its perimeter is equal to zone perimeter P:
3.3. Elongation Ratio
Elongation ratio in a zone is equal to hypothetical circle diagonal ratio that its space is the same as the zone in zone length, whatever elongation amount is more centralization time is more.
Elongation ratio of the whole zone: 0.55
Checking zone height situation and its affect on flow water amount:
On the zone height surfaces plot maximum zone space is in 3000 - 4000 meters height surfaces (Table 2).
![]()
Table 1. Classification of water ways, water ways length amounts, drainage compression and hydromorphological units branch ratio.
3.4. Checking Region Slope Situation and Its Role on the Zone Hydrology
Upon the studied region slope plot, east and west height of the studied region has the most amount of slope and the south and meddle parts of the region has the least slope amount (Figure 2 and Figure 3 & Table 3).
![]()
Table 2. The chart is related to height categories space, space percent, age study region aggregation percentage.
![]()
Table 3. Direction category and space.
3.5. Flow Aggregation Condition Hydrological Model
Upon the prepared schematic model, water aggregation flow or water flow amount in waterways is presented in a plot. Numeral value of each pixel is calculated from zone origin to its egression. Upon that the least amount of water flow is in flow origin and the most amount of it is in egression parts (Figure 4).
3.6. Centralization Time of the Studied Zone
Maximum time is utilized that lasts water to traverse its furthest zone part or hydrological direction and reach to egression part is called centralization time.
Software in Kripech method was used to calculated centralization time.


3.7. Delay Time
Delay time is the time distance between downfall center until hydrograph dimex time.


3.8. Zone Hydrograph
Figure 5 and Figure 6 show that downfall duration is equal to centralization time.
Totally subzone 4 has more vulnerability and floodgating potential due to standing in downflow and reducing the numbers of branch and lowering water way length. Subzone 3 is the second order because of lower branch ratio and standing in downflow parts and sudden reducing slope (Table 4 and Table 5).
![]()
Figure 4. Flow aggression hydrologic model.
4. Conclusions
Generally Karaj zone has a relatively elongated form first the whole zone were checked and specified that this limitation has a high floodgating potential noticing to zone form and waterways centralization [7] .
Then delay time and water centralization time in whole zone were calculated. And Karaj aquiferous zone divided into 4 subzones and drainage centralization, space, branch ratio and waterway length were processed and by regarding to their correlations in the aspect of SPSS internal shape each one specifically the charts related to them were prepared by factor analysis in the zone.
In these charts specified that subzone 4 then subzone 3 have higher floodgating potential compared to subzones 1 and 2 in the aspect of form and internal specifications.
Thus it seems that flowage effluence projects have more concentration on these subzones. Identifying subzones have most affect on studied limitation floodgating gives a chance to programmers reduce zone flowage debris by aquiferous measures and begin flowage management from higher part of zone.