An Analysis on the Relative Efficiency of Furniture Enterprises in Guangdong Province Based on DEA-BCC and Clustering Method ()
Received 21 March 2016; accepted 24 April 2016; published 27 April 2016

1. Introduction
China’s furniture industry has rapidly expanded since 2000. Furniture production in 2013 reached 323 million units. China has become the world’s largest furniture manufacturing and exporting country. In the furniture industry, there are about sixty thousand furniture manufacturing enterprises and 37 furniture industrial clusters distributed in the Pearl River Delta, the Yangtze River Delta, the southwest region and the areas surrounding Bohai Sea. After three decades of reform and development, Shunde is the earliest development area of Chinese furniture industry, which has more than 5000 furniture enterprises and forms a complete industrial chain and mature industry environment. However, due to the rising costs of labor, land and the decline in both foreign and domestic demand, Guangdong furniture industry cluster competitiveness begin to decline.
The furniture industry has a very high degree of industry relevance and long industrial chain, which is very easy to form regional advantages and industrial clusters. As an efficient way of production organization pattern, industry cluster effectively combines the advantages of industrial development and regional economic development, and enhances the competitiveness of the region and the country. Evaluating the performance of industrial cluster can be investigated from two perspectives: one is to evaluate the influence of industrial cluster on the economic growth of the region; another perspective is to% evaluate the effect of industrial clusters from the enterprise operational efficiency. Study on the performance of the industrial clusters mainly focuses on the connotation of industrial cluster performance, the selection principles for index, construction of index system, influencing factors, evaluation method, etc. Baodong Cheng [1] uses EG index to measure the industrial concentration ratio of furniture industry cluster; the measurement results point out that the disadvantages consist of three points: low production specialization, serious product homogeneity, imperfect supply chain system. Lu Jie [2] built the evaluation model of the competitiveness of the furniture industry cluster, and made comprehensive evaluation on the economic efficiency of industrial groups. Gang Tian et al. [3] based on the research of supply chain, introduced multi-stage dynamic fuzzy comprehensive evaluation model, and developed supply chain performance evaluation of furniture industry cluster. In this paper, we use DEA and K-means clustering analysis method to analyse the operational efficiency of enterprises in the furniture industry cluster, make classification for the enterprises with different efficiency and give some advice for every enterprise to provide theoretical guidance for the development of Guangdong furniture cluster enterprises.
2. Evaluation Model
2.1. DEA-BCC Model
Data envelopment analysis (DEA) is one of comprehensive evaluation methods, using mathematical programming to analyze the same type units (departments or enterprises) relative efficiency, and each decision-making- unit (DMU) has multi-index inputs and multi-index products. According to the evaluation efficiency direction of DEA, the model can be divided into two types: input oriented model (Efficiency Input-Based) and output oriented model (Efficiency Output-Based); Input oriented model reduce inputs in the case of constant output, output oriented model increase outputs in the case of constant input. DEA can also be divided into constant returns to scale model (CCR) and variable returns to scale (BCC) model: CCR Model, raised by Charnes A., Cooper W. W. [4] , assume that all DMUs are in the optimal production scale, Using the linear programming method to get the efficient frontier and to calculate the relative efficiency of each DMU; BCC model was invented by Banker R. D., Charnes A., Cooper W. W. [5] . They increased the convexity assumption on the basis of the CCR model, that is,  , and decomposed the efficiency into scale efficiency and technical efficiency further, Comprehensive assess the current efficiency of DMU and give direction to improve. Its model is as follows:

In this formula: suppose there are j decision making units, m and t respectively indicate the quantity of input index and output index, these DMUs that contained m kind of inputs  produced t kind of desirable outputs
 .
.
This paper analyzes the efficiency of furniture enterprises by using the BCC model, and the efficiency can be divided into technical efficiency, pure technical efficiency and scale efficiency. 1) Technical efficiency can be measured by the ratio of output/input, used to assess whether furniture enterprises with the least input to achieve maximum output, When the technical efficiency value is 1, the production technology of the enterprise is in the best state, while the technical efficiency value is less than 1, which indicates that the technology is not efficient. 2) Pure technical efficiency does not contain scale efficiency, analysis the resources allocation of furniture enterprises in the case of constant returns to scale, which is to measure whether the furniture companies to minimize the cost of investment portfolio to engage in production in the short term. 3) Scale efficiency is the ratio of resource input and output, scale efficiency value of 1 indicates that the furniture enterprises to achieve the optimal level of scale, at this time, furniture enterprises increase resource input and output proportionally; if the scale efficiency value is less than 1, which mean that the companies do not reach the scale efficiency, additional inputs and output disproportionately. 4) The relationship between technical efficiency, pure technical efficiency and scale efficiency is that technical efficiency = pure technical efficiency * scale efficiency. If the pure technical efficiency value is greater than the scale efficiency value, we can get the message that the scale factor is the dominant factor of the inefficiency of the furniture enterprises. If the scale efficiency value is greater than the pure technical efficiency value, it shows that the main reason for the inefficiency of the furniture enterprises lies in the low efficiency of resource allocation, this is, redundant input or insufficient output.
2.2. K-Means Clustering
Cluster analysis is one of the most widely used classification methods in multivariate statistics, according to the characteristics of things and certain category of the criteria, to study the classification of things. The clustering of observation samples mainly includes hierarchical clustering method and fast clustering method. Fast clustering, also known as K-mean method, is suitable for the analysis of a large number of sample data. It regard the sample as a point in K dimensional space, which take distance as the index of the samples’ closeness. First, it select a number of aggregation points according to a certain method, second, condense the sample to the nearest aggregation point, constitute initial classification, last, modify the classification according to the principle of the nearest distance until reasonable.
2.3. Research Design
3. Analysis Process and Results
3.1. Sample and Variable Selection
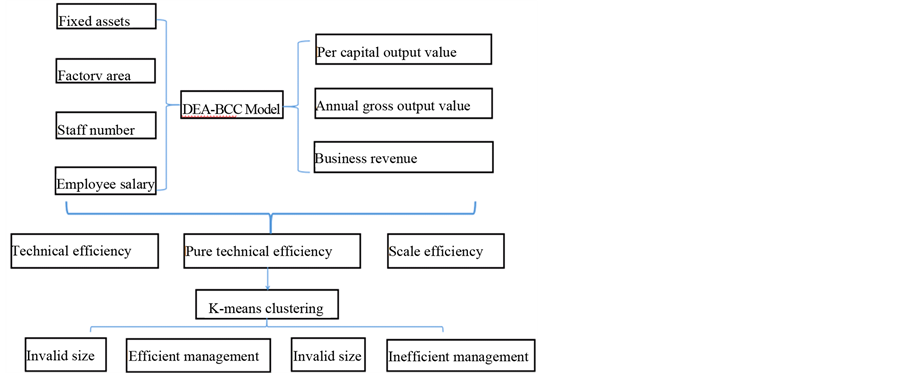
Under the assistance of the Shunde Wood Industry Association and the Shunde Furniture Association, through the field research of enterprises in Lecong and Lonjiang, Guangdong furniture professional town, we got 129 representative samples. First, selected fixed assets, factory area, staff numbers, employee salary as input indicators and per capital output value, annual gross output value and annual operating income as output indicators. We choose Max DEA 6.2 to calculate the relative efficiency of furniture enterprises and use K-means clustering analysis method of spss 20.0 to divide the enterprises into different types based on the characteristics of technical efficiency and scale efficiency, last propose recommendations for each type of enterprise.
3.2. DEA Efficiency Analysis Results
We obtain the technical efficiency, pure technical efficiency and scale efficiency of 129 enterprises with the DEA-BCC model, This paper gives a summary of the characteristics of the DEA efficiency of furniture enterprises in 2014 (Table 1). We have obtained the following conclusions: 1) Technical efficiency is too low. Only 57 companies achieved DEA efficiency, including scale efficiency and technology efficiency, which is show that the extensive mode of development of the industry has not yet changed. In addition, these enterprises have a large difference in efficiency value, which give the signs that enterprise operating conditions in the industrial cluster began to polarization, some enterprises, which rely on cheap labor to gain competitive advantage, has begun to decline. 2) The average value of the scale efficiency is greater than the average value of technical efficiency, we can come to the conclusion that the management ability and technical innovation ability of furniture enterprises are insufficient. 3) Standard deviation of efficiency value is larger, there are 18 enterprises with the comprehensive technical efficiency value in [0, 0.3), 30 enterprises with the comprehensive technical efficiency value in [0.3, 0.6), 24 enterprises with the comprehensive technical efficiency value in [0.6, 1), 57 enterprises with DEA efficiency, which is reflected that the efficiency value of the sample enterprises is more volatile. It is necessary to use the cluster analysis method to explore the reason of the difference of efficiency.
3.3. K-Means Clustering Analysis Results
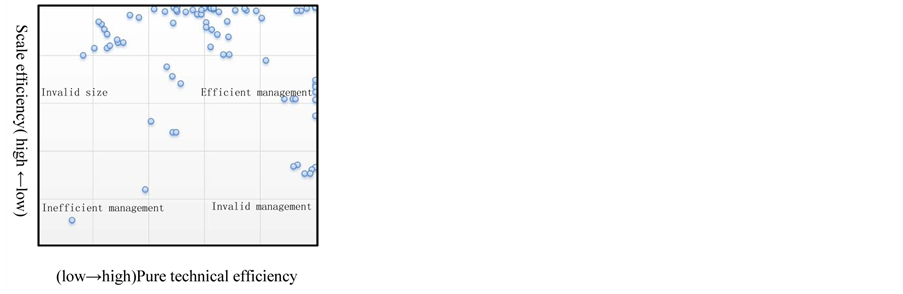
In this paper, the pure technical efficiency and scale efficiency are selected as the variables of cluster analysis. Make the K value of 3, 4, 5, obtain the initial clustering centers and the final cluster center table, contrast the analysis of variance table, we can see that when the K is 4, the average variance of the group is the least. The significant level is higher, and the clustering result is more effective.
![]()
Table 1. The efficiency value of furniture cluster enterprises in 2014.
From the initial cluster center table and the final cluster analysis table, There are 9 enterprises in Category 1, pure technical efficiency and scale efficiency values is very low, and the comprehensive technical efficiency values is low too, these enterprises was in a low-efficient circumstance, take sample No. 42 enterprise for example, its pure technical efficiency value is 0.487, which is shows that more than half of its existing inputs are redundant and wasteful. The scale efficiency value is 0.477, Indicated that the existing scale of the furniture enterprises is far from reaching the optimal economic scale. The comprehensive technical efficiency value is only 0. 232, which is show that the enterprise’s input and output is not valid. Finding out the reasons for the waste of resources is the best way to improve the operational efficiency.
There are 39 enterprises in Category 2. Its pure technical efficiency value is low, but the scale efficiency value is close to 1. The reason that caused the collapse of these enterprises is inefficient management, that is, the existing portfolio is not optimal. The key to improve the efficiency of the enterprise should be based on the slack variables of the BCC model, such as: adopt automation to reduce personnel’s input, increase capital leverage, so that furniture enterprises should strive to improve the quality of employees, and the efficiency of the use of furniture enterprises funds.
There are 15 enterprises in Category 3, in contrast to class 2, the pure technical efficiency value is close to 1, but the scale efficiency value is so low, which is shows that the production of these enterprises have not reached the optimal scale, this is, the existing scale does not match the best level of input and output, so the focus is to adjust scale. May be the size of the furniture business is too small, which has not yet played scale effect, or the furniture enterprise expanded into the bottleneck period, it is bound to require a large number of new fixed assets, these cost is difficult to be shared by sales revenue in the short term, and thus the scale of income may decline.
There are 66 enterprises in Category 4, the value of pure technical efficiency and scale efficiency are all close to 1. the furniture enterprises is not only DEA comprehensive efficient, but also technically efficient and scale efficient, among these enterprises, we can no longer improve efficiency by the allocation of resources and adjust the size of the enterprise. The efficiency of these furniture enterprises in the industrial cluster is in the leading level, the existing input and output has reached the optimum combination. Their management experience can be used as a benchmark for other enterprises.
3.4. Conclusion
In summary, the way to improve the efficiency of furniture enterprises must be based on the difference of furniture enterprises. Management inefficient and scale inefficient furniture enterprises in the industrial cluster are in a larger proportion, entrepreneur should analyze the specific reasons for the failure of resource allocation and management technique. It is the key to improve the operating efficiency of furniture enterprises with the improvements of the existing input-output combination and the reduction of resources waste.