Received 10 February 2016; accepted 18 April 2016; published 21 April 2016

1. Introduction
Dessication cracking may be perceived as a two-fold process that entails the gradual loss of moisture from an initially saturated porous body, in this case a soil and after surpassing a threshold tensile strength, culminates into germination, propagation and widening of cracks with subsequent reduction in soil volume. [1] [2] describe this as a three-stage process: initial, primary and steady states. Several intrinsic factors like: particle size distribution, degree of saturation, presence of occluded void spaces, tensile and inter-aggregate cohesion forces are attributable to initiation of cracking in soils. Despite much research work on soil cracking phenomenon over the last decade, little has been reported on accurately predicting and localizing crack offset points as well as on geometry and direction of propagation. Other studies on crack growth and propagation have applied stochastic models [3] or physically based model [4] - [6] However, much of these investigations [7] - [9] have been qualitative and qualitative in nature and largely restricted to describing desiccation cracking as a phenomenon and not a dynamic process. Soil cracking therefore, has been described in terms of its functional properties: enhancing preferential flow for soil nutrients as well as pollutants in clay liners [10] or as in controlling both slope stability and those of built structures.
The complexity of dessication cracking in soils can better be understood through the Fractal Dimension. This approach seeks to characterize complex patterns at the Representative Elementary Volume (REV) and quantifying them as ratios of change from the micro-to mega-scale. It is based on the premise that dessication cracks do not exhibit typically Euclidean or topological dimensions in space and so fractal indices may only be expressed as non-integer values. Cracks are more or less curvi-linear and would necessarily have a dimension greater than 1 and less than a 2-dimensional square and this is the in-between Hausdorff-Besicovitch dimension.
The paper presents an approach based on the fractal dimension fd, that describes the spatio-temporal and dynamic change of crack development in a Black Cotton clay soil (Eutric Verticsol) extruded from along the banks of River Nile in Juba, South Sudan. The objective of the paper was to describe the cracking phenomenon during dessication in a Eutric Vertisol sample using: Crack Intensity Factor (CIF), Crack Area (CA), density functions f(l) and f(W) as indicators for both crack length and width respectively. The results of this study are expected to deepen our understanding on crack development as a dynamic process.
2. Materials and Methods
2.1. Study Area
A black-cotton clayey soil (vertisol) collected from the Lologo residential area at 4˚48"40.15˚N and 31˚35"28.41˚S of RejafPayam in Juba County, Central Equatoria State (CES) of South Sudan was used. This soil is widely distributed along the banks of the River Nile. The soil chemical and physical properties are listed in Table 1. The collected soil was placed into 35 cm × 20 × 8 cm half-cut plastic containers, air-dried and the clods crushed to aggregate size of 2 - 5 cm in diameter. The saturated slurry specimens were prepared by mixing the dry soil with ordinary tap water till the liquid limit was attained. The measured water content of the slurry was about 48%. The entrapped air bubbles in the slurry were removed by gently shaking it for about 5 minutes and allowed to stand for the next 48 hours prior to commencement of the readings. The final thickness of the slurry was about 5 cm. Finally, the prepared samples were exposed to room conditions (temperature of 35˚C ± 1˚C, and relative humidity of 40% ± 5%) for dessication and drying. Daily soil water content in the samples during dessication cracking was read out using a 4-pin Eijkelkamp soil moisture sensor Theta-probe, measuring range 5% - 55% of volume percentage soil moisture and accuracy ±5%.
2.2. Image Pre- and Processing
Image preprocessing entails the accurate recognition and delineation of a defined target object from its immediate background. The target object is characterized by distinct color or shape and distinguishable from the immediate background. Firstly, photo image of a soil sample was captured using a 10 MB Samsung 5x digital camera and the digital image converted into a two-dimensional black-white image using the Windows Live photo gallery. Further black-white image refinement and delineation was done using the Photoshop Elements Editor 8. In this way, the target object (crack/s) was later on extracted from the picture using the Fractal3e software of the National Agriculture and Food Research Organization (NARO), Japan that numerically analyzed the target object and converted it into a binary image. In the binary matrix, image processing involved setting the
![]()
Table 1. Chemical and physical properties of the remolded vertisol (Eutric Vertisol).
*Source: Harmonized World Soil Data (HWSD) viewer 1.2.
digital image to gray scale where the background was first represented as black pixels and set at 0 with the corresponding target object (crack) set at1 and later on reversed. Fractal dimension, box size versus count and length of black were then estimated.
Soil cracks exhibit highly irregular patterns (width, length and network) that are difficult to measure with conventional methods. However, digital image processing techniques owing to their accuracy and non-destru- ctive nature are now gaining popularity [11] . In our study, the image-processing was used to estimate crack parameters (fractal dimension, crack width and length). The procedure is described below:
1). The captured colored image (crack) was converted to a black-white image using the Windows Live Photo gallery.
2). The black-white image was further perfected using the Photoshop Elements Editor 8.0 where the black areas represented the cracks and the white areas represented the background image.
3). The binary image was then filtered to remove any grey areas into an exclusively black-white binary image and the fractal dimension estimated.
4). The binary image was then skeletonized by thinning method of medial axis transformation.
5). The crack length was then estimated from the thinned image.
6). The crack width was estimated by averaging the width of three randomly chosen points across of a crack.
2.3. Box Counting Method
Other than the Gaussian convolution and correlation methods, the box counting method provides one of the widely adopted algorithms for estimating the fractal dimension of a binary image. Box counting principle is based on the premise that a number of square boxes N with side length s will be required to fully cover a binary object recorded as N(s) and the reciprocal of box size as 1/s. This procedure is repeated iteratively and the fractal dimension is then expressed as the slope of log N(s) versus log 1/s:
 (1)
(1)
2.4. Median Filtering
This image analysis is based on an algorithmic technique called “Median Filtering”, that first calculates all pixel values from the surrounding neighborhood by sorting them into an ascending numerical order and then replacing the pixel being considered with the middle pixel. The noise or an unrepresentative pixel peak in the binary image can then be reduced or smoothened with a correspondingly sharper acquisition of the image. By median filtering, all isolated black and grey points in the vicinity of the object image (crack) were erased as this would exaggerate the pixel number of the object image. The crack is then thinned by reducing the number of pixels to a single pixel thickness along the medial axis that approximates the center skeleton of the object image. Thinning is a morphological operation that is used for skeletonization and is applied to remove selected foreground pixels from binary images while maintaining the fundamental morphology and skeleton of the binary image as single pixel lines [12] - [14] . The thinning operation was preceded by image filtering that initially removed any slight irregularities and isolated black spots within the vicinity of the crack. Without filtering, this would otherwise exaggerate the pixel count especially during estimation of crack length that is based on single pixel lines. However, repeated filtering was often less effective since this led to dismemberment and dis-connectivity of especially fine cracks from the mainly larger ones resulting into the development of structural pattern known as Fournier dust that comprised isolated pixels in the digitized image
2.5. Crack Area (CA), Crack Length (lCR) and Crack Width (wRC)
The CA was estimated as the percentage ratio of the cover or bright difference of the binary image to the total surface area in pixels as:
 (2)
(2)
Meanwhile, the Crack Intensity Factor (CIF) was assessed and expressed as the ratio of CA to the total surface area of the soil. According to [15] , the area of cracks from a digitized binary image was estimated by considering the total length of single line pixels and converting that into (cm²). The obtained crack area was then logarithmically transformed and expressed as Log (Crack Area). With this transformation, a causal relationship with the moisture content in the soil sample was estimated and expressed as a function of time. This then gave us an idea not only of the dimension or extent of crack propagation, stage of “cracking stability” but also the volumetric soil moisture enhancing crack development during dessication.
Crack length is defined as the cumulative length of the crack medial axis pixels between two nodes. In order to better assess the crack length, the crack image was first filtered and the one-pixel thickness of the entire crack segment determined. The choice of medial axis of the crack representing the middle pixel of the entire crack length is necessary since a crack naturally has irregular and non-uniform shape with constricted and enlarged portions along its length. For a crack that is constricted at certain points along its length, the thinning procedure may dismember the crack thereby generating a breakage. This procedure may tend to reduce the total crack length, contrary to the tenets of image thinning which suggests that thinned binary object must still show similar geometric as well as topological characteristics as the original object.
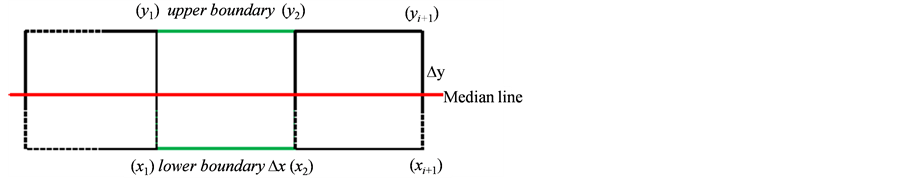
The study here provides a method for estimating the crack length during desiccation. Consider after thinning and filtering of a digitized image with a crack represented as consisting of single adjoined square pixels having a lower boundary (x1, x2....xi+1) and an upper boundary (y1, y2....yi+1). The area A of each single pixel may then be expressed as  with
with  as total area of n pixels representing a crack. Assuming that a crack is curvilinear, the length of the lower and upper boundaries will not be equal, however, for simplicity purposes, this is ignored. The total number of m pixels in the digitized image will be represented like the modified equation as used by [16] as:
 (3)
(3)
where (i + 1) is the next node of the pixel square. The total length lCR of the crack represented as the ratio of n to m pixels as:
 (4)
(4)
The average crack width  was defined as the summation distance between two boundary pixels passing through a medial axis of a crack. The
  was determined from three randomly chosen points from a specific crack representing the shortest, medium and widest segments. Readings of the crack width during dessication were carried out by visual inspection and measured using an ordinary measuring tape at the chosen specific points. Other geometric parameters that can used in characterizing the surficial cracking or morphology of cracks are the: average connectivity
  and average numerical crack number
 . Here, the average crack
number  as a function of time f(t) was expressed as:
  where n is the number of cracks
having similar crack width.
Meanwhile, the average crack connectivity maybe defined as the number of non-redundant loops enclosed by a specific geometric shape [17] , and the average numerical number as the number of networks per unit volume [18] . In our case we also used the density function of crack length, f(l).The density function is a very useful statistical approach that was used to describe the increase in crack length during soil dessication and to establish whether or not this followed a normal distribution pattern. The physical significance of the density function crack length increase that is skewed and not normally distributed is that, crack length increase would be exponential indicating rapid increase during the first days of dessication or otherwise this increase is gradual and slow. The density function is expressed as:
 (5)
(5)
Where s and mare the standard deviation and mean values respectively. Similarly, the density function of the crack width f(W) was expressed as:
![]() (6)
(6)
3. Results and Discussion
Visual observation (Figure 1) showed that crack patterns generally had a “T” shape at intersection nodes with secondary cracks perpendicular to primary propagating cracks, especially during the first crack segments and early stages of dessication. This is attributable to growth of cracks in the direction perpendicular to the local maximum tensile stress [19] - [21] . Although the crack pattern at the intersection nodes gradually assumed a more “Y” shape in the second crack segments, such crack patterns did not necessarily follow a strict “T” and “Y” sequence during crack propagation.
Thinned and skeletonized images of cracks during dessication are shown in Figure 2. In day 1 most thinned images of cracks are shown as simple discontinuous that gradually merged with each subsequent day of dessication. The contrast between the black binary image with its immediate background for example in days 4, 6, 8 and 10 were a result of poor quality of the original photo images captured that could not be adequately thinned and skeletonized.
From Table 1, it was found out that the fd prior and after thinng procedure positively correleted with the Cover or Bright/Difference and best expressed using an exponential function: y = 0.0841e0.0029x at r2 = 0.69 suggesting that increasing fd was directly associated with increment of black coverage and therefore of crack length in the digitized image during dessication. This was also corroborated with the increasing value of CIF especially between day 1 to day 8.
Cracks in Soil
The log of crack area versus SMC (q) during drying of chosen soil specimen as a function time is shown in Figure 3. The results indicate that log CA increased quickly with decreasing SMC during the early stages of cracking. The CA of 967.5 cm2 on day 1increased at an estimated rate of 2 cm2/day till day 5 and decreasing at an increasing rate of 1 cm2/day to CA 53.334 cm2 on day 6. However, upon further drying the rate of CA increase started to decline and gradually reached stabilization on day 7. This observation is consistent with earlier
![]()
Figure 1. Sequences of crack formation and propagation during dessication of a chosen sample of Vertisol.
studies on desiccation cracking behavior of polypropylene fiber-reinforced clayey soil [19] [22] . This stabilization in crack area was approximated as the intersection between the log of crack area and soil moisture content lines. However, visual inspection of cracking during dessication showed that stabilization was attained on day 4 and no new cracks developed, rather the widening of pre-existing cracks as from day 8 till end of experiment on day 32. It can be mentioned that, crack initiation and propagation stopped at about SMC 37% enhancing only the widening of pre-existing cracks.
Dessication time versus CIF or Cover/Brightness for the chosen soil specimen is presented in Figure 4. It showed that, the CIF developed gradually between 0% to 1% during the first 4 days and experienced a rapid growth between day 4 to 8 and attained peak value of about 6% and about 11% (Cover/Brightness) during day 8. This accounted for about 98.6% of all cracks that developed between 45% SMC at the onset of drying to about 35% 8 days later. After day 8, there was a rapid CIF decline to about 2% and Cover/Brightness (about 5%) at SMC 28% and gradually decomposed over the entire experimental period to a value between 1% and 2% for the
![]()
Figure 2. Thinned and skeletonized binary images of crack pattern formation in soil sample 2 of the Eutric Vertisol.
![]()
Figure 3. The changes of crack area CA with soil moisture content during drying of a Eutric Vertisol sample.
CIF and between 3% and 4% for Cover/Brightness respectively. Our study also showed that, estimating the CIF from thinned binary images through the pixel count as well as the Cover/Brightness generated by the software were adequate and showed similar decomposition over time, although with an order of magnitude of 1 - 2 between them. The SMCs that enhanced initiation, rapid propagation and development of cracks during the first 1 -
![]()
Figure 4. Variations of the CIF at different soil moisture contents with time.
4 days are herein referred to as critical soil moisture contents analogous to the critical suctions employed by [22] . As aforementioned, the Crack Intensity Factor (CIF) of a digitized binary image was determined and expressed as the ratio of the surface area of the cracks to the total surface area of the binary image of the soil specimen.
Variations of the SMC with the fd are shown in Figure 5. Low fd values between1.2 to 1.3 were observed at high critical SMC value of about 45% during day1 on the onset of cracking. At day 2, the SMC at about 42%, gradually decreased with concurrent increase of the fd to between1.4 to 1.5. With each proceeding day at day 4 to 8, the SMC decreased to about 35% with fd increase to about 1.7 as dessication cracking proceeded and the number of cracks increased [23] until a peak fd value between day 8 to 10 was attained. With further decrease in the SMC during day 10 to day 32 from 28% to16%, the fd correspondingly decreased from about 1.7 to 1.3. Fractal dimension can be treated as a measure of soil cracking during drying of the soil sample and is therefore not invariable. It increased to a peak value once maximum threshold value of cracking was attained and subsequently decreased. Our results showed that fd had both spatial and temporal variability implying that the fractal
behavior of cracks at time (t1) was constant over a given crack length ![]() which corresponded to a fractal
which corresponded to a fractal
dimension (fd1) and changed at time (t2) over yet another crack length ![]() that corresponded to a fractal
that corresponded to a fractal
dimension (fd2) and so on. Lower fd values closer to 1.0 during the first days of dessication cracking would in this case suggest crack pattern homogeneity with gradual transition to a more heterogenous crack pattern with fd values closer to 2.0. The fd downturn from 1.7 to 1.3 at day 10 to 32 suggested crack pattern homogenization as the soil dried up with widening of pre-existing cracks. Obviously, the low quality digitized crack images that were captured at day 10 to 32 showed more grey-black shades and without thresholding (thresholding is a procedure that transforms grey or color image objects into black and white), where further filter and skeletonization procedure tended to generate poor images. Continued filtering and skeletonization only led to more detached and isolated black spots along the crack length (Fournier dust) which reduced the fd value. Our results confirm that low fd value at the onset of dessication cracking characterize a more homogenous, simple curvi-linear crack patterns that with increasing fd value toward a more heterogenous and differentiated crack patterns.
According to the fractal theory, the relationship of log N(s) is linearly related to log (1/s) so that the correlation coefficient denoted as the slope is the fractal dimension fd. As illustrated in Figure 6, the fd before and after thinning of the binary image in the thirty days of dessication cracking was shown with fd values prior to thinning slightly higher than those after, although with no significant differences. Slight fd differences were evident at lower log (1/s) values which then merged at higher log (1/s) values. This “bifractal” behavior may be attributable to the presence of multiple black spots that necessitated a higher pixel count and so higher fd values prior to thinning. Both fd values prior and after thinning tended to merge at higher log (1/s). This could be as a result of widening of pre-existing cracks that yielded higher fd values and so were equal in magnitude to those fd values prior to thinning. All correlation coefficients estimated by the Fractal3e software and based on the fractal theory
![]()
Figure 5. Variations of the SMC on the fd during dessication cracking of a remolded Eutric Vertisol. (Blue lines indicate the 95% confidence level).
![]()
Figure 6. The relationship between log N(s) and log (1/s) showing the fractal dimension fd before and after thinning of binary images of cracks during dessication of a remolded vertisol.
![]()
Table 2. Parameters of dessication cracking of a sample of a remolded Eutric Vertisol.
are represented in Table 2. The results showed that fd values were between 1 and 2, i.e. (2 ³ fd ³ 1) and that the dessication cracks were of fractal nature.
Figure 7 generally showed a positive relationship between the fd and the CIF during dessication with the CIF varying between 0.0% to 6.0% whereas the fd between 1.2 to 1.7. Interestingly, the CIF increased during dessication in the days 1 to 8 attaining maximum value of 6% and fd 1.5 while it gradually reduced in the subsequent days 10 to 32 to as low as 1.2%.
Figure 8(a) showed that increase in crack length was time-dependent and attained a peak value at about f(l) = 0.015with a decrease of f(l) below 0.02 during the subsequent days of dessication. Such increase and decrease in crack length during dessication showed a log normal distribution pattern with parameters s = 91.9 and m = 80.59. Although both parameters had no physical significance in soils and could not empirically be corroborated in terms of their magnitudes, they seemed to significantly influence both waterflow and solute transport [24] . This unimodal distribution of f(l) suggested the concurrent increase in crack length in both primary and secondary cracks. It appears that any further dessication after day 8 had no significant effect on crack length increase rather than the widening of pre-exisiting cracks.
The crack number for the different crack widths (Figure 8(b)) also showed positive correlation with fd. The crack number was highest between 0.4 - 1.6 for crack width between 0 - 10 mm and fd between 0.2 - 1.6 as expressed by the polynomial function (0 - 10 mm = −0.0139x2 + 0.6151x + 0.8921; r2 = 0.89). However, low fd £ 1 values are unusual and would suggest the inadequacy of associating fd with crack number when characterizing crack geometry. Cracks with average width between 10 - 20 (10 - 20 mm = −0.0082x2 + 0.4137x − 0.9383; r2 = 0.88) and 20 - 30 mm (20 - 3 0 mm= −0.0001x2 + 0.0135x − 0.0348; r2 = 0.90) showed low crack numbers between 0.2 - 0.4 as well as fd values between 0.2 - 0.4. The cut-off values fd £ 1 also showed that the crack number as a parameter was inadequate in describing crack geometry since the relative numbers of widened cracks 10 - 20 and 20 - 30 mm was low.
The density functions of crack width f(W) during dessication cracking of a remolded vertisol are shown in Figure 9. The maximum value f(W) of a crack width may be perceived as most probable value (MVP) or the probability distribution of f(W) that is close to maximum [19] . The cracks with different widths showed typical bimodal distribution with maximum f(W) values at 6E-09 and 2E-09 for 0 - 10 mm; f(W) = 0.012 for 10 - 20 mm; and f(W) = 0.016 and 0.012 for 20 - 30 mm. This bimodality is a lump up of two sets of cracks; the main primary cracks and the secondary sub-cracks that developed from the former. The results indicated that the MVP and so the f(W) as well as the fd increased with dessication time to day 8 - 10 especially within the primary cracks, whereas this was between day 28 - 30 in the secondary cracks. The maximum fd = 1.3 for both crack widths 0 - 10 and 10 - 20 mm respectively while this was fd about 1.44 for 20 - 30 mm crack width suggesting a positive correlation between crack width and fd. This bimodality also suggested that maximum increase in crack widths for all tested crack sizes during dessication occurred in two phases: at the start (approximately at day 8 - 10) for predominantly primary cracks and at the end of dessication cracking (day 30) for the secondary cracks.
![]()
Figure 7. Relationship between the CIF and the fd during dessication cracking of a remolded vertisol. (Blue lines indicate 95% confidence level; r2 = 0.39; p < 0.05, Pearson correlation).
![]()
![]()
Figure 8. (a) Histograms and time-dependent distribution of crack length during dessication cracking; (b) the relationship between crack number and fd of the different crack widths of a remolded Eutric Vertisol.
![]()
![]()
![]()
Figure 9. Density functions of crack width f(W) during dessication cracking of a remolded Eutric Vertisol.
4. Conclusions
We analyzed and characterized a series of cracking processes in time as a function of water loss. The cracks that developed during dessication of a remolded Eutric Vertisol clearly showed fractal properties between 2 ³ fd ³ 1 During the initial and the subsequent stages, the crack length and number increased and showed that, the fd was not a constant but rather a spatio-temporal variable characterizing a type of cracking behavior that was conditioned by soil water loss during drying. From the conducted experiment, the following conclusions could be drawn:
1) The fd positively correlated with both CIF and time during dessication.
2) Crack length expressed as log of Crack Area CA, increased with decrease of SMC till a cracking stability phase was attained with no further crack length increase except the expansion or widening of pre-existing cracks.
3) Crack width increased in two phases whereof increase in the first 1 to 10 days during dessication was predominantly within the primary cracks, and between 20 - 30 days was within the secondary cracks.
Acknowledgements
The authors are very grateful to the Norwegian-funded project NUCOOP (Norwegian Universities Cooperation Project) under the title “Post-war Livelihood and Environmental Studies” Project No. 2000/10003 hosted at College of Natural Resources and Environmental Studies (CNRES), University of Juba for funding the purchase of both penetrologger and Theta moisture sensor. Similarly, the authors would like to thank the Japanese National Agriculture and Food Research Organization (NARO), for availing the Fractal3e software.