Gnomon Assessment for Geographic Coordinate, Solar Horizontal & Equatorial Coordinates, Time of Local Sunrise, Noon, Sunset, Direction of Qibla, Size of Earth & Sun for Lahore Pakistan ()
Received 5 January 2016; accepted 26 February 2016; published 29 February 2016

1. Introduction
In ancient times, gnomon was used as sun dial and for other observations. With the passage of time it started to use as tool for navigations. Still it is a reliable instrument for the basic astronomical as well as geographical calculations. In this paper, efforts for geographic position on earth in survival conditions, Sun’s horizontal and equatorial coordinates have been done with gnomon (a vertical stick casting its shadow). In order to emphasize the importance of gnomon in present time, other astronomical and geodetic calculations have also been investigated in this paper.
2. Study Area
Lahore (74.27985278E, 31.4421667N) is the capital city of Punjab province, Pakistan. It is the second most populated city of Pakistan. An estimated in the 2014, it has population of 7,566,000. It has flat topography. Hottest month is June, when average high temperature routinely exceeds 40˚C. The monsoon season starts in late June and the wettest month is July, with heavy rainfalls. Coolest month is January with dense fog. Elevation of Lahore from mean sea level is 208 to 213 m (see Figure 1).
3. Objectives of Research
The primary purpose of this research was to build an instrument, low cost, which could help us in finding position of observer in survivor conditions. This instrument could calculate Geographic coordinates as well as Horizontal and Equatorial coordinates of the Sun. Able us also to calculate direction of Qibla, Apparent solar noon time, Time of Sun set and Sun rise for Lahore as study area. Using techniques of Al Buruni, it may help us to calculate radius of the earth. Through geometrical techniques of similarity and concurrency it leads us to calculate diameter of the celestial bodies like sun, moon.
4. Dataset Used
Solar azimuth and altitude angles have been calculated for January 2, 2015. Time of observations was different
![]()
Figure 1. Geographic map of Pakistan with map of Lahore(testing site) at large scale.
in solar azimuth and altitude measurements. Observations were taken from 11:30 to 16:00 (GMT + 5 h). Through this data set objectives of research was achieved and for validation, results have been compared with the US Navy Observatory, NOAA Earth System Research Laboratory and Google Earth.
5. Research Methods
5.1. Calculation of Geographic Coordinates
In order to calculate latitude of observer through gnomon we have to calculate day angle through Equation (1).
 (1)
(1)
 Represent day angle represent in radian units. Where
  representing number of days after 1 January. Range of
  was 1 to 365 assuming February of 28 day, due to leap year. Reference [1] presented Equation (2) to calculate declination
  in degrees
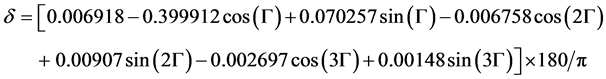 (2)
(2)
Equation (2) estimates  with maximum error of 0.0006 radian (<3’). If final two terms of (2) neglected, then maximum error of 0.0035radian (12’) remained in declination. Observations were taken on January 2, 2015. Latitude of the observer could be calculated with gnomon, only, at apparent solar noon (or when shadow cast by gnomon will be shortest in length). Table 1 shows observations taken for solar elevation angle from 11:30 to 15:55 on January 2, 2015 with gnomon.
Declination of the sun was calculated from equations (1) and (2). It came out to be negative, indicating that sun was in southern hemisphere of the celestial sphere (see Table 2).
There for using spherical triangles rules, latitude of the testing site could be calculated with Equation (3).
 (3)
(3)
![]()
Table 1. Solar elevation data on January 2, 2015 taken from gnomon and US Naval observatory.
![]()
Table 2. Day angle, declination, solar elevation angle from gnomon and US Navy observatory.
 Represented latitude in degree decimals, Alt is the solar altitude angle when the apparent solar noon occurs. Figure 2 was the plot of gnomon’s shadow length with time of observations. Minimum shadow length was the indication of apparent solar noon (see Figure 2 and Table 1) and this occurred at 12 o’clock.
Difference of latitude calculated from gnomon with latitude taken from Google Earth was 6 min 41.43 seconds (see Table 2). Umbra shadow cast by top of gnomon could give angle of elevation of upper limb of sun’s disk. In order to get accurate value of latitude, we added angular radius of sun also. This average radius of the sun was 16 arc minutes on that time. So our final value for the latitude came out to 31.33066583 + 16 arc minutes = 31.597335N decimal degree with systematic error of −9 min 18.6 sec (see Table 2 and Table 3).
Uncertainty of ±1 mm in height, length and shadow of the gnomon could produce error of 8 min 24.36 sec in calculation of latitude (see Table 3). Hence we determine our latitude within the 59.70518514 Nautical miles (see Table 4). In order to determine Longitude of the Lahore (testing site), we noted difference between apparent solar times and mean solar time, which was called as equation of the time. Equation of time was consequence of obliquity of ecliptic and ellipticity of the earth’s orbit. From U.S. Naval observatory, equation of time on January 2, 2015 was −3 min 59.4 sec. From Table 1 and Figure 2, it could see that apparent solar noon in the observations, occurred at 12:00 local time. Pakistan standard time was +5 hours ahead of GMT. Therefore longitude of the observer (with respect to Greenwich’s longitude) calculated as
Apparent Solar Noon = 12.00
Noon at Greenwich (ESRL Global Monitoring Division-GRAD Group [2] ) = 12.065
 . (4)
. (4)
![]()
Table 3. Sources of systematic errors in latitude.
![]()
Table 4. Systematic as well as random errors in geographic coordinates.
![]()
Figure 2. Plot of variation of gnomon shadow length with time of observations, minimum shadow length was the indication of local solar noon.
![]()
Since the 1h of time corresponds to 15 degrees of longitude, so our derived longitude was T × 15 = 4.94 × 15 = 74.1E decimal degree. From Google Earth longitude of the observational site (Lahore) was 74.27985278E. Therefore systematic error in longitudes was = +10 min 47.47 sec. Total uncertainty in time measurements and equation of the time was ± 1 minute. In order to check robustness in calculation, ratio of these errors was taken. This ratio was closed to 1.0, it would imply that we have no significant systematic errors and observations could be improved using the same apparatus (see Table 4).
Since lines of longitude converge at the earth’s geographic poles, in order to determine linear error in longitude, we must multiply the longitude error in angular units with cosine of latitude. Therefore, our east west error from the true position was 0.17985 × cosine (31.4421667) = 0.15344 Nautical miles. Table 4 consists on systematic and random errors appeared in geographic coordinates calculations.
5.2. Direction of Qibla (Holy Kaaba)
Reference [3] mentioned as direction of Qibla (also called direction of Holy Kaaba) for a person, a ray coming out from his eye, which lies in the direction of, plane of great circle passing through his zenith and the point corresponding to (zenith of) Kaaba. This ray could be best depicting in Figure 3.
Islam which is the second largest religious in world has center significance for calculation of direction of Qibla. This figure has main direction for five time prayers per day in Islam. Holy Kaaba was cubical in geometry and located in Makah, which is a city in Saudi Arabia.
5.2.1. Direct Solar Observations
It was not reliable method to determine direction of Holy Kaaba, through magnetic compass. The following method which used the sun was more reliable. It has been observed for centuries and reported in many books by Muslims around the world that, two times in a year sun came overhead above Kaaba. This was observational fact for centuries, and used to set correct prayers direction in places far from Makah by Muslims for last so many centuries.
Those two dates and times were:
May 28 at 9:18 GMT,
July 16 at 9:27 GMT.
5.2.2. Basic Spherical Trigonometric Formula
In order to find out direction of Qibla from Lahore, we used rule of spherical trigonometry [3] . According to Figure 3, solving spherical trigonometry, we got (5) for direction of Qibla.
![]()
Figure 3. Direction of Qibla (Kaaba) from Lahore in spherical triangle.
![]() (5)
(5)
Equation (5) was just final form of four part formula which given by
Cosine (inner side) × Cosine (inner angle) = Sine (inner angle) × Cot (other side) − Sine (inner angle) × Cot (other angel)
In Equation (5),
![]() = Longitude of Lahore (testing site)
= Longitude of Lahore (testing site)
![]() = Longitude of the Holy Kaaba (Qibla)
= Longitude of the Holy Kaaba (Qibla)
![]() = Latitude of Lahore (testing site)
= Latitude of Lahore (testing site)
![]() = Latitude of Holy Kaaba (Qibla)
= Latitude of Holy Kaaba (Qibla)
Inner angle = ![]()
Inner side = ![]()
Other side = ![]()
Other angle = ![]() = Direction of the Holy Kaaba from Lahore (testing site) with respect to magnetic north
= Direction of the Holy Kaaba from Lahore (testing site) with respect to magnetic north
Cosine (![]() ) × cosine (
) × cosine (![]() ) = Sine (
) = Sine (![]() ) × cot (
) × cot (![]() ) − sin (
) − sin (![]() ) × cot (
) × cot (![]() )
)
Sine (![]() ) × cosine (
) × cosine (![]() ) = Cosine (
) = Cosine (![]() ) × tangent (
) × tangent (![]() ) − sin (
) − sin (![]() ) × cot (
) × cot (![]() )
)
Rearranging the terms
Sine (![]() ) × cot (
) × cot (![]() ) = cosine (
) = cosine (![]() ) × tangent (
) × tangent (![]() ) − Sine (
) − Sine (![]() ) × cosine (
) × cosine (![]() )
)
![]()
![]() . (6)
. (6)
From Table 5, put the values for Lahore (testing site) into (6) we got
![]() .
.
![]() = 180 + (−80.60703027) = 99.39296973 west of north. Table 6 summarize difference occurred between direction of Qibla taken from gnomon and actual direction of Qibla used in Lahore. This difference was less than 0.18 decimal degrees (see Table 6).
= 180 + (−80.60703027) = 99.39296973 west of north. Table 6 summarize difference occurred between direction of Qibla taken from gnomon and actual direction of Qibla used in Lahore. This difference was less than 0.18 decimal degrees (see Table 6).
5.3. Horizontal Coordinates of the Sun
We used gnomon, having horizontal plane surface (remember wood changes its shapes with seasons). We cut this sheet of wood to a circle of convenient diameter. At the center of the sheet make two small holes and adjust a meter rod and movable antenna (gnomon) in these holes. Put two bubble levelers on the wood sheet which tell us about level of gnomon in a plane. To achieve the horizontal level, gnomon was mounted with net bolt
![]()
Table 5. Inputs to spherical triangle associated with direction of Qibla.
![]()
Table 6. Errors in direction of Qibla.
screws of 3 inches length. Magnetic compass on gnomon was used to measure solar azimuth angle from North Pole. Before a day or two the experiment, we made our quartz clock as accurate as we can do with local time, also we took a look on the weather condition from the National Weather Forecasting Center. We select a site where gnomon’s shadow throughout the day was easily measureable and there was not obstacle between the sun and gnomon. We used a plum line to ensure the verticality of the gnomon (see Figure 9). Before one or two hours to start observations, we set our apparatus and used millimeter to calculate length of the shadow, cast by gnomon, and height of the gnomon. It was best to measured length of shadow, 100 minutes before time of the local apparent noon until 100 minutes after the local apparent noon. To avoid the effect of Umbra and Penumbral shadow of the gnomon, we used white paper to produce contrast with shadow. Table 1 showed solar elevation angle with time of observations. Times of observations were not uniformly spaced due to clouds prominent on that day. Angle of the sun’s disk center to plane of horizon associated with gnomon was solar altitude angle. Altitude angle of the sun varies though out the year. It depends on the earth position around the sun during its orbit. Solar altitude angle will be 0˚ at the time of sun rise and sun set. 90˚ solar altitudes indicated you were standing at equator. Apparent solar noon occur when sun’s altitude angle in day was highest or when shadow cast by the gnomon will be minimum (see Figure 2). The only one time when no the shadow cast by the gnomon will be occur when the sun is directly overhead of the gnomon (solar declination varies though out the years from +23.5˚N to −23.5˚S). After calculating length of shadow and height of gnomon we estimated altitude angle (Alt) using Equation (7).
![]() (7)
(7)
We prepared a plot to investigate solar altitude variation with time (see Figure 4). This plot gave clue of decreasing solar altitude angle with day time. Figure 5 was a plot of solar altitude angle on the same time, taken from US Naval observatory. Both plots (Figure 4 & Figure 5) indicated same variation of solar altitude angle throughout the day.
Time of observations for solar azimuth was different than solar altitude angle. Solar azimuth angle was measured, from direction of gnomon’s shadow with respect to true geographic pole of earth, in anticlockwise direction. We used magnetic compass to find the direction of magnetic north pole. NOAA gave us magnetic field calculator based on two Earth’s magnetic field models, IGRF (1590-2019) & WMM (2014-2019) [4] . In order to readjust solar azimuth angle with true geographic pole, we used WMM (2014-2019) model to find this shifting. Magnetic declination (angle between earth magnetic North Pole and true geographic North Pole) was 1.8033˚E on January 2, 2015, which indicated magnetic North Pole on this date located 1.8033˚E away from the true geographic North Pole. Table 7 showed this adjusted solar azimuth angle with magnetic declination.
Table 7 also contains solar azimuth angle for the same time, taken from US Navy Observatory. We advised you to set the apparatus before the time of observations so that you can take correct solar azimuth angle. Figure 6
![]()
Figure 4. Plot of solar elevation angle with time of observations taken from gnomon at January 2, 2015.
![]()
Figure 5. Plot of solar elevation angle with time of observations taken from US Navy Observatory at January 2, 2015.
![]()
Table 7. Solar azimuth angle calculated from gnomon, magnetic declination and with US Navy observatory solar azimuth data.
showed, plot of solar azimuth angle measured from gnomon. This graph indicated that solar azimuth angle was going to increase to 270˚ till sunset.
Figure 7 was prepared from the solar azimuth angle, taken from US Navy observatory for the same time of observations (see Table 7). After validating our calculated solar azimuth angle with US Navy observatory, (see Figure 6 & Figure 7) we investigate solar azimuth angle was going to increase on that day.
5.4. Equatorial Coordinates of the Sun
On January 2, 2015 the sun had declination in southern hemisphere, therefore using concepts of spherical triangles
![]() (8)
(8)
![]() was the latitude of the observer, Alt was the solar altitude angle at local apparent noon. Putting value from Table 1, Table 5 into Equation (8).
was the latitude of the observer, Alt was the solar altitude angle at local apparent noon. Putting value from Table 1, Table 5 into Equation (8).
![]()
Figure 6. Plot of solar azimuth angle with time of observations taken from gnomon at January 2, 2015.
![]()
Figure 7. Plot of solar azimuth angle with time of observations taken from US Navy Observatory at January 2, 2015.
![]()
Actual value taken from the US Navy was δ = −22.89585 decimal degrees, it was −0.01752 decimal degree more than calculated from gnomon.
5.4.1. Hour Angle at Sunrise and Sunset
Hour angle defined as the number of hours between the solar noon and time of interest multiplied by constant 15˚/hour. Value of this constant was known with rate at which the sun appeared to move around the earth namely 360˚ in 24 h or 15˚ per hour. At solar noon, the hour angle would be 0˚ and westward direction of the solar noon would take it positive [5] . In calculation of hour angle it was important to used solar time not ordinary clock time, standard time rather than day light time must be used. Sun rise and sun set define as, the times at which solar altitude angle be 0˚ or when center of the sun’s disk has passed below the local horizon. Hour set at the sunset was calculated from Equation (9)
![]() (9)
(9)
Hour set, was expressed in degrees and divided by 15. The result was the number of hours after local solar noon at which the sun sets. To find the hour of sunrise, this same number of hours was subtracted from the noon [6] .
![]() (10)
(10)
Hourset = cos−1 [−tan (−22.867833) tan (31.33067)] = 75.12326106˚ = 5.008217404 h (see Table 10).
Solar apparent noon occurred at 12 h (see Table 1), therefore following Equation (10)
Hour rise = 12 − 5.008217404 = 6.99765066˚
Table 8 contained hour angles calculated form gnomon with US Navy and NOAA’s sunset and sunrise timing for Lahore on the same date.
Table 9 showed hour rise and hour set, calculated from gnomon and compared with US Navy, NOAA data. These differences were less than 0.5˚ (see Table 9).
5.5. Size of the Earth
Eratosthenes and a Muslim scientist Al Buruni were prominent names in calculation of the earth circumference. Eratosthenes used concept of solar declination while the Al Buruni apply mathematical techniques of trigonometry. Al Buruni was the first who know that, earth, not flat rather spherical in shape. Using the same concept of Al Buruni, through gnomon we calculated radius of the earth for Lahore. In order to do this, we find height of the gnomon from the ground (including the height of the instrument from the ground). It showed a vertical plane through the center of the Earth and the gnomon (see Figure 8).
R represent radius of the earth, and h showed height of gnomon above earth’s surface. Geometric horizon (also horizon distance) from top of gnomon is shown in tangent to radius of the earth in Figure 8 [7] . Elementary geometry told us that, radius R, distance of gnomon from center of earth and horizon distance from top of gnomon were related to each other with Pythagorean Theorem:
![]() (11)
(11)
![]()
![]()
Table 8.Hour angles calculated from Gnomon along with US Navy and NOAA provided hour angles.
![]()
Table 9.Difference of Hour setand Hour rise measured from gnomon with US Navy and NOAA data.
![]()
Figure 8. Gnomon with height (h) above the earth surface and horizon distance from its top.
As![]() , therefore
, therefore
![]() (12)
(12)
Height of the gnomon from ground = h = 0.2 m
![]()
Distance to horizon = R tan (dg), by taking the average radius of the earth 6371 km [8] we can calculate angle of dip = dg = 0.01435814155˚
In literature (13) given by great scientist Al Buruni [9] .
![]() (13)
(13)
From equation (13) radius of the earth came out to be 6369.55 km which was different from the true value about 1.45 km. With this value circumference of the earth came to 40021.063 km.
5.6. Size of the Sun
Aristarchus was first to estimate distance of the sun. After that, he calculated radius of the sun on lunar eclipses. We used property of two similar triangles, side angle side (S.A.S), formed when button on gnomon just full cover disk of sun. To measure size of celestial bodies, we put a button of diameter 1.1 cm (taken from the venial caliper) on gnomon. We recommend using solar glasses to avoid harmful effect from the sun radiations (see Figure 9). When disk of button just cover disk of the sun then two triangles (one is between the gnomon and observer’s eye and other will be between gnomon and the sun’s disk) formed were similar to each other. We measured distance of our eyes from the center of button. Earth sun distance varied though out year. As the earth’s orbit was elliptical, having mean eccentricity of 0.01671022. During journey of the earth around sun, it came close to the sun at a point, in its orbit called Perihelion (distance = 147.09 × 10⁶ km) and Aphelion when it is farthest from the sun (152.10 × 10⁶ km) [10] .
In order to calculate solar diameter, we used Equation (14)
![]() (14)
(14)
Diameter of the sun was come out to 1651088.776 km which is 259404.8 km different from the actual diameter of the sun (see Table 10).
6. Conclusion
Fewer errors in each calculation suggest us that gnomon can be used in the basic astronomical, astrophysical
![]()
Figure 9. Gnomon used in this research work.
![]()
Table 10. Diameter of the Sun from gnomon and its difference from actual value.
remote navigations and geodetic calculations.
Acknowledgements
I would like to acknowledge assistance of U.S. Naval Observatory, NOAA Earth Science laboratory Global Monitoring Division-GRAD Group, for providing me data for this study. Special thanks to open journal of applied sciences, who give a place to publish this work. I would like to mentioned assistance of my student Muhammad Mohid for collecting data in this research.