A Novel Approach to Disqualify Datasets Using Accumulative Statistical Spread Map with Neural Networks (ASSM-NN) ()
1. Introduction
In general, many neural networks applications are concerned with analyzing issues related to pattern recognition by using a supervised training method with training datasets. This will achieve and inference relationship between input patterns and output results [1] - [3] .
Neural Networks offers several algorithms and establishes models using data. Before applying any of the built-in functions for training, it is important to check that the data is reasonable, as good models can be obtained from poor or insufficient data. There is no specific procedure yet that can be used to test the quality or homogeneity and coherence of the data [4] - [6] .
One way to check for quality is to view graphical representations of the data in question in the hope of selecting a reasonable subset while eliminating problematic parts. In examining the data for a classification problem, some reasonable points should be looked at, such as:
a) Equal representation of classes by datasets;
b) The presence of dissimilar datasets from the rest or neighboring values.
In supervised training, parameters such as weights and bias matrices for the neural network are used in order to classify all patterns in the training datasets. Larger training datasets are expected to reduce the overall error and error rate. However, it is a challenging task to produce a neural network that will be able to accommodate all patterns in a large training dataset, due to some patterns are difficult to classify. Even if network layers and neurons are modified, there are still some problems in pattern classification despite the lengthy training process [7] - [10] .
The probability of occurrence of these patterns is expected to increase as a function of the size of the training dataset. Hence, the neural network will fail to recognize a pattern that approximates to one of the misclassified patterns. Also, if a new pattern is employed, which approximates to one of the misclassified patterns in the old training dataset, the neural network will not be able to classify it, and it will become a new misclassified; thus, the error rate will increase [11] -[14] .
In this paper, a new approach catching and isolating such patterns is presented. The approach uses a new Accumulative Statistical Spread Map (ASSM) to initially establish the coherence of the patterns under consideration, and will not cause a misclassification in the neural network, and then when the status is established, the neural structure is used to determine which of the datasets and patterns is causing such misclassification and raising the error rate. Thus, such a neural network structure can be used as a filter and isolator with the Accumulative Statistical Spread Map used to determine which part or parts of the datasets is causing the problem. All the matrices of weights and biases are kept in the order that originally set from the training process throughout the testing process. Moreover, analysis results are used to control the updating process for new patterns.
2. Methodology
Two datasets that belong to the same general parent category are used in the experimental process to prove the concept. Same rules applied to produce the sets; hence, many general common features exist between them. The post processed datasets obtained using the ASSM approach with groups and subgroups produced to show two aspects:
a) If the datasets that the patterns represent belong to the same main group;
b) If there are signs that there will be a conflict in using them together, as one of them has an undesirable effect.
If the result in b is a confirmation, then a neural network algorithm is used to determine which one of the datasets and their patterns is the unhealthy one by carrying out the following steps:
1) Training and testing the considered datasets according to:
a) Dataset 1;
b) Dataset 2;
c) Combined Datasets 1 & 2;
2) Reporting margins of errors covering all three combinations of training;
3) Noticing the pattern that is least affected and classifying it as the unhealthy pattern.
The sorting algorithm is based on the expressions in Equations (1) and (2):
 (1)
(1)
 (2)
(2)
where
f: Correlation function between the Tokens;
n: Range of classification;
j: Range of Tokens (in this work j = 4);
The ASSM carries out initial re-organization and sorting by correlation according to Equation (3), before it produces the final output:
 (3)
(3)
3. Results
Table 1 and Table 2 show the used and categorized Datasets 1 and 2. These Datasets are used in the experimental process.
![]()
Table 1. Initial categorization results obtained for dataset 1.
![]()
Table 2. Initial categorization results obtained for dataset 2.
4. Discussion and Conclusions
Figure 1 and Figure 2 show Accumulative Statistical Spread Map (ASSM) for Datasets 1 and 2. The maps represent the correlated statistical features in both Dataset 1 and Dataset 2 in relation to the sequence numbers assigned to them due to sorting.
From the maps, the following is realized:
1) The concentration of feature spread into the second and fourth quarters of the ASSM (counterclockwise);
2) The similarity in feature spread confirms that the two patterns representing Datasets 1 and 2 derive from similar source with common features.
Each ASSM is processed to produce clustered representation, as shown in Figure 3 and Figure 4, in order to obtain a similar representation to genetic code. This is shown in groups 1 and 2.
Dataset 1 ® {3, 5, 0, 0, 0}, {5, 45, 4, 6, 0}, {0, 4, 1, 2, 1}, {0, 6, 3, 48, 3}, {0, 0, 0, 4, 4} (1)
Dataset 2 ® {5, 3, 0, 0, 0}, {3, 45, 5, 15, 0}, {0, 4, 1, 3, 0}, {0, 14, 2, 46, 6}, {0, 2, 0, 4, 2} (2)
From groups 1 and 2, the following is deduced:
1) The existence of inverted digits (features position swapping) between dataset 1 and dataset 2; Inverted digit values are expected to have a destructive effect on the system learning and classification process;
2) The presence of common features (features of similar value and position);
3) The presence of different features (features of different values in similar positions);
Placing the code groups into matrices 3 and 4 and carrying out row and column summation, shows the following:
1) Each dataset follows an overall mathematical code that is specific to its representational pattern;
2) The symmetrical relationship between each Row and Column of each matrix. This is the result of using ASSM and indicates that both patterns belong to the same process;
![]()
Figure 3. Clustered representation of dataset 1.
![]()
Figure 4. Clustered representation of dataset 2.
3) The difference in the Column values with higher values appearing in Dataset 2 supports the evidence of Dataset 2 capability to overshadow Dataset 1 and negatively affect the overall learning and classification process.
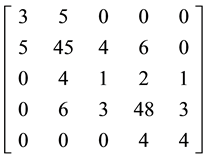 ® Row = {8, 60, 8, 60, 8}, Column = {8, 60, 8, 60, 8} (3)
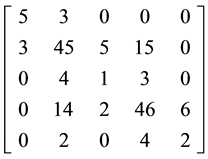 ® Row = {8, 68, 8, 68, 8}, Column = {8, 68, 8, 68, 8} (4)
The previous results indicate the presence of conflicting patterns, where one of them would cause a problem when used with the rest of similar patterns. To uncover the unhealthy pattern responsible for such condition, a back propagation neural algorithm is employed to train and test both datasets.
Table 3 and Table 4 show the results for sorting, categorization, and neural networks training and testing
![]()
Table 3. Sorting, training, and testing of dataset 1.
![]()
Table 4. Sorting, training, and testing of dataset 2.
results for similarly processed datasets with the neural engine trained using dataset 1 in isolation from dataset 2, and dataset 2 in isolation from dataset 1 with RED Sequential Numbers pointing towards the records with difference between Actual and Desired data, while Table 5 and Table 6 show the results for the same datasets merged and sorted in relation to each other, and presented to the neural engine for training and testing.
From Table 7 and Table 8, it is deduced that Dataset 2 prediction starts with larger initial error, and stays unaffected after merging with Dataset 2 as a training set. For Dataset 1 , the result is almost opposite, as its prediction starts with much smaller error and suffers large error increase after merging with Dataset 2 as a training set. This indicates a marked increase in the level of total pattern destruction and mutation due to effect of Dataset 2. So, Dataset 2 disabled the proper functionality of the Neural Structure and inhibited its performance.
The previous is supported by the following percentage errors appearing in Table 9, where it is clear that Dataset 2 is not affected by Dataset 1, while Dataset 1 is greatly and adversely affected by the presence of Dataset 2.
![]()
Table 5. Sorting, training, and testing of dataset 1 merged with dataset 2.
![]()
Table 6. Sorting, training, and testing of dataset 2 merged with dataset 1.
![]()
Table 7. Margin comparison-dataset 1.
![]()
Table 8. Margin comparison dataset 2.
![]()
Table 9. Margin change for datasets 1 and 2.
In conclusion, the ASSM proved its capability to detect and filter out undesirable datasets, which would greatly assist optimizing the neural network structure. Such functionality is critical in facilitating both good neural network designs and isolating certain datasets to study their behavior and reach a conclusion regarding the causes behind such abnormalities. The ASSM can be very useful in Health and Medical applications, such as cases where tumors are involved.