Detection of Changes on Temperature and Precipitation Features in Istanbul (Turkey) ()
1. Introduction
Istanbul (N40˚48'-N41˚30', E28˚00'-E30˚55') (Figure 1) due to its historical, economic, social and cultural
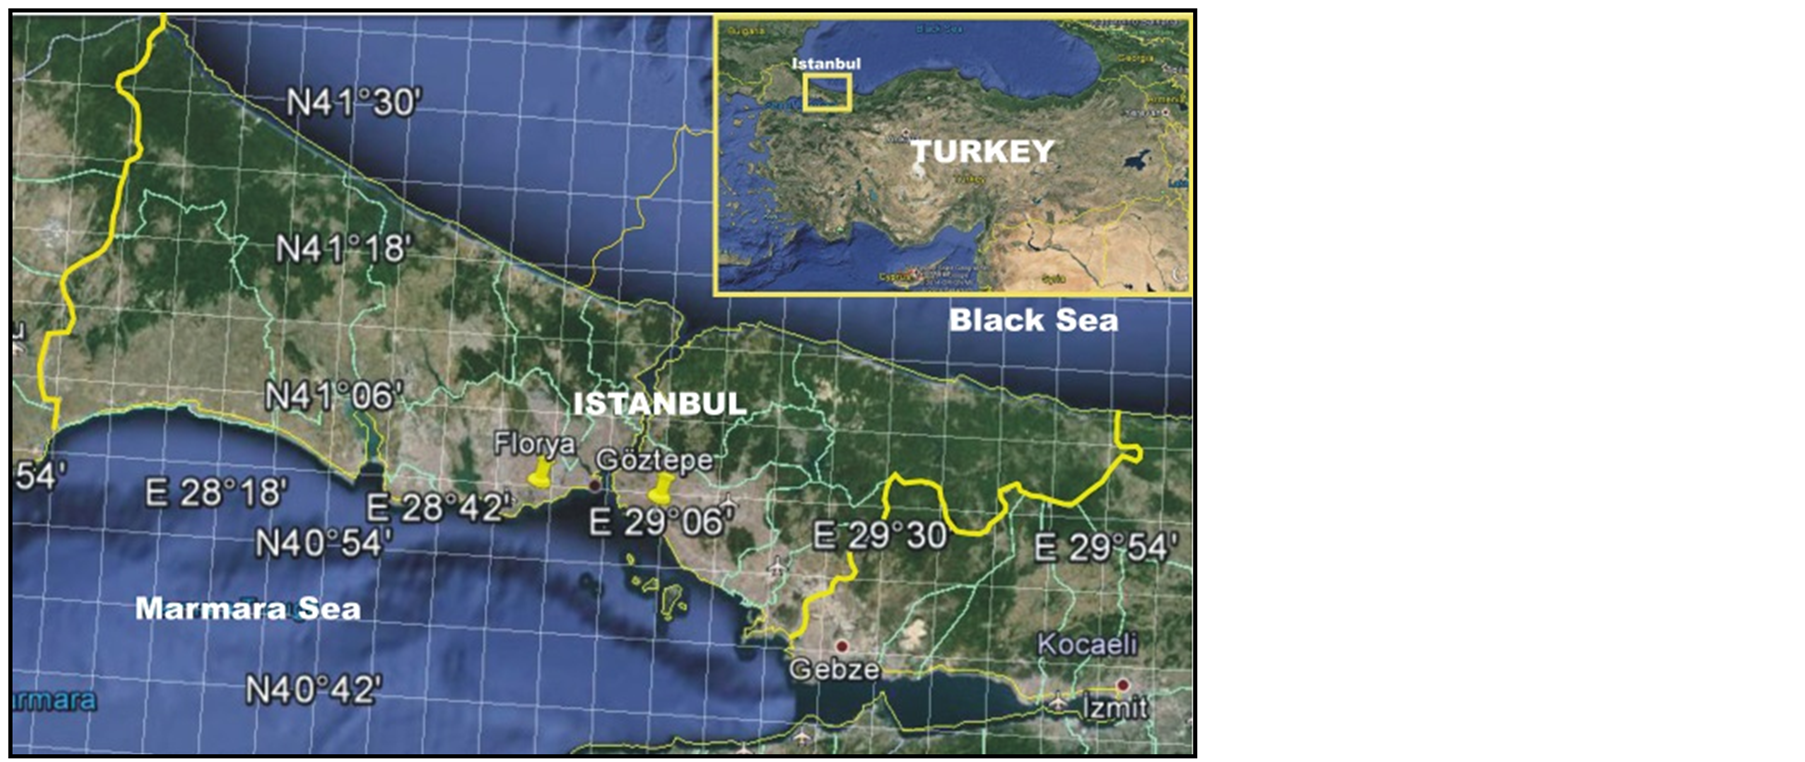
Figure 1. Location features of Istanbul and gauge stations observed climatic data sets (modified from Google Earth).
features it is one of the important cities not only for Turkey but also in global scale and according to the population data in 2013 year, 14,160,467 people are living in it.
Istanbul, which is such an important city, has very serious problems due to the water management and the occurring flood [1] -[4] . The inadequate infrastructure leads to further growth in the dimensions of this problem. The occurring floods with their huge costs are the major problem of Istanbul in this regard [4] [5] . The global climate change and the variations in the climate elements will make Istanbul to be confronted with the much more important problems of water management and flood. The total costs of this caused by climatic change will gradually increase.
Although there are previously conducted studies about the climate change, the possible future effects of the climate change and the issues of the adaptation to this climate change, it is conspicuous that almost all of them were suited for Turkey [6] -[15] . The lack of recent studies about the temperature and precipitation based on daily data which covers a long period of time and which is suitable for Istanbul is a major shortcoming. What kind of changes occurs in the precipitation and temperature characteristics over Istanbul? What kind of development do these changes show? What are the dimensions of these changes? What kind of trend can be observed? The answers to these questions have vital importance for Istanbul and they tend to be directive or even decisive for the issues such as the “water management”, ”disaster management”, “infrastructure planning” and “project application”.
In this study, the analytical evidences of the global climate change were investigated in Istanbul’s climate. In this context, it was aimed to determine the changes in the precipitation and temperature features, to find answers for the questions in regard of what, how, how often and so on and to interpret these answers as an answer to the above mentioned requirements. To achieve this aim the observational temperature and precipitation data of Florya and Göztepe Meteorological Stations (Istanbul), (between 1960 and 2013 years) were used [16] . The precipitation’s annual frequency, the trends of its amount distributions and the analyses of type changes, and De Martonne and Thornthwaite climate classification were made by using the daily temperature and precipitation observations of 54 years. As the results of the analysis it was intended to determine the changes occurred to Istanbul’s precipitations and temperature and the character and dimensions of these changes. The results will have a significant router role for the accurate diagnosis and projects in Istanbul’s water management planning.
2. Material and Method
In the analysis, the climatic data sets of Florya (N40˚58'45", E28˚46'18"; Altitude: 37 m) and Göztepe (N40˚58'43", E29˚03'18"; Altitude: 16 m) Meteorological Stations were used. These data sets include the observations of the average daily temperature, the daily maximum temperature and the daily total precipitation amount during the years of 1960-2013 (for 54 years). Both stations are in the residential center of Istanbul and almost on the same latitude. The Göztepe Meteorological Station is located 7 km east from the Bosporus according to straight distance while the Florya Meteorology Station is located about 17 km west from it. Using the data of both stations together was considered to be important in terms of data validation and in terms of giving the opportunity to control the results. At the same time these meteorological stations have made climatic observations for the longest period in Istanbul. There was some lacks of the observations belonging to Göztepe Meteorological Station about the daily precipitations after 2007. These observations were compensated by using the observations of the Kartal Meteorological Stations which is 10 km southeast and has the same altitude and exposure feature.
The climate data sets were provided by the Turkish State Meteorological Service [16] . The preparation of the analysis for the daily precipitation and temperature data was performed in excel charts. The result data was obtained from the daily precipitation data; the monthly total precipitation, monthly number of rainy days, the annual total amount of precipitation, the classification of the daily precipitation (P) in mm (P < 10 mm, 10 < P < 25 mm, 25 < P < 50 mm, 50 < P < 100 mm, 100 mm < P), the total precipitation data of the annual rainy season (October-April) by analyzing the annual and seasonal changes in the precipitation features. The monthly average temperatures, the average temperatures of the year’s warm season (May-September) and the annual change of character were calculated by using the daily average temperature. The monthly maximum temperatures were calculated from the daily maximum temperature.
The global average temperature began to rise from the year of 1940, it was determined that the rise of global temperature reached 0.4˚C between the years of 1880 and 1970 [17] [18] . The year of 1998 had the highest temperature observed between the years of 1880 and 1999 [19] [20] . The fact that 9 out of the 10 years with the highest temperature since 1880 [18] [21] , occurred after the year of 2000, revealed clearly the importance in terms of the climate changes in the last 15 years. Starting from these data in order to determine the changes in the precipitation and temperature features of Istanbul, the precipitation and temperature data of the 54 years (1960-2013) and of the 15-year periods (1960-1974 and 1999-2013) were analyzed comparatively. Furthermore, in order to check whether there was a change in the climate type of Istanbul, the De Martonne aridity index and the Thornthwaite climate classification were also conducted for the same periods.
Based on the precipitation and temperature data sets; the 54-year linear orientation, the distribution of the warmest years and the years with the least precipitation in the last 54 years, the climatic analysis of the first and last 15 years in the 54-year period were evaluated comparatively by making comparisons. Then, assessment was made by the differentiation in the precipitation and temperature regime of Istanbul connected to the issues of the differentiation belonging to Istanbul’s climate type.
3. Results
3.1. Changes in Precipitation and Temperature Features
Precipitation and temperature are two very important parameters in the trend analysis of the change in the climate type in the determination of the climate type. For this kind of analyses data sets covering 40-50 year period are preferred [22] -[25] . Both the statistical analyses and the monthly and annual average of the daily temperature and precipitation data observed in the Florya and Göztepe meteorological stations for the years of 1960-2013 were conducted (Tables 1-3) (Figure 2, Figure 3). When analyzing the average precipitation and temperature statistics of the 54-year period; there were only 5 years in Florya with less than 500 mm precipitations, all of them happened in the last 25 years and 3 of these 5 years were realized between 2006 and 2013. In Göztepe, the total number of years with less than 500 mm precipitation was 4, all of them happened in the last 25 years and 3 of these 4 years took place in the period of 2007-2013 years (Table 1).
The average temperature statistics of the 54-year period were examined by considering the years with an average temperature of 15.5˚C < T < 16˚C. According to this, in Florya, there was total of 6 years when these average temperatures occurred and it was stated that all of them took place in the periods of 2001-2013 years. There was a total of 8 years when these average temperatures occurred in Göztepe and it was determined that all of them occurred during the period of 1999-2013 years (Table 1). This remarkable distribution in the temperature and precipitation statistics of this 54-year period is consistent with the trend of significant climatic changes in the last 15 years globally [18] [21] .
3.2. Changes on Precipitation Characteristics
Along with the changes in the annual precipitation (Tables 1-3), the type and frequency of the precipitation in

Table 1 . Extreme years on precipitation and temperature during last 54 years (P: Precipitation, T: Temperature).
Table 2. Monthly and annual average precipitation and temperature in Florya (P: Precipitation, T: Temperature).
Table 3. Monthly and annual average precipitation and temperature in Göztepe (P: Precipitation, T: Temperature).

Figure 2. Temperature and precipitation trends of Florya station.
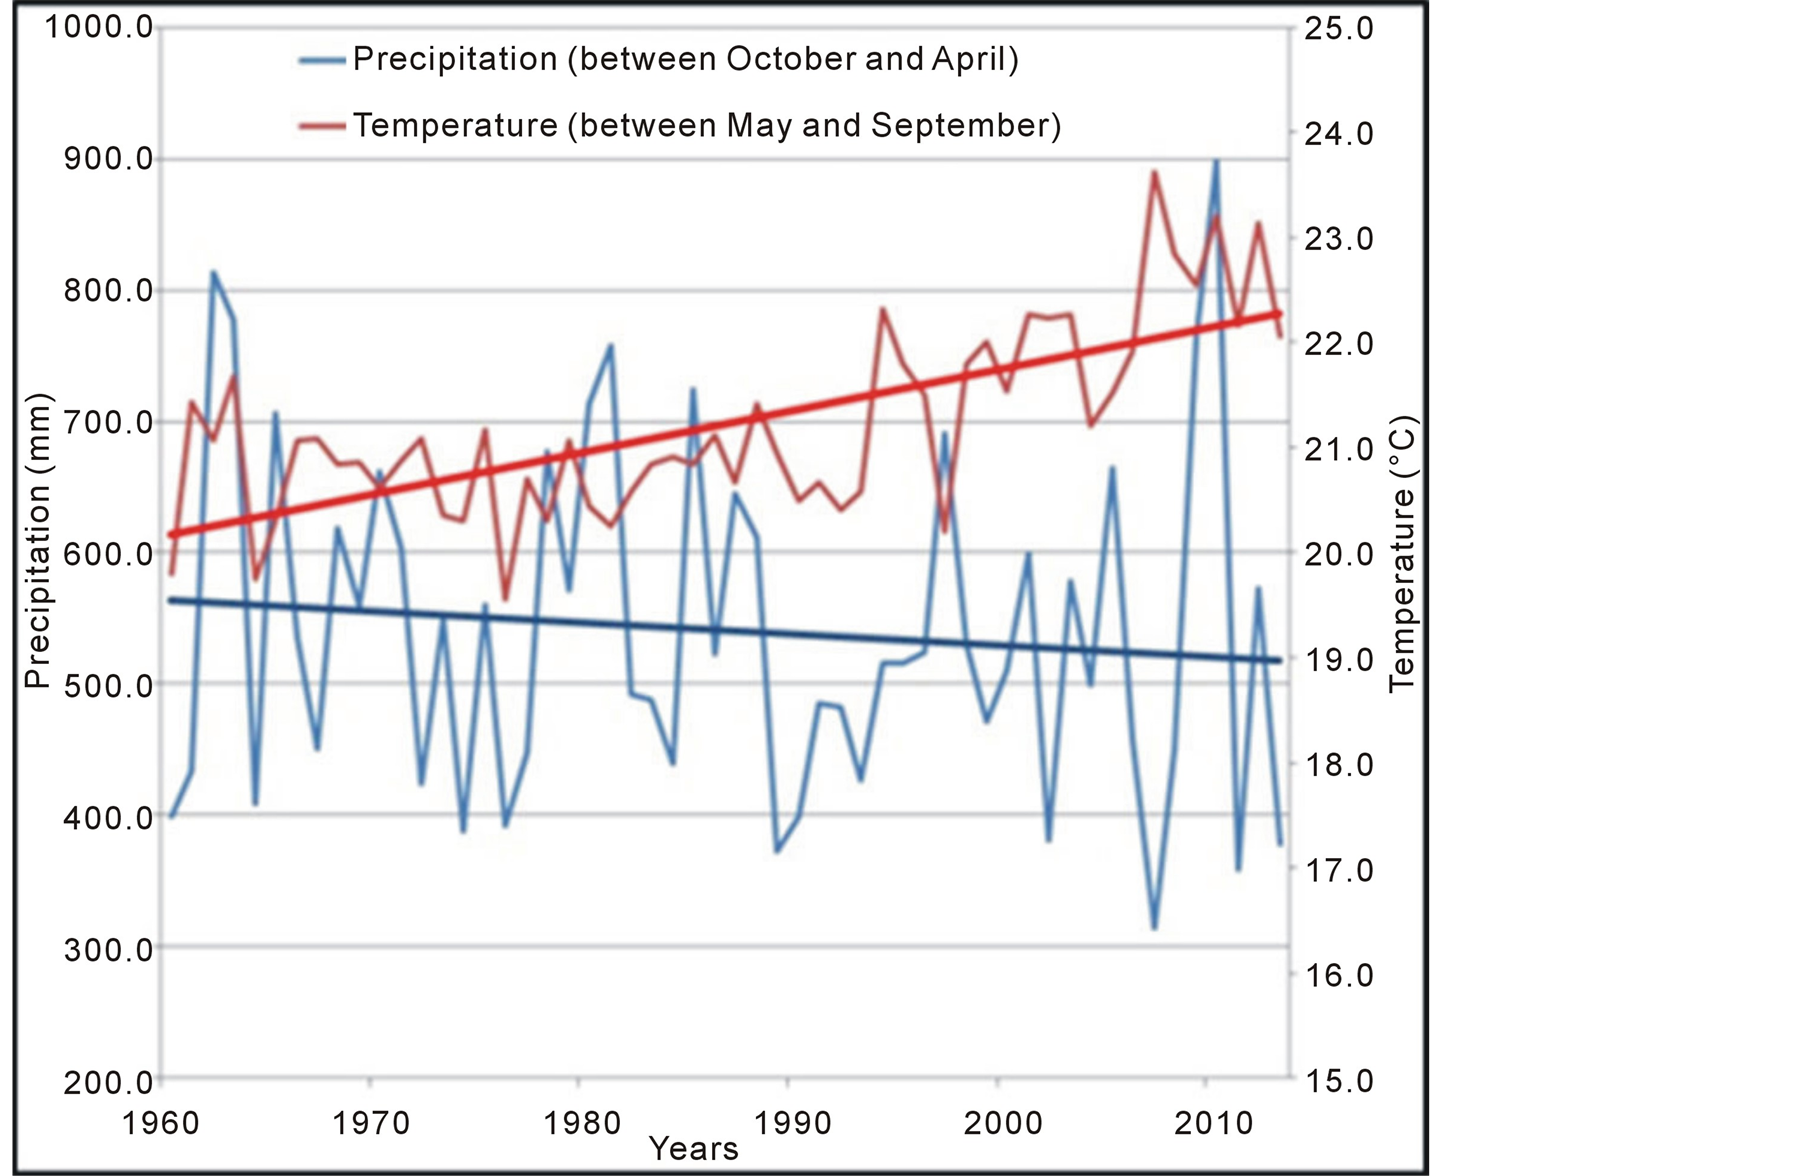
Figure 3. Temperature and precipitation trends of Göztepe station.
the form of rain within a year are the important indicators in the definition of the climate type and changes of the climate type. The number of rainy days was determined when analyzing the daily precipitation statistics recorded in the Florya and Göztepe Meteorological Stations (Table 4). The rainy days and their distribution throughout the year were given in Table 4 in the form of two different 15-year periods in order to make comparison. When analyzing Table 4, a small reduction was observed in the number of rainy days in the last 15-year period according to the data of both Florya and Göztepe Station (in Florya 14.66%, in Göztepe 8.46%). In the seasonal distribution of precipitation, comparing to the period of 1960-1974; during the rainy period of the years 1999-2013, a 6.3% reduction was observed in the number of rainy days (period of October-April) in Floryaand in the warm period (May-September) of the year 7.2% decrease was observed in the number of rainy days (Table 4). The same comparison was performed by using the data of the Göztepe station. In Göztepe, during the rainy period of the years, a 16.8% reduction occurred in the number of rainy days. And, during the warm period (May-September) of the years, the number of rainy days has decreased by 22.3% (Table 4).
The daily precipitation in the period of 1960-1974 was classified as P < 10 mm (light rains), 10 < P < 25 mm (Moderate rains), 25 < P < 50 mm (heavy rains), 50 < P < 100 mm (very heavy rains), 100 < P mm (extreme rains) [26] [27] but because there was not any day with more than 100 ml rain, the classification ended at the level of 50.1 < P (Tables 5-8). The “25 mm/day” was accepted as the limit amount of precipitation because when the daily precipitation amount was more than 25 mm it was described as being torrential character. The rainy days for each 15-year periods were divided into 2 classes including P < 25 mm/day and 25 mm/day < P (Tables 5-8).
The daily precipitation data of the Florya Meteorology Station were analyzed by considering the daily amount of precipitation and very significant results were achieved. When comparing to the period of 1960-1974; during the period of 1999-2013 years, the total number of rainy days was seen to decrease by 6.5% and the rain without torrential character (P < 25 mm/day) decreased by 7.3% (Table 5, Table 6). The rainy days with more than 25 mm of daily precipitation amount increased by 24.5% during the period of 1999-2013 years comparing to the period of 1960-1974 years. In other words, during the period of 1999-2013 years there was a change in the character of precipitations in favor of torrential rainfall, comparing to the period of 1960-1974 years. The seasonal character of this change in the annual scale was more than remarkable. During the rainy season (from October to
Table 4 . Number of rainy days for each 15 years period (F: Florya station, G: Göztepe station).
Table 5. Monthly distribution of days with different daily rainfall for 1960-1974 years in Florya.
Table 6. Monthly distribution of days with different daily rainfall for 1999-2103 years in Florya.
Table 7. Monthly distribution of days with different daily rainfall for 1960-1974 years in Göztepe.
Table 8. Monthly distribution of days with different daily rainfall for 1999-2103 years in Göztepe.
April) in the period of 1999-2013 years, the number of rainy days with less than 25 mm decreased by 6.1% compared to the rainy period of the years between 1960 and 1974. When we do the same comparison during the warm period (from May to September) the reduction in the number of rainy days with less than 25 mm rain increased to 8.66%. During the years of 1999-2013 the rain with torrential character (25 mm/day < P) increased by 50% especially during the warm period of the year (Table 5, Table 6).
The same evaluation was made for the daily precipitation data of the Göztepe Meteorological Station (Table 7, Table 8). Despite the varying rates, the general trend of the results confirmed the data of the Florya Station given above. When comparing to the period of 1960-1974; during the period of 1999-2013 the total number of rainy days was reduced by 18.1 % while in the number of rainy days with less than 25 mm rain 18.4% of reduction was observed. Unlike the result of Florya Station, the number of days with more than 25 mm decreased by 7.5% during the period of 1999-2013 years (Table 7, Table 8). When considering the seasonal distribution of the results; despite the decrease in total number of rainy days and in the number of rainy days with less than 25mm during the period of 1999-2013 years in both rainy (October-April) and warm (May-September) period, the rate of decrease was greater during the warm period of the year. The rate of decrease in the number of rainy days with less than 25 mm during the rainy period was 16.8%, while during the warm period the rate of decrease was 23.61%. When comparing the number of rainy days with more than 25 mm; despite the reduction of torrential rains by 22.22% during the period of 1999-2013 (25 mm/day < P) during the warm period of the year, an increase of 22.73% occurred. This situation is a very noticeable and significant change.
The reduction in the number of light and moderate rainy days during the warm period can be associated with the increased warming of the environment [27] . In Istanbul’s precipitation statistics; the differentiation in seasonal distributions (Tables 2-8) belonging to the amount, type and frequency of the precipitation confirmed this approach’s status related to the observed warming trends for Istanbul.
3.3. Changes on the Temperature Characteristics
It was understood that on a global scale, the annual average temperatures observed on land the ocean surface during the period of 2001-2005 (5 years) were rising by 0.76˚C (±0.19˚C) when being compared to the period of 1850-1899 (50 years). The linear warming trend during the last 100-year period (1906-2005) was 0.74˚C (±0.18˚C). In the last 30 years the rate of global warming in every 10 years was realized by an increase of ≈0.2˚C [28] [29] . When analyzing statistically the temperature which was observed in Istanbul in the last 54 years it seems to be similar to the trend of global temperature rising. When comparing the observations of the annual average temperature observed in Istanbul during the period of 1999-2013 to the period of 1960-1974 the annual average temperature of the last 15 years was increased by 1.1˚C according to the observations of the Florya Station and 0.9˚C according to the observations of the Göztepe Station (Table 9). Another changing feature of the temperature which was observed in Istanbul during the period of 1960-2013 is the rise of the monthly average temperatures in the last 15 years and the prolongation of the warm period within a year (Table 2, Table 3) (Figures 2-5). The monthly average temperatures produced from the average daily temperature were given in Figure 2 and Figure 3. Both of the graphics showed that in the past 15 years in Istanbul there was an increase in the monthly average temperature rise, this rise occurred more frequently especially during May-September, and the warmer season of the year included 7 - 8 months by increasing with 3 - 4 months.
3.4. Changes in the Type of Climate
The daily temperature and precipitation data sets which cover a period of 40 - 50 years are important classification parameters used in the determination of a region’s climate type. The observations of the daily temperature and precipitation made in Florya and Göztepe Station during the 1960-2013 years, period of 1960-1974 and the period of 1999-2013 were analyzed to determine whether there was a change in the climate type of Istanbul or not. In the determination of the climate type, the De Martonne and the Thornthwaite climate type analyses were performed by using the temperature and precipitation data of both stations.
3.4.1. De Martonne Climate Type Analysis
De Martonne Aridity Index is one of the analytical methods used in the determination of the climate type and in the detection of the changes occurred in the climate type [30] -[33] . The De Martonne Aridity Index values determined by using the daily temperature and precipitation observations which covered a long period, define
Table 9 . Observed changes on annual average temperatures in Istanbul.

Figure 4. Monthly average temperatures of Florya.

Figure 5. Monthly average temperatures of Göztepe.
specific climate types [34] . The monthly and annual index calculations (Table 10) [35] were performed separately for the data of Floryaand Göztepe Stations (Table 11, Table 12). The results of both stations’ annual analysis were identified the same as “semiarid-humid” both for the 54-year and for the 15-year period too. However, differences were determined in the monthly aridity index and climate types. Especially the extremely low index in April, May, August and September during the last 15 years were noteworthy which might lead to the differentiation of the climate type.
3.4.2. Thornthwaite Climate Type Analysis
In order to determine the differentiation in the climate features of Istanbul, the Thornthwaite climate classification method was applied. The Thornthwaite climate classification is an analysis method which is based on the physical interaction between the data of local humidity and temperature rather than only on the data of precipitation and temperature [36] . This classification represents a more complex and sensitive analysis methods by taking the balance of the local surface water into account. The Thornthwaite climate classification was carried out comparatively for the 15-year periods by using the observation data of the Florya and Göztepe Stations. The results were similar in a very large ratio, the analysis results of both stations were given summarized in Table 13 and Table 14 (Figure 6). When comparing the climatic data of the Florya and Göztepe Stations during the period of 1999-2013 to the period of 1960-1974; it was determined by the Thronthwaite climate classification that the use of water increased in the period of May-June, the deficiency of water increased during the month of June, July, August and September, the annual water deficiency increased by 17.10% and the monthly PE amounts increased during the month of March to September and it increased annually by 7.85% (Table 13, Table 14, Figure 6).
The same climate class was determined for both stations in the Thornthwaite classification of the different periods by using the climatic data sets of the Florya and Göztepe stations (Table 15). The results referred to “semi-humid (C2 B’2 s2 b’4)” climate type in the period of 1960-1974 and to “arid and less humid (C1 B’2 s2 b’3)” climate type in the period of 1999-2013 (Table 15). The transition from C1 to C2 in the first letter of the climate type in the Thornthwaite climate classification showed a significant change; this change defined the transition from “humid” climate to “arid” climate [36] .
Table 11. Monthly and annual De Martonne aridity index, and climate types depended on data sets of Florya.
Table 12. Monthly and annual De Martonne aridity index, and climate types depended on data sets of Göztepe.
Table 13. Thornthwaite annual water balances depended on climatic data set of Florya station (WS: Water surplus, Storage Change, RW: Recharge, Water Deficiency, PE: Potential Evapotranspiration).
Table 14. Thornthwaite annual water balances depended on climatic data set of Göztepe station (WS: Water surplus, SMU: Soil Moisture Utilization, SMR: Soil Moisture RW: Recharge, Water Deficiency).
4. Conclusions
Table 15. Thornthwaite climatic classification for different periods of Istanbul.
The decrease in the annual total precipitation and the increase in the annual average temperature during the period of 1960-2013 were very remarkable. During the 54-year period, in Florya 3 of the 5 driest years occurred in the period of 2006-2013, while in Göztepe 3 of the 4 driest years were observed during 2007-2013. In the same period the average of the annual maximum temperature (15.5˚C < T < 16.0˚C) occurred 6 times
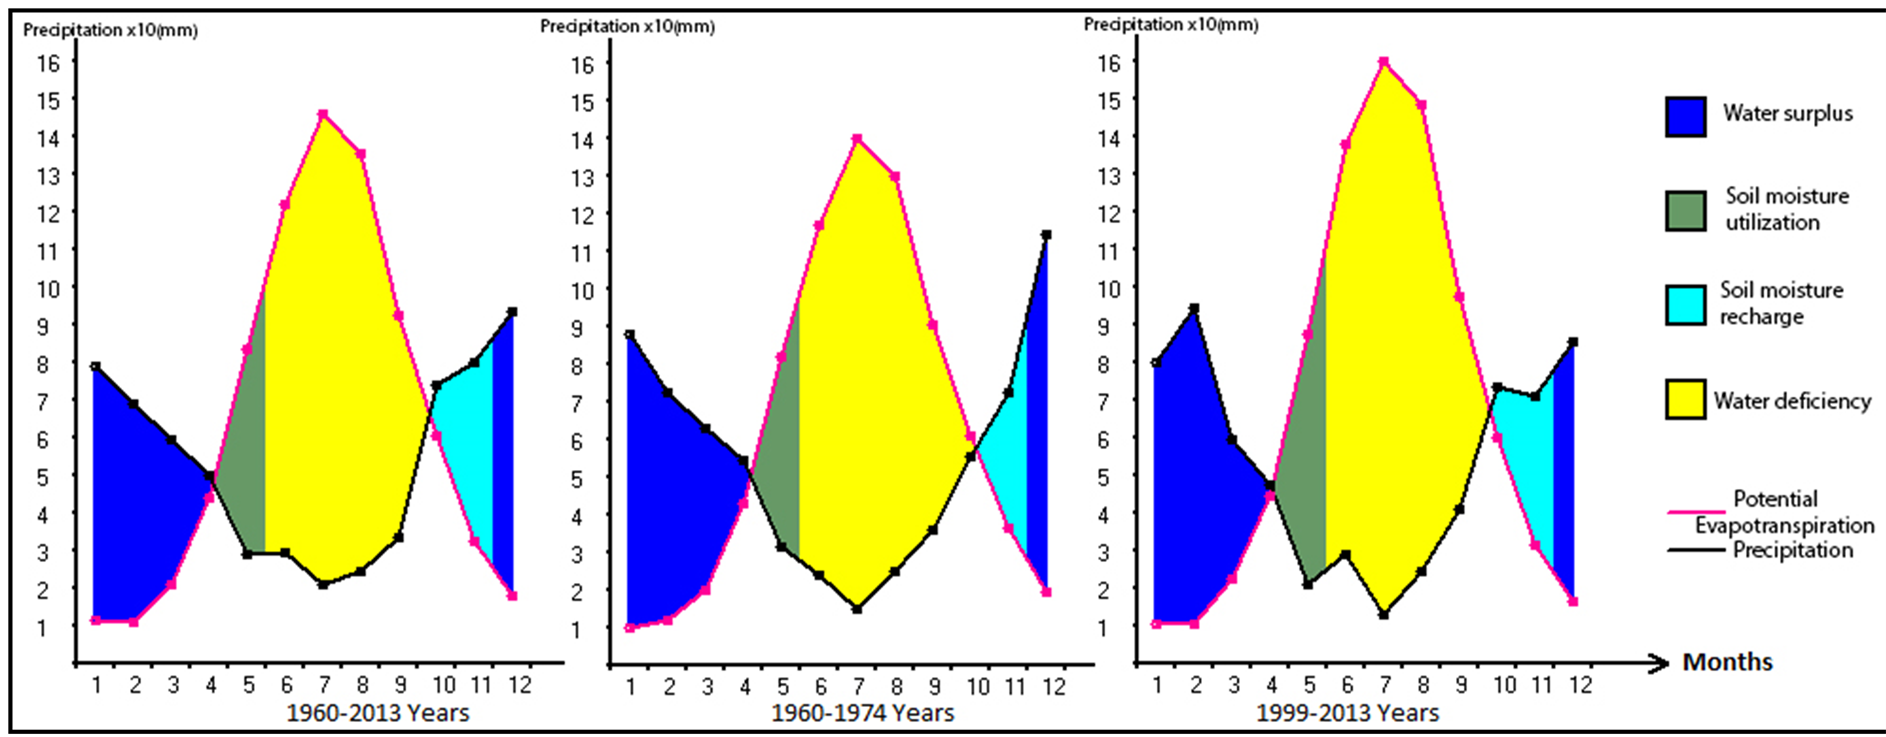
Figure 6. Annual average precipitation and potential evapotranspiration at Florya and Göztepe stations in Istanbul.
in Florya and all of them happened during 2001-2013, while in Göztepe it occurred 8 times and all of them were observed during 1999-2013 years. The fact that the driest and warmest year was realized in the 2000s was one of the important evidences of the change in the climate of Istanbul; this case also supported the global trends. The statistical trend of the annual precipitation and temperature values during the 54 years; the annual total amount of precipitation in Istanbul was decreasing steadily, while the annual average temperature was rising increasingly. When considering the 15-year periods; the average precipitation in the last 15 years was less than the average of the 54-year period and the average of the first 15 years. The average temperature in the last 15 years was higher than the average temperature of the 54-year period and the average temperature of the first 15 years.
When comparing to the period of 1960-1974 during the years of 1999-2013 the number of rainy days in Istanbul reduced similarly; the number of days with less than 25 mm of daily rain and the fact that this reduction occurred during the hot period (summer season), identified the downpour rain; the rise in the number of days with more than 25 mm of daily rain made it understood that 50% of this increase occurred especially during the warm period. This differentiation observed in the precipitation characteristics in Istanbul indicates a shift towards the precipitation pattern belonging to the arid-semiarid climate.
When examining the change characteristics of the annual average temperature in Istanbul for the period of 1999-2013 by comparing it to the annual average temperature of both the period of 1960-2013 and the period of 1960-1974, it was understood that the annual temperature of the last 15 years was higher than the annual temperature of the other 2 periods. In addition, when comparing the annual average temperature to the first 15-year period; a rise of 0.9˚C - 1.1˚C was determined in the annual average temperature in the last 15 years. This increase in the temperature of Istanbul showed consistency with the rise of the global temperature.
Both the rise of the monthly average temperature and the extension of the year’s hot period mean at the same time an increase in the severity and in the duration of evaporation. This situation brings the “water shortage” in Istanbul to a different size within the context of water management and makes it very important. This condition should be considered for Istanbul is a very important issue.
These changes in the precipitation and temperature characteristics of Istanbul investigated the effects of the climate type of Istanbul. For this, the climate identification by using the De Martonne drought index and the Thornthwaite climate classification analysis were made. In the De Martonne climate classification both the monthly and annual aridity index formulas were applied. When comparing the 15-year periods, the same conclusion was reached for both periods, the annual aridity index suggested that Istanbul belonged to the “semiarid-humid” climate type. However, in the last 15 years the monthly aridity index showed some differences. This differentiation emerged in the form of “arid, arid/semiarid” climate types changing each other in monthly periods within a year.
In the results of the Thornthwaite climate type analysis, it was stated that Istanbul has changed from “semi-humid” to “arid and less humid” climate type in the last 15 years. Also, the increase in the evaporation arising due to the changes in the precipitation and temperature characteristics during the last 15-year period is remarkable as an important climatic variation that should be considered in the annual water balance in Istanbul.
The results above reveal comparatively the variations of Istanbul’s precipitation and temperature characteristics observed in the last 15 years. Results indicate that important climatic changes such as the rise of temperatures, the lengthening of the warm season, evaporation aggravation, decrease in annual rainfall and number of rainy days, increase on the torrential summer rainfall over Istanbul will be increasingly effective in following years. For adaptation to these and more climatic differentiations, results of this study are recommended for consideration and use when reconsidering strategically the issues such as “Water management”, “Disaster Management”, “Infrastructure Planning and Project Implementations” and revising the related plans and projects. This recommendation is very important in every sense for Istanbul and for the 14 million people living in Istanbul.