A Study on the Wave Screening Effectiveness According to Trench Dimensions Using Ultrasonic Waves ()
1. Introduction
The competitive increase of large scale construction sites and production facilities in response to the recent industrial boom of our society is accompanied by the gradual rise in the severity of vibration pollution. Especially, the trend reducing the vibration allowances in industrialized countries requires imperatively solutions to such vibration pollution. Among these solutions, there are the method hindering the generation of the vibration at the source, the method screening the vibration by obstructing the flow path of the vibrational wave and, the method damping the vibration at the receiving point. For the method screening the vibration by obstructing the flow path, the proposed anti-vibration barriers screen essentially the surface wave since most of the vibration propagates through the surface wave. Its and Yanovskaya [1] and Its and Lee [2] -[5] investigated analytically this surface wave scattering effect using the Green’s function. However, such analytic approach presents some limitations like the impossibility to consider the complicated shape of the anti-vibration structure or the transformation of the surface wave into bulk wave at the boundary. Accordingly, experimental and numerical studies shall be conducted concurrently to the analytic study in order to investigate the scattering effect of the anti-vibration barrier.
The boundary element method (BEM) remains the preferred numerical technique to examine the wave propagation. There is also the technique combining the finite element method (FEM) and BEM but this technique fails in avoiding the complexity of the elements. This study intends to apply directly FEM to take full advantage of its transparency. The considered problem is limited to two-dimensional domains and absorbing boundary [6] is adopted in order to solve the resulting computational burden. In addition, ultrasonic test is conducted using a specimenss made of acryl that is an isotropic material to verify the validity of the numerical analysis results.
2. Modeling of Semi-Infinite Foundation
2.1. Absorbing Boundary Element
In the case where an infinite domain is modeled by means of finite sub-domains, reflection of the wave will occur when the wave reaches the finite boundary and, will have significant effect on the response of the whole structural system. The artificial absorbing boundary was proposed to annihilate the effect of the reflected waves and is now used in wave propagation problems. To date, Lysmer-Kuhlemeyer [6] , Engquist-Majda [7] and LiaoWong [8] proposed boundary elements. Among them, the method suggested by Lysmer-Kuhlemeyer [6] is the most effectively applied in common numerical analysis models. This method realizes the absorption of the wave by attaching dashpots on the boundaries of the element, which makes it easily applicable in common FEM programs. Figure 1 shows the numerical model established to examine the performance of the absorbing boundary [6] used in this study. Table 1 arranges the corresponding absorption ratios.
2.2. Modeling of Semi-Infinite Foundation
In order to simulate accurately the wave propagation problem, the optimal size of the element and the analysis time step shall be determined with respect to the wavelength. In general, the optimal size of the element and the analysis time step are inversely proportional to the accuracy but the use of an excessively large number of ele-

Table 1. Absorption ratio with respect to the position of the receiver.
ments and excessively short analysis time step will surcharge the computational burden. Therefore, this study adopts an element size of about 1/12 of the minimum wavelength known to be appropriate in wave propagation problems while securing the accuracy [9] . The analysis time step is set to 1/10 of the applied load duration so as to express accurately the wavelength of the surface wave changing with the loading duration. This value of the time step is also seen to satisfy sufficiently the stability condition. Moreover, implicit method is applied for the time history analysis because it is more stable than the explicit method and also because the number of elements to be used in this study is secured.
2.3. Representation of Damping Characteristics
Since the stress wave propagating through the medium undergoes geometric damping as well as material damping, these damping effects shall be imperatively reproduced in the numerical analysis. The geometric damping depends on the propagating characteristics of the stress wave and is naturally reproduced in the computational process of the governing equations. This is not the case for the material damping, which is represented using the Rayleigh damping (ζ = 0.0175) in this study with respect to the experimental results. Figure 2 plots the damping curves of the surface wave representing the experimental results and the results of the numerical analysis without consideration of the material damping. In the numerical analysis results of Figure 2, it can be seen that, due to the geometric damping and in disagreement with the experimental results, the peak displacement of the surface wave reduces with larger distance. On the other hand, the numerical results in Figure 3 are seen to reflect appropriately the damping characteristics of the experiment since the material damping is considered.
3. Numerical Analysis
3.1. Computation of Analysis Variables
Figure 4 displays the analysis variables made dimensionless by dividing them the wavelength ( ) of the surface wave and Table 2 arranges their ranges. The vibration screening effect is defined by the amplitude damping ratio expressed in Equation (1) for the relative comparison of the analysis results.
 (1)
(1)
3.2. Analysis Model and Load
As shown in Figure 5, two-dimensional plane strain elements are used for the numerical analysis and the medium is assumed to be isotropic elastic. In addition, absorbing boundaries [6] are attached to the bottom boundary to lighten the computational burden. The impact load of Figure 6 is applied and the physical properties of the medium are arranged in Table3 Figure 7 plots the damping ratio of the surface wave caused by the trench with respect to the distance. Comparison is done with the analytic results of Ahmad [10] who used BEM. Both analytic results show steep decrease of the damping ratio after the trench with slight difference. This difference can be attributed to the difference in the applied surface wave length and damping values but the overall trend is similar.

Figure 5. Numerical analysis model (with trench).
Table 2. Range of analysis variables.
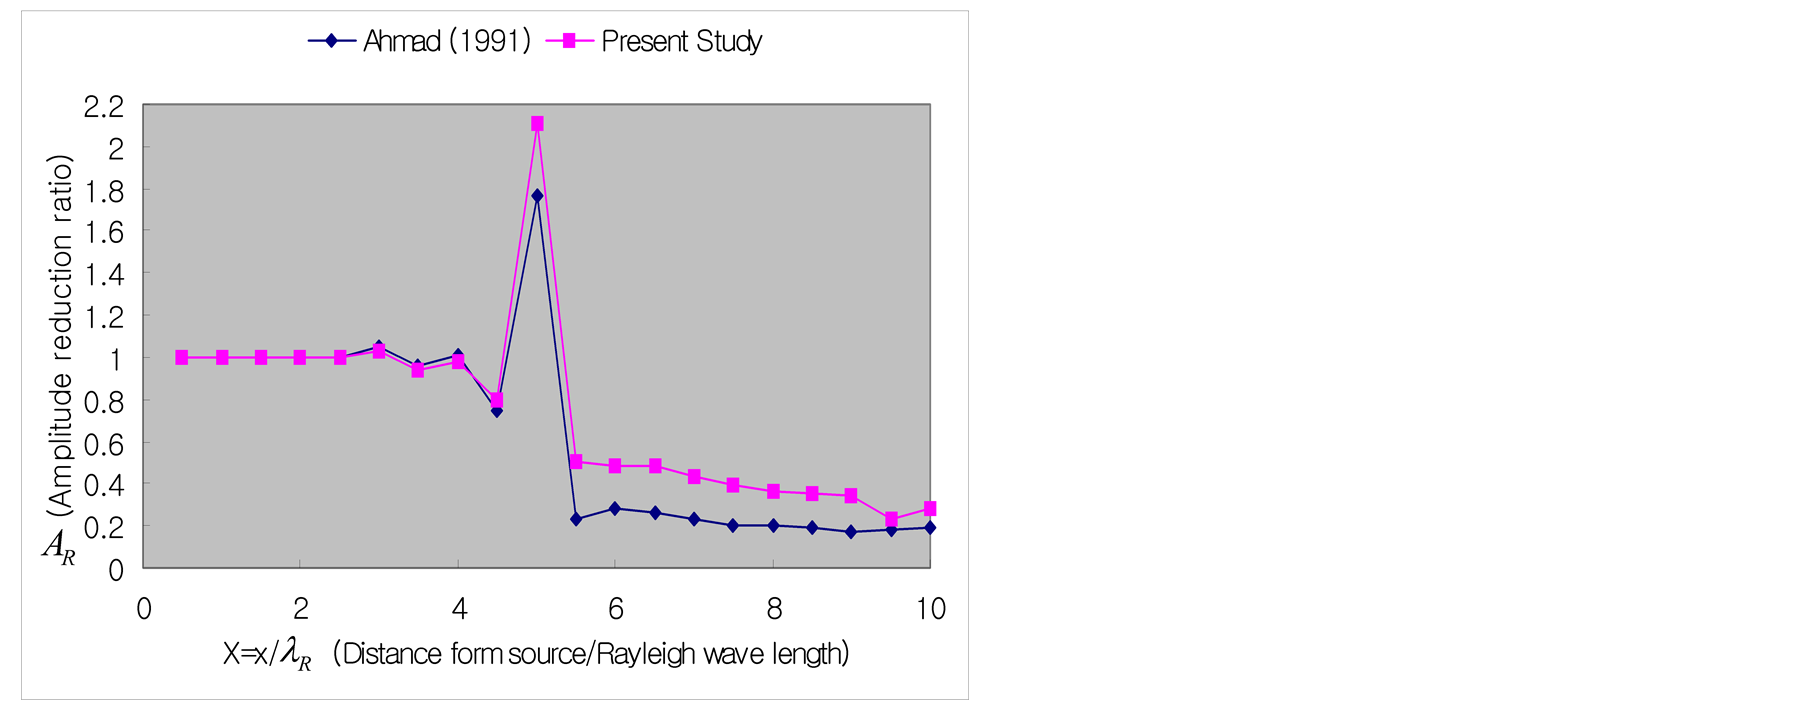
Figure 7. Damping ratio (L = 5.0, D = 1.0, W = 0.1).
Table 3. Physical properties of considered medium (acryl).
3.3. Scattering Effect According to Analysis Variables
Figure 8 plots the results of the numerical analysis considering all the variables of Figure 4. The L-axis and X-axis represent respectively the distance from the excitation source to the receiver and the distance from the receiver to the trench. The vertical axis is the amplitude damping ratio defined in Equation (3.1).
Figure 9 plot the results for the cases where D = 0.6, X = 2.0 and 6.0 in Figure 8. It can be seen that the width of the trench has no effect when the distance between the source and the trench is larger than L = 2.0. Moreover, identical results can be obtained in the cases where D = 0.2, 0.4 and, X = 4.0 and 8.0.
Figure 10 presents the damping ratio according to the depth (D) of the trench when 0.4 £ L £ 4.0 and, X = 3.0 in Figure 8. In Figure 10(a), the damping ratio decreases monotonically with larger depth of the trench. Beside, in Figures 10(b)-(d), a point of inflection occurs around D = 0.5 so that the damping ratio reduces smoothly after D = 0.6. This can be explained by the fact that, when L = 0.4, the source and the trench are close and make a large proportion of the surface wave energy crossing the bottom of the trench. Following, different patterns can be observed if the source and the trench are close (L < 1.0 in this study) or not.
4. Comparison with Experimental Results
In order to verify the validity of the numerical analysis results, ultrasonic experiment is conducted using a spe-

Figure 8. Vibration screening effect according to the installation conditions of the trench.
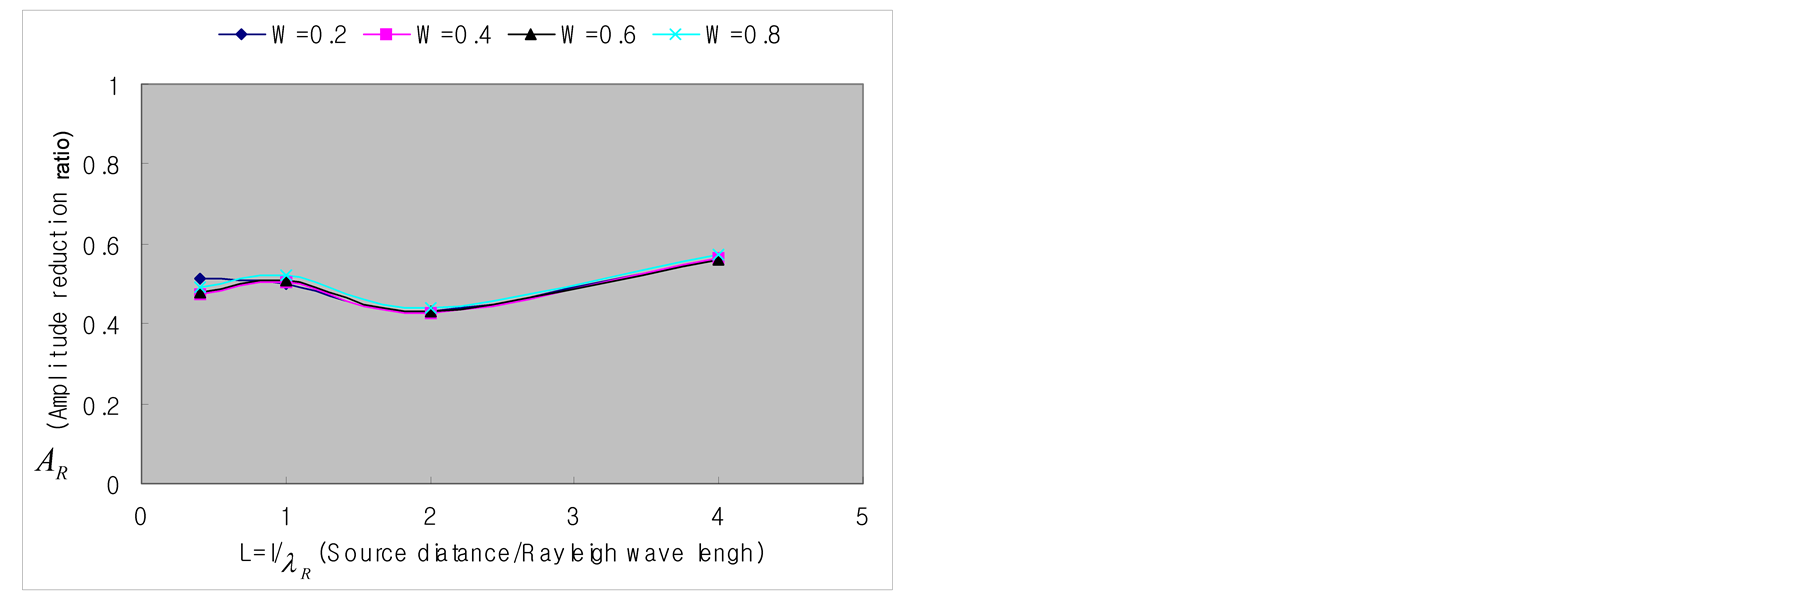

Figure 9.Vibration screening effect of surface wave according to the distance from the source.
cimen made of acryl known to be isotropic. Figure 11 shows a scene of the ultrasonic experiment and Table 4 lists the specifications of the corresponding testing equipment. The physical properties of the acryl specimen are arranged in Table3
Figure 12 plots the experimental results corresponding to the numerical analysis results of Figure 9. Similar-
Table 4. Specification of testing equipment.
ly to Figure 9, the width of the trench has no effect when the distance between the source and the trench is larger than L = 2.0. Identical results are also obtained in other cases (D = 0.2, 0.4, 0.8; X = 4.0, 8.0).
Figure 13 plots the experimental results corresponding to the numerical analysis results of Figure 10. The damping ratio also decreases monotonically with larger depth of the trench similarly to Figure 10 but the damping ratio becomes constant at D ³ 0.6 when L ³1.0. The numerical analysis results of Figure 10 showed a smooth decrease of the damping ratio for D ³ 0.6 even if the decrease was monotonic. On the other hand, the experimental results of Figure 13 appear to be practically constant. This discrepancy can be attributed to the intrinsic difference between the two-dimensional numerical analysis and the three-dimensional test as well as to
 (a) X = 2.0 (ultrasonic experiment)
  (b)X = 6.0 (ultrasonic experiment)
Figure 12.Vibration screening effect of surface wave according to the distance from the source.
the difference in the damping mechanism. However, the experiment and the numerical analysis results can be seen to agree to each other with regard to the facts that the amplitude damping ratio has no relation with the width of the trench when L ³ 2.0, and that the amplitude damping ratio is practically constant for D ³ 0.6.
5. Conclusions
This study investigated the scattering behavior of the surface wave according to the position and shape of the anti-vibration trench. This behavior was examined using a finite element model adopting absorbing boundaries. Ultrasonic experiment was also conducted on a specimen made of acryl known to be isotropic to verify the validity of the analysis. The proposed numerical model simulated accurately the scattering behavior of the surface wave and enabled to identify significant difference according to the shape and position of the trench. In addition, similar trend could be observed between the numerical analysis and experimental results. The following conclusions can be drawn.
(1) Modeling the semi-infinite domain using absorbing boundaries by means of finite sand boxes enabled to reduce the computational burden, and the damping characteristics of the surface wave could be reproduced by introducing the damping ratio obtained experimentally in the numerical analysis.
(2) For distance between the source and the trench longer than twice the surface wave length, the amplitude damping ratio appeared to be indifferent to the width of the trench.
(3) A constant amplitude damping ratio was observed when the distance between the source and the trench was larger than 1 time the surface wave length and the depth of the trench was larger than 0.6 times the surface wave length.
(4) The finite element analysis technique using absorbing boundaries proposed in this study enabled to perform the simulation in time domain without excessive computational effort. Accordingly, this technique provided a useful analysis tool for the design of more effective trench.
(5) Different behaviors were observed according to distances between the source and the trench larger or shorter than 1 time the surface wave length (near field). Further studies should be implemented on this topic.
Acknowledgements
This work was supported by the “Development of Precast Wind Tower using SUPER Concrete” project. The authors express their gratitude for the support.
NOTES
*Corresponding author.