Determination of Fatty-Acid Composition in Oils of Animal Origin by Near-Infrared Spectroscopy ()
1. Introduction
Interest in milk quality has grown steadily in recent years. Through published health-related researches, for example about saturated and unsaturated fatty acid, consumers have become more attentive to the quality of dairy products [1] . The results of recent studies on milk’s nutritional properties have substantially broadened consumer awareness of its relative healthiness. Meeting such information demands entails enforcing increasingly stricter control of the quality of dairy products [2] . Group of researchers studied a microbiota of Kazakh national milk products including camel milk and determined that camel milk can stabilize insular diabet, gastric ulcer, hepatits etc. therapy [3] -[6] . The milk industry is an actual research field according to the industrial and innovation strategy of Kazakhstan [7] .
In response, several national institutions such as Sanitary Control and the Food Committee in Kazakhstan have issued directives and standards that set the quality parameters for dairy products, particularly for mare milk which is a major export product. Also it is a popular food supplement used for the alleviation of certain diseases [8] [9] . The aim is to guarantee overall quality by ensuring that the quantity of saturated and unsaturated fatty acids meets the stated specifications. In order to establish additional local standards for specific products, local agricultural authorities can issue directives of their own which are added to the national authorities. These are “Denominations of Origin” (DO) which define standard criteria for products in the same category, particularly with respect to “organic” production, feed requirements, the specification limits for different components etc. The assignation of a product to a given DO also requires that the product, e.g. milk, meets specific quality standards, so providing an additional benefit to the consumer. In this respect, we have studied samples of cow, goat, mare and camel milk in order to identify characteristics, which allow classifying the samples with common features with their discrimination from each other. This approach has been undertaken through the use of various analytical techniques including GC and NIR. Near-infrared spectroscopy analysis is a cheap method compared to other methods such as GC, HPLC, etc. It is confirmed by economy related to the cost of acquisition of chemical reagents for sample preparation and time aligned with it [10] .
2. Materials and Methods
First, confirm that you have the correct template for your paper size. This template has been tailored for output on the custom paper size (21 cm × 28.5 cm).
Milk fat samples from cow, camel, goat and mare milk were obtained for this study. The extraction and determination of fatty acids were carried out by the method of butylation to produce the corresponding ethers. For this purpose a 100 ml volumetric flask was filled with 50 ml of predistilled n-butanol and 2 ml of concentrated sulfuric acid was added.
Then 1 ml of 2% solution of concentrated sulfuric acid in butanol was added. Test-tubes with tightly closed with caps were placed into an oven preheated to 100˚C. The butylation process was completed within 30 minutes. The test tubes were left cool to room temperature at which point and 5 ml of hexane and 20 - 25 ml of distilled water were added. The test tube was then shaken vigorously and left to stand until full phase separation was achieved. The upper hexane layer was used for the gas chromatography analysis.
The butyl esters of fatty acids were quantified by gas-liquid chromatography on a Shimadzu GC-2010 Plus gas chromatograph, equipped with a flame ionization detector and capillary column Wax 30 m long × 0.25 mm i.d. The analysis was performed using temperatures programmed at 250˚C for the injector and detector, and for column 40˚C - 100˚C for 10 minutes and 100˚C - 200˚C for 30 minutes. In analysis the ratio of signal and noise was 40000:1.
The individual fatty acids specified by the standard mixture (Supelco Park, USA) were identified by retention time and measured as a percentage of the total content.
The near infrared spectra (NIR) of the various types of oil were measured on a Yokogawa NR 800 near infra red analyser. Sample preparation for the myristic acid standard, for NIR analysis, was by hexane extraction. The NIR spectra were obtained by using glass cells (PYREX® 7740, Japan) of 1 mm light path.
3. Data Processing
NIR spectral data were exported from the Sland software to the JCAMP.DX format and then transferred to the Unscrambler software for graphical plotting and subsequent data processing. Selected points of the spectra were processed by second derivative to remove background and increase spectral resolution and Savitzky-Golay smoothing was applied to eliminate noises which might cause distortion of spectral signals. This method can greatly facilitate the analysis of fatty acids.
4. Results and Discussion
Figure 1 shows the GC chromatograms of fat acids from various types of milk.
Calculated content of individual fatty acids are given in Table1 The table clearly shows that the fatty acid composition obtained from different samples differed substantially.
Camel fat contained the highest level of myristic (C14:0) and stearic (C18:0) acids. There are the same amounts
 (a)
(a) (b)
(b)
Figure 1. GC chromatograms of fatty acid butyl esters: (a) Cow milk fat; (b) Camel milk fat; (c) Goat milk fat; (d) Mare milk fat.
of pentadecanoic acid (C15:0) in all four studied samples. Whereas butter from mare milk had a small amount of stearic acid (C18:0) and there was not found any arachidic acid (C20:0).
The analytical data indicated that butter from mare and camel milk have a significantly high percentage of palmitooleic acid (C16:1w7) and oils from cow and goat milk contained palmitic acid (C16:0). Thus the studies show that oils from cow, camel, goat and mare milk can be identified by their fatty acid compositions [11] .
Some NIR spectra of milk fat adulterated in the 11,000 - 4000 cm−1 region are shown in Figure 2. There are small differences around 5839 cm−1. These small differences can be easily explored by multivariate data analysis. The NIR band assignments for fats are given in Table2 When an oil sample is adulterated, the fatty acid composition of the oil is changed. The changes in the spectral profiles reflect little regarding the change in the composition. However, whether the changes in the profiles are small or large, the whole spectrum of the pure sample is affected.
Figure 3 shows NIR spectra of fatty acid with various oils. Even though acids do not have strong absorption peaks in the NIR region, their ions affect the hydrogen bond of fatty acids and alter the peak height of the CH2 first overtone band at 5785 cm−1. By using this hydrogen bond related information, a calibration equation with high correlation coefficient could be obtained (Figure 3). The regression coefficient plots (5785, 5901 cm−1) show that the model could pick up the information related to CH2 absorptions [12] [13] .
The application of NIR spectroscopy in this study quickly determined the distinction in the concentration of fatty acids in the oils produced from cow, mare, goat and camel milk. There was used 11,000 - 4000 cm−1 region as detection limit for each sample due to similar composition of cow, mare, goat and camel milk.
As shown in Figure 4, the main absorption peaks of the samples were observed in the wavelength 5785 cm−1 and 5901 cm−1 where 5785 cm−1 is characteristic for the carbon-hydrogen bonds in the groups—CH2—the hydrocarbon chains of fatty acids to the first overtone, as the wavelength 5901 cm−1 stands for the CH3 groups [14] .

Table 1. Fatty acid composition of animal origin milk fats.
The 4000 - 11,000 cm−1 wavelength region of second-derivative spectra showed that differences in absorption range between investigated samples was at 5901 and 5785 cm−1 maximum. The absorption at 5901 cm−1 (minimum the second derivative) is associated with the presence of linoleic acid oils, whereas the absorption at 5785 cm−1 is characteristic for oleic acid [15] . The ratio of above mentioned fatty acids in camel milk fat differed from the other samples in having a large percentage of oleic acid which is suggested in the gas chromatography analysis. It allows an accurate determination of the proportion of camel milk fat in its mixtures with other fats.
Figure 5 the NIR analysis gave spectra that had especially characteristic absorption bands for the oil component with maximal values at about 4150 cm−1 and 4227 cm−1 corresponding to the stretching vibration mode of the hydrocarbon bonds compound [10] . In Figure 3 was shown absorption bands which are very visible in the

Figure 2. Near infrared spectra of sulfuric acid (X: 1000 - 4000 cm−1).

Figure 3.Scatter plot for predicting fatty acid concentration of the validation samples.

Figure 4. The wavelength range of fatty acids at 5901 (a) and 5785 (b) cm−1.
spectra of fats obtained from different types of milk.
In addition, fats and oils had weak absorption bands at about 8192 cm−1 (the second overtone of CH stretching vibrations), 4659 cm−1 (compound stretching vibration frequencies of C-H and C=C).
5. Conclusion
The application of NIR spectroscopy in the analysis of fats with fixed wavelengths, to determine fatty acids
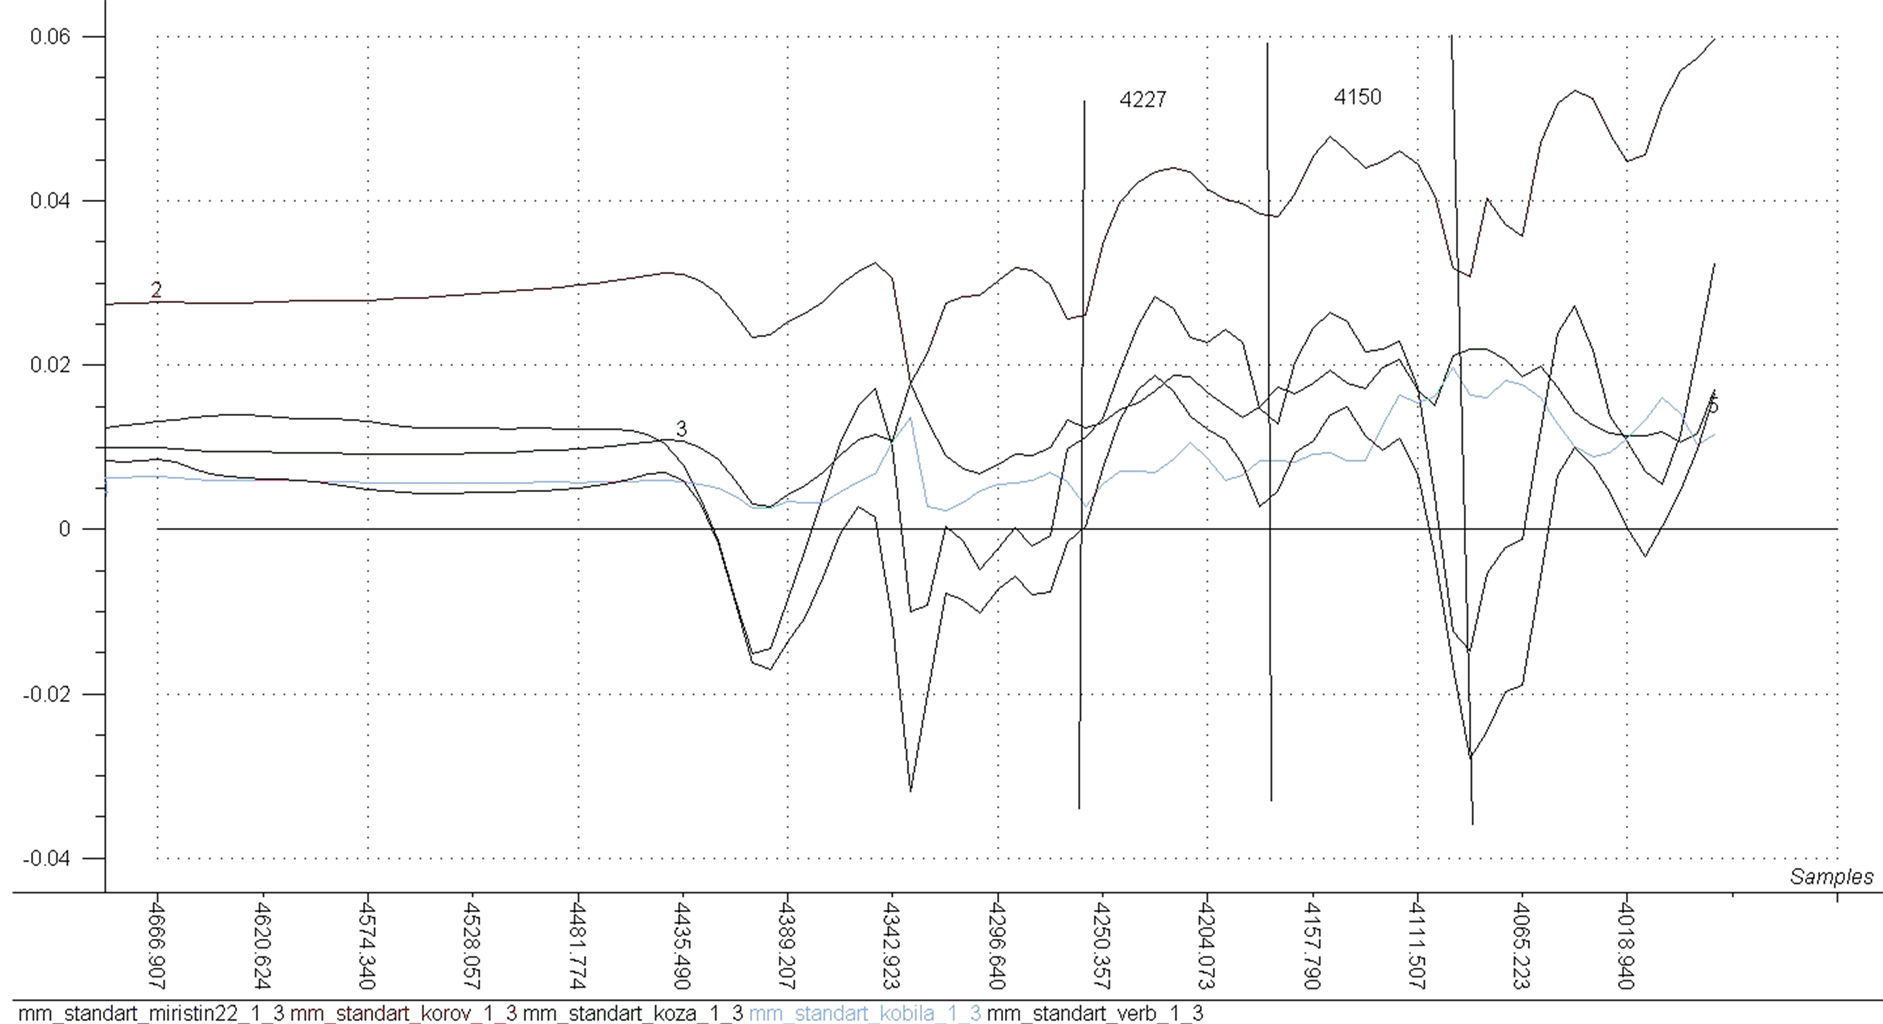
Figure 5. The absorption spectra of fatty acids of stretching vibration mode.
from cow, goat, camel and mare milk gave very good results. We have determined that the analysis of fats from various milk oils can be used as a determinant of quality through gas chromatography as well as by NIR spectroscopy methods.
NOTES
*Corresponding author.