Physical and Chemical Matrix Effects in Soil Carbon Quantification Using Laser-Induced Breakdown Spectroscopy ()
1. Introduction
Increased greenhouse gas (GHG) concentrations in the atmosphere and consequent global warming are of great concern to a large part of the world’s population. Actions to reduce GHG emissions and increase mitigation are expected from governments and those involved in agriculture, which is recognized as one of the major sources of these gases. Soil carbon (C) content is one of the essential parameters used to evaluate the impact of land use change on the basis of soil C stocks and soil C sequestration [1] .
A variety of techniques is used to estimate soil organic matter, and more specifically soil C content [1] -[3] . Wet combustion methods, such as Walkley-Black titration, are routinely used in most soil laboratories, mainly because they can be easily performed with simple instrumentation. However, these techniques are time-consuming and have certain limitations; they produce toxic residues and the results are not reliable. More recently, dry combustion methods using automated instruments have been used as reference techniques for soil C determination [2] [4] [5] . However, automated methods tend to be more expensive due to the initial purchase of the instrument, plus the cost of reagents and materials for analysis.
Laser-induced breakdown spectroscopy (LIBS) has been assessed as an alternative method to quantify total soil C content [6] -[15] . LIBS is based on atomic emission spectroscopy, in which a laser is focused on a solid sample and forms a microplasma that emits light characteristic of the elemental composition of the sample. The emitted light is collected, spectrally resolved, and detected to monitor concentrations of elements via their unique spectral signature. When properly calibrated, the method provides quantitative measurements. As previously mentioned, the main advantages of LIBS are the potential for soil analyses with minimal sample preparation, the speed of processing samples and the low cost of analysis, compared with dry combustion reference methods. However, LIBS has some precision limitations with regard to variation in the physical and chemical properties of the different materials present in soil, known as matrix effects [12] [14] [16] . After these limitations have been solved and the system has been calibrated using samples with known concentrations of an element of interest, LIBS has been used for determining metals, minerals, C and other important elements in soil [11] [12] ; therefore, there is great potential for the development of portable LIBS equipment for the field-based quantification of C in soil [8] [17] .
Advanced field methods for C analysis should now be capable of providing repetitive, sequential measurements for the evaluation of spatial and temporal variation at a scale that was previously unfeasible [18] . The aim of this study was to estimate soil C content from soils of different textures in a Brazilian livestock system, using LIBS. Considering that Brazilian soils are rich in iron (Fe) and aluminum (Al), and in LIBS spectra, the carbon signals are interfered with by these elements, our proposal was to develop a simple method to mitigate this interference and make C quantification possible for soils with different textures. The dry combustion method was used as a reference method. The purpose of working with a textural model for C determination serves as a basis for the future development of portable systems.
2. Materials and Methods
2.1. Experimental Location and Soil Collecting
Soils were collected from the Southeast Livestock Research Center of Embrapa, located in São Carlos, state of São Paulo, Brazil. These soils were from a livestock area, in a transitional texture area with two major soil types: Red Latosol and Red Alfisol. Soil samples were collected from different areas of treatment management, at depths of 0 to 100 cm; six replicates were collected for each soil management. Considering all of the treatments, the total number of soil samples analyzed was 240.
Soil texture classification of these samples was performed using texture triangle classification, as determined by the pipette method, and based on the United States Department of Agriculture (USDA) system of particle size.
2.2. Sample Preparation
Soil samples were air-dried, crushed and ground in a mortar, then passed through a 0.150 mm sieve. The total C concentration reference was analyzed using a 2400 CHNS/O analyzer series II from Perkin-Elmer. These same homogenized soil samples were also used to produce pellets for LIBS analyses. Pellets were prepared according to Nicolodelli et al. [15] . Two pellets for each soil sample were made, in order to guarantee representativeness of the sample and improve the signal/noise ratio.
2.3. LIBS Setup, Spectral Correction and Soil Analyses
The LIBS spectra were obtained using a LIBS2500 (Ocean Optics, USA) system. This system includes seven spectrometers that are capable of producing a resolution of ∼0.1 nm (FWHM) for spectral analysis ranging from 188 to 980 nm, a Q-switched Nd:YAG laser at 1064 nm (Quantel, Big Sky Laser Ultra50), an ablation chamber, a lens for laser focalization, and an optical system to collect the plasma emission and send it to the spectrometers. A laser pulse of 50 mJ energy and duration of 8 ns were used for all measurements. The laser had a fluence of 1.2 × 10³ J∙cm−2 and the spot sampling diameter of the soil pellets was 73 mm. The delay time (relative to a Qswitch delay) and integration time used were 10 μs and 2 ms respectively, which are instrumental fixed conditions. The fixed distance between the radiation collecting lens and plasma sampling was approximately 1 cm.
For each sample, 60 measurements were made, and each measurement corresponded to two laser shots, which generated an average spectrum. Before analysis, a laser shot was also used to clean the sample surface.
LIBS spectra have a small number of representative C signals that are intense and have high transition probabilities; in the case of the soil matrix, the most intense spectral lines suffer from interference caused by the concomitant emission of elements commonly present in Brazilian soils, mainly Fe, interfering C emission line at 247.86 nm, and Al, interfering C emission line at 193.03 nm. Carbon quantification using the C line at 247.86 nm without proper correction to eliminate or reduce Fe interference is difficult [15] . The C spectral line (at 193.03 nm), which is interfered with by aluminum, was chosen for C quantification due to the possibility for the interference to be removed, according to the method by Nicolodelli et al. [15] . After the interference had been dealt with, the C spectral line at 193.03 nm was selected and spectral corrections were performed in order to calibrate the system using detailed, previously collected soil data and soil C determinations. The procedure, called offset correction, was performed according to Nicolodelli et al. [15] .
Absolute relative errors were individually calculated from each prediction model and the LOD was estimated. The direct analysis of solid to LOD calculation is not trivial and not standardized because the blank (sample without the analyte) is difficult obtain [19] [20] . In addition, in our experiment, there was no soil sample that did not contain C, as detected by LIBS. As an alternative, the LOD was estimated based on an adaptation of the IUPAC definition ( ), where σ is the standard deviation of sample measurements with lower C concentrations [21] (an average of 60 shots), and S is the slope of the calibration curve.
3. Results and Discussion
Figure 1(a) shows a typical spectrum of plasma emission from 190 to 980 nm from soil samples. Qualitative analysis of the LIBS emission spectrum provided a “fingerprint” of the analyzed sample regarding its elemental composition [22] . As previously mentioned, the few C emission lines in the LIBS spectrum are intense or have high probabilities of transition. Moreover, the complexity of Brazilian soil elemental composition means that there are frequent occurrences of spectral interference in the few C emission lines. For instance, the C emission line found at 247.86 nm was assessed in various LIBS soil studies, due to its high intensity [6] [7] [13] ; however, as tropical soils have large amounts of Fe in their compositions, this Fe (II) line was found to strongly interfere with one of the C spectral lines. For this reason, we chose to assess the C line at 193.03 nm, which was also previously studied by our group [8] [15] .
Considering the spectral resolution of 0.1 nm, it is expected that the C emission line at 193.03 nm is affected spectral interference from Al lines: Al (II) (ionic) at 193.04 nm, and Al (I) (atomic) at 193.16 and 193.58 nm [15] . Despite this observation, we first attempted to correlate the intensity line at 193.03 nm with the C amount measured by the reference technique (Figure 1(b)). Figure 2 shows the correlation profile with determination coefficient (r2) = 0.18. This low correlation is attributed to Al interference, since the C emission line at 193.03 nm suffers from subtle interference from Al lines. However, the intensity of the line at 193.58 nm was used for
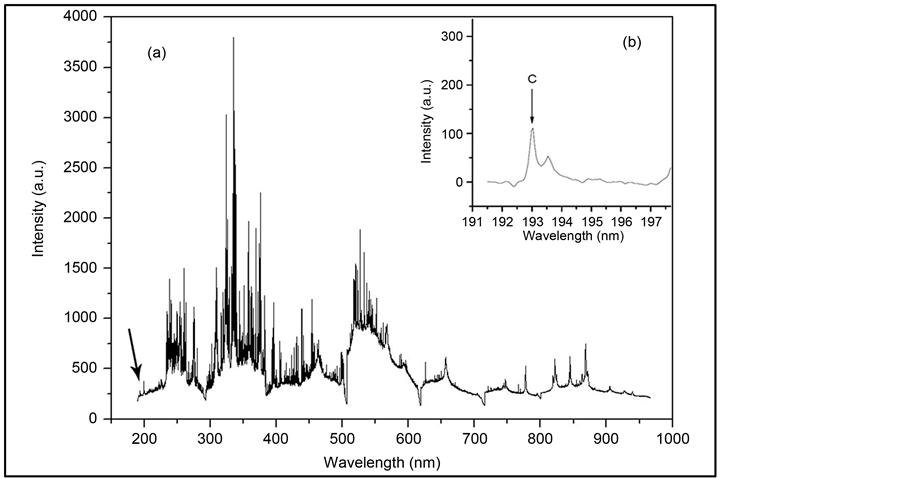
Figure 1. Emission spectrum of a Brazilian tropical soil sample, from 190 to 980 nm (a); The C and Al lines at approximately 193 nm used in this work are also shown (b).
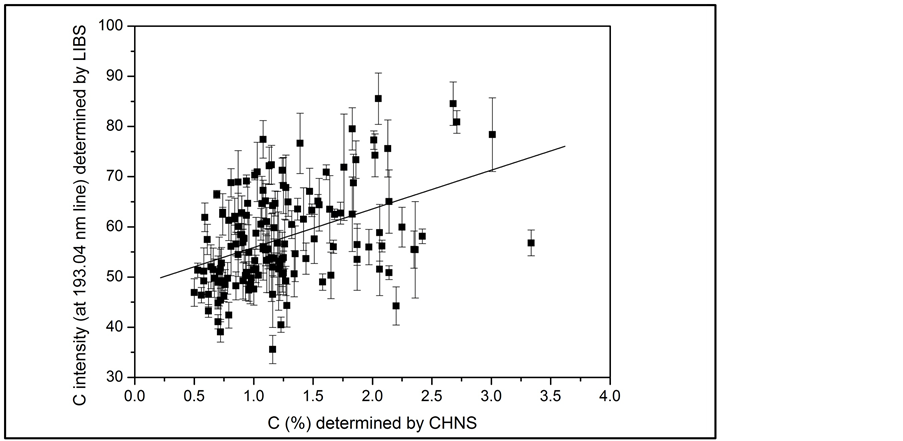
Figure 2. Lower correlation obtained between C emission intensity at 193.03 nm measured by LIBS and C (%) amount determined by CHNS from soil samples.
normalization of the intensity of the emission line of C (I) at 193.03 nm. For calibration, the ratio of the intensity values of lines 193.03 nm (a.u.)/193.58 nm (a.u.) was correlated with the C content values that were previously determined by the CHNS analyzer.
Previous papers by our group [8] [15] have shown methodologies for spectral correction, where Al interference was removed. However, in the present study we are suggesting a simpler method, with additional soil sampling, focusing on field analysis. In this context, six replicates of the same soil samples were collected at different soil management systems, from the soil surface to as deep as one meter, totaling 240 samples. Significant spatial variability, as indicated in Table 1, can be observed in the soil C contents not only from the same management system type and soil depth, but also from different replicates. Each soil management system was made up of 5 to 10 hectares, totaling an experimental area of 30 hectares. This information shows the importance of a more accurate soil sampling system, which takes into account the heterogeneity of a certain area. As shown by this experiment, pasture systems, with effective root systems and the constant presence of animals, can lead to heterogeneity in a particular area. Table 1 shows the values of soil C content determined by the CHNS analyzer at the same soil sampling depth (0 - 5 cm), but in different replicates from pasture managements. Thus, our purpose was to show the necessity of more accurate data surveys, since there is a possibility of misconception if averages are calculated from replicates. In our example shown in Table 1, the maximum difference regarding soil C content determined in different replicates for the same management treatment reached 76%. The feasibility of a technique such as LIBS, which is low cost, fast and has the potential to be portable, could help provide more relevant results in these conditions [18] .
The spectral correction in LIBS measurements is important in order to minimize matrix effects and to mitigate the Al interference [12] . Considering strong LIBS signal dependency on the sample matrix and the varied textural composition of the studied samples, individual calibration models were proposed based on soil texture. After the soil texture definition was related to different soil systems and locations, it was possible to divide the samples in two groups: fine-textured soils and medium-textured soils, to produce a calibration curve for the LIBS method (Table 2). It is important to emphasize that before textural class division, calibration was performed for all soil samples; we obtained a calibration model for all soil systems with a calibration equation (Table 2). The r2 was slightly lower than that obtained for both calibration models of soil texture. Our analytical method proposal was defined from two textural soil classes and which comprised 65% of the total number of soil samples, 62 and 85 samples, respectively, for the clay and medium soil texture models. According to Cremers et al. [6] , the effects of soil properties and clay mineralogy on the LIBS measurements can provide the information needed to establish the range of effectiveness for LIBS analyses.
Comparison of the predicted results of the validation samples with LIBS and the reference values obtained by CHNS is shown in Figure 3. The samples used to validate the models comprised the remaining 35% of the total number of soil samples. Figure 3(a) shows the validation graph for all samples, without soil class texture separation. It is important to observe that there is a correlation trend between soil C values determined by the CHNS and LIBS calibration model based on C/Al intensity lines, with r = 0.78 and a mean absolute relative error of 32%. The predictions were more accurate when LIBS models were proposed based on soil texture (Figure 3(b) and Figure 3(c)). The correlation between the reference values and the values predicted by LIBS validation were r = 0.86 for the medium-texture soils model and r = 0.93 for the fine-textured soils model. The calculated values

Table 1 . Soil C content determined by CHNS analyzer (average of two measurements) at a soil sampling depth of 0 - 5 cm, and C content difference (in percentage) calculated from different field replicates.
Table 2. Calibration equations estimated for soil data as a function of soil texture and for all soils combined. Linear determination coefficient (r2) was obtained for each calibration equation.
*p < 0.05.
 (a)
(a) (b)
(b) (c)
(c)
Figure 3. Predicted C concentration for soil samples versus C concentration measured by CHNS technique. (a) All samples; (b) Medium-textured soils; (c) Clay soils.
of mean absolute relative error related to the soil texture models were 21% for medium-textured soils and 14% for fine-textured soils. Better correlation and smaller errors were found in the fine-textured soil LIBS model, with higher concentrations of C. In addition, the LOD was 0.13% for fine-textured soils and 0.32% for mediumtextured soils.
4. Conclusions
The results indicated that LIBS quantification can be affected by the texture and chemical composition of soil. Soils rich in Fe prevent the use of the spectral line at 247.86 nm in portable systems with a spectral resolution of 0.1 nm. The C emission line at 193.03 nm is interfered with by the Al emission line, so in soils with a high Al concentration it is necessary to perform spectral correction to obtain calibration models. It was shown that portable systems with low spectral resolution associated to calibrated models (taking into account soil texture and Al line interference as proposed by this study) could be used to predict soil C content for medium-textured soils (with mean error of 21% and LOD of 0.32%) and for fine-textured soils (with mean error of 14% and LOD of 0.13%).
In conclusion, this study showed the feasibility of using LIBS, even with low resolution, for soil C quantification. This method could be useful for carbon counting, for producing survey maps and for providing precise data collection from different experimental areas or management systems. Considering the heterogeneous nature of the soil, the availability of a technique that allows the study of spatial variability of soil C stocks may greatly improve modeling studies for management systems and forecast scenarios. Thus, these results can be used as a basis for the future development of portable systems.
Acknowledgements
The authors express their gratitude for the grant from FAPESP (2010/09211-6), CNPq (560292/2010-4) CAPES, Embrapa and Pecus Research Network.
NOTES
*Corresponding author.