Al-Mseiab Qadaa Landfill Site Selection Using GIS and Multicriteria Decision Analysis ()
1. Introduction
Human activities (industrial, domestic, commercial and construction) and animals generate solid waste in different forms. Some of the waste fall out of the commercial use i.e. cannot be utilized. Parts of this waste are considered hazardous to the environment and natural resources. With continuous population growth and increase of standard of living, solid waste is increasing in tremendous amounts. This fact enforced a major problem facing the world. This problem is more serious in third world countries where 80% of the population lives [1] [2] . It is believed that about 10% of each person’s production life is lost as a result of waste related diseases [2] . This led to increasing awareness and concern of solid waste hazards [3] . Accordingly, legislations and laws developed since the mid of the twentieth century and many conferences were held in this context like UN conference in Stockholm, 1972; Earth Summit in Rio de Janeiro, 1992 [3] . It is noteworthy to mention that improper solid waste management will causes environmental pollution. Municipal Solid waste management practices vary from place to another. Open dump practices are used in Asia, Africa, South America and Europe. Recycling is relatively higher in North America and Europe; sanitary landfills are more widely used in America [3] .
To overcome this problem, proper disposal of the waste should be considered. This includes site selection criteria to select the best site for landfills and proper landfill design. In addition, the landfill should have sufficient capacity to meet the current and projected waste to be deposited within at least 5 years. Number of criteria had been proposed for landfill sitting [4] -[14] . Several techniques can be found for site selection of solid waste disposal in Halvadakis [15] ; Bonham-Carter [16] ; Ehleret, et al. [17] ; Balis, et al. [18] ; Dorhofer and Siebert [19] ; Yagoub and Buyong [20] ; Herzog [21] ; Lukasheh, et al. [22] ; Kontos, et al. [23] ; Kontos, et al. [24] ; Simşek, et al. [25] ; Şener, et al. [26] ; Banar, et al. [27] ; Gemitzi, et al. [28] ; Mutlutürk, et al. [29] ; Nas, et al. [30] .
GIS has matured into a powerful tool that can integrate driven types of spatial data and perform a variety of spatial analysis. This evolution has been driven by significant advances in computer technology and the availability and quantity of data. GISs and environmental models function with a board spectrum of geospatial data that are used for divers’ applications and spatial analyses at different scales. The examination and organization of data into a useful form produces information, which then enables appropriate analysis and modeling.
The objective of this study, is to select sites for an appropriate landfill area of Al-Mseiabqadaa in Babylon governorate by using the integration of Geographic Information Systems (GIS) and multicriteria decision analysis (MCDA), and, also to calculate the required landfill area to cover generated Municipal Solid Waste (MSW) volume for at least five years. So, using these approaches will lead to integrated environmental management, that are necessary to allow consideration for all components and processes in environment; their spatial, temporal, and human dimensions; their interaction and correlation, coupled with social, economic, political, and legal impacts.
For this purpose, 14 input digital map layers including urban centers, land use, airports, pipes, power lines, railways, roads, slope, streams, surface water, industrial areas, oil pipes, liquid gas pipes, soil types were prepared and multi criteria analysis were implemented with geographical information system.
2. Materials and Methods
2.1. Study Area
Al-Mseiabqadaa is located to the south west of Babylon governorate in Iraq (Figure 1). Its center is the city of Al-Mseiab center, with a population of about 341,037 capita. It lies approximately between latitudes 32˚34', 33˚4'N, and longitudes 43˚59', 44˚30'E longitude. The total area of the Al-Mseiabqadaa is 928 km2. The rate of population growth is 1.2%.
2.2. Methodology
The method starts with the identification of evaluation criteria needed for landfill sitting selection in AlMseiabqadaa. All these criteria had been identified based on the local guidelines such as Town and Country Planning Department (TCPD) guideline for waste disposal sitting and also guideline from the Department of Environment (DOE). Besides, the related information about landfill sitting has also been reviewed from the international practices like Environmental Protection Agency (EPA) [31] . All the data pertaining to these parameters were taken from the relevant agencies, however not all parameters were included in this study due to the lack of some data.
Integration of multicriteria criteria decision analysis GIS and (MCDA) were used and applied to Al-Mseiabqadaa. Fourteen criteria had been identified for landfill site selection. They are: urban centers, land use, air
ports, pipes, power lines, railways, roads, slope, streams, surface water, industrial areas, oil pipes, liquid gas pipes, and soil types.
ArcGIS 9.3 software was used for imaging and analysis of spatial data. Additionally, several GIS analyses such as buffer zoning, distance, reclassify and overlay analysis were used. In order to evaluate site selection criterion, MCDA was used to measure the relative importance weighting for evaluation criteria. MCDA divides the decision problems into smaller understandable parts, analyze each part separately, and then integrate the parts in a logical manner [32] .
2.3. Population Growth Rate
Population growth rate (r) was calculated based on estimates of population size of the Babylon governorate, for the period (2004-2010) that was obtained from the department of Statistics/Babylon.
P2010 = P2004 (1 + r) n n = number of years P = population.
And by using the above growth rate equation Al-Mseiabqadaa in Babylon governorate, population size was calculated for each of the years from 2011 to 2017. Growth rate for Al-Mseiab district is 1.2%.
2.4. Municipal Solid Waste Volume (MSW) for Site Area Requirement
One of the important criteria to make right decision in selection landfill site is site area requirement. For this Purposes, Municipal Solid Waste (MSW) volume to be disposed in this site should be estimated.
The linking between the populations of Al-Mseiabqadaa, for the years 2004, 2005, 2006, 2007, 2008, 2009, 2010 with the amount of solid waste generated for the same years in Al-Mseiabqadaa is through the following relationships (Figure 2):
y = 360056.34ln(x) – 4533004.67 R² = 0.83.
Using this relationship, the suspected waste to be generated for the period 2013-2017 was calculated (Table 1). It is expected that 491,920 ton (volume 1,093,156 m3) of solid waste will be generated through that period at Al-Meseibqadaa.
2.5. Criteria Analysis
The decision tree developed for the landfill site selection problem in Al-Mseiabqadaa explained in Figure 3, where 14 criteria were prepared as input digital map layers including urban centers, land use, airports, pipes, power lines, railways, roads, slope, streams, surface water, industrial areas, oil pipes, liquid gas pipes, and soil types.

Figure 2. Solid waste in the center of Babylon governorate (Al-Mseiabqadaa) with its population. (X: Population in Al = Hashimyah; Y: Solid waste (ton) for the same year)

Table 1. Solid waste in Al-Mseiabqadaa with its population.

Figure 3. The decision tree developed for the landfill site selection problem in Al-Mseiabqadaa.
2.5.1. Criteria Weights
A weight can be defined as a value assigned to an evaluation criterion which indicates its importance relative to other criteria under consideration. Assigning weights of importance to evaluation criteria accounts for 1) the changes in the range of variation for each evaluation criterion, and 2) the different degrees of importance being attached to these ranges of variation. There are four different techniques when assigning the weights: Ranking, Rating, Pairwise Comparison and Trade of Analysis Method [26] .
Calculating weight for the criteria using the method of pairwise comparison method, the weights of criteria had been computed using comparison matrix as shown in Figure 4 by using scale values of 1 - 9 as shown in Table2
The comparison matrix indicating the relative importance of the criterion in the columns compared to the criterion in the rows. For each comparison, it was decided which of the two criteria is most important, and then a score was assigned to show how much more important it is. The results are given in Table2
2.5.2. Digital Environmental Maps
It is evident that many factors must be incorporated into landfill sitting decisions, and Geographic Information Systems (GIS) is ideal for this kind of preliminary studies due to its ability to manage large volumes of spatial data
Figure 4. Comparison matrix. (*Ur: Urban centers; Lu: Land use; Ai: Airports, Pi: Pipes; Pl: Power lines; Ra: Railways; Ro: Roads; Sl: Slope; St: Streams; Sw: Surface water; In: Industrial areas; Oi: Oil pipes; Lg: Liquid gas pipes; St: Soil types.*Source [26] . λmax = 14.327, CI = 0.025, RI = 1.57 and CR = 0.016 < 0.1).
Table 2. Scale for pairwise comparison [33] .
from a variety of sources. It efficiently stores, retrieves, analyzes and displays information according to userdefined specifications [34] .
Settlement areas were subdivided into two layers. First layer consists of residential areas; second layer was for industrial areas. The reason for this division is the necessity of applying different buffer zone distances to the residential areas and industrial areas. According to Allen [35] , the distance from residential areas should be at least 5 km and from isolated houses 500 m to locate a landfill site. The buffer distances for towns and villages within a population greater than 500 people were determined as 1000 m, for all other identified centers of population as 500 m and for private residences, businesses, social and community buildings as 250 m by Cantwell [36] . Siddiqui [34] suggested that no new landfill site should be located closer than 0.4 km from a collection of ten or more houses. On the other hand, the landfill site should be located within 10 km of an urban area due to the economic considerations [37] . By considering all the suggested safe distances, minimum distances for the study area were determined as 5 km for residential areas and 250 m for industrial areas. These distances were used to create buffer zones around settlement areas and excluded from the study area. After exclusion of absolutely unsuitable areas for a landfill site, the remained areas were classified according to their suitability. The layer of industrial areas were classified as suitable or unsuitable by assigning values 1 and 0 respectively (Table 3) and map shown in Figure 5.
The layer of residential areas was divided into four classes. The classes and related ranks can be seen in Table4 The residential areas layer was then prepared based on the ranking values as shown in Figure 6.
Minimum distance from the network was imported in order to avoid visual impact and other nuisances. Roads plus 100 m around them should be applied as a buffer zone [38] . As stated by Cantwell [36] , all roads including primary, secondary, regional and third class roads should be avoided and have a buffer of at least 30 m on both sides. According to Allen et al. [39] , distance greater than 1 km from main roads and highways should be avoided. On the other hand, the landfill site should not be placed too far away from existing road networks to avoid the expensive cost of constructing connecting roads [40] . Distance from main access roads should be smaller than 3 km according to Allen et al. [41] and between 0.2 km and 10 km of a major road according to World Bank [37] . By considering these suggested values, the buffer zones and related ranks were determined for roads which are shown in Table4 The values given above were entered to the database and each value was assigned to the related class. Finally, the vector maps were converted to raster maps shown in Figure 7.
The necessary buffer zone distances and related rankings were directly used Table 4 according to World Bank [37] . The buffer zones were created, the values in Table 3 were entered to the database and each value was assigned to the related class in the GIS environment. The layer of railways was classified as suitable or unsuitable by assigning values 1 and 0 respectively. Then, the prepared vector map was converted to a raster map shown in Figure 8.

Figure 5. Classes for industrial areas. *Source for industrial areas/Babylon sewer directorate, Iraq, 2012.

Figure 6. Classes for residential areas. *Source for residential areas/Babylon sewer directorate, Iraq, 2012.

Figure 7. Classes for main roads. *Source for main roads/Babylon sewer directorate, Iraq, 2012.
There are different values related to the safe distances from airports like 3.000 m according to Chalkias [42] and 3.048 m according to Bagchi [43] . As stated by Allen, et al. (2000), distance of 10 to13 km from flight path should be considered as a buffer zone.
By considering these suggested values, the safe distance for an airport is determined as 3000 m. The layer of airport was classified as suitable or unsuitable for a landfill site by assigning values 1 and 0 respectively (Table 4) which is shown in Figure 9. To finalize the map for analysis, the vector map was converted to raster map.
The necessary buffer zone for swamp areas was determined as 250 m [44] . The layer of wetlands was classified as suitable or unsuitable by assigning values 1 and 0, respectively (Table 4). The buffer zones were created and the study area was divided into two classes in the GIS environment. Then, the vector map prepared was converted to a raster map shown in Figure 10.
Pipelines of Babylon water and Waste Water Treatment Plants are passing through the study area. The necessary buffer zone for pipeline was determined as 250 m on both sides [44] . The pipeline layer was classified as suitable or unsuitable for a landfill site by assigning values 1 and 0, respectively (Table 4). After the creation of buffer zones, the vector map was prepared and converted to a raster map shown in Figure 11.
The necessary buffer zone distance for electricity power lines according to Cantwell [36] , should be 30 m on both sides to avoid any disruption to the infrastructures and all high voltage power lines. The buffer zones were created in the GIS environment. The layer of power lines was classified as suitable or unsuitable for a landfill site by assigning values 1 and 0 respectively (Table 4). Then, the vector map was prepared and converted to a raster map shown in Figure 12.
The necessary buffer zone for stream was determined as 300 m on both sides [44] . The surface water layer was classified as suitable or unsuitable for a landfill site by assigning values 1 and 0, respectively (Table 4). After the creation of buffer zones, the vector map was prepared and converted to a raster map shown in Figure 13.
The necessary buffer zone for oil pipes was determined as 75 m on both sides. The surface layer was classified
Table 4 . Criteria, variables and the ranking used in the site selection process.
as suitable or unsuitable for a landfill site by assigning values 1 and 0, respectively (Table 4). After the creation of buffer zones, the vector map was prepared and was converted to a raster map shown in Figure 14 to be used as an input map in the analysis.
The necessary buffer zone for liquid gas pipes was determined as 300 m on both sides. The surface water layer was classified as suitable or unsuitable for a landfill site by assigning values 1 and 0, respectively (Table 4). After the creation of buffer zones, the vector map was prepared and was converted to a raster map shown in Figure 15.
According to Alsharify [45] , the texture of Babylon soil is almost silt clay loam. Table 5 shows adopted test results of texture of Babylon soil. The Soil textures and landfill suitability were classified according to Oweis and Khera [46] as shown in Table6 The comparison of Table 5 and Table 6, in additional to Figure 16, shows thatBabylon city soils and its environs are suitable for landfill construction without specific variation on its texture which should be taken in the digital maps analysis. Figure 17 is a raster map to be used as an input map in the analysis.

Figure 8. Classes for rail ways. *Source for rail road/Babylon sewer directorate, Iraq, 2012.

Figure 9. Classes for airports. *Source for airports/Babylon sewer directorate, Iraq, 2012.

Figure 10. Classes for surface water. *Source for surface water/Geology Department, Babylon University, Iraq, 2012.
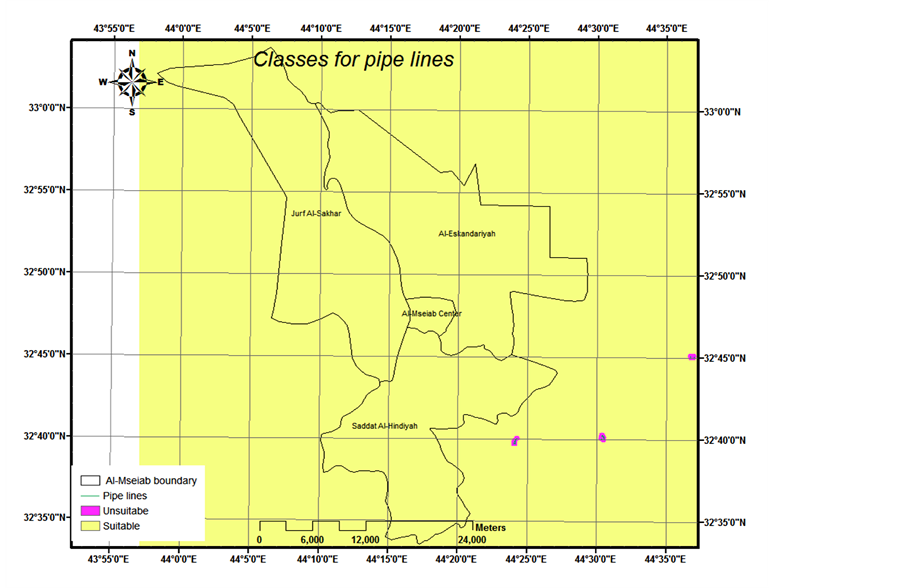
Figure 11. Classes for pipe lines. Source for pipe lines/Babylon sewer directorate, Iraq, 2012.

Figure 12. Classes for power lines. *Source for power lines/Babylon electricity directorate, Iraq, 2012.

Figure 13. Classes for streams. *Source for surface water/Geology Department, Babylon University, Iraq, 2012.

Figure 14. Classes for oil pipes. *Source for pipe lines/pipe lines company, Babylon, Iraq, 2012.

Figure 15. Classes for liquid gas pipes. *Source for pipe lines/pipe lines company, Babylon, Iraq, 2012.

Figure 16. Soil types in Babylon governorate.
Table 5. Adopted test results of texture of Babylon soil [45] .
Table 7. Land use types and their rankings.
In the study area, there are different types land uses (see Table 7 and Figure 18). Land use types were grouped and ranked according to their suitability for a landfill site as unsuitable, Moderate suitable and suitable for a landfill site by assigning values 0, 5 and 10 respectively. The land use vector map was then converted to a raster

Figure 18. Land use. *Source for land use/(Geology Department, Babylon University) (Babylon sewer directorate, Iraq, 2012.
Table 8. Classes produced for slope according to the suitability for landfill.
map (see Figure 19).
Digital Elevation Model (DEM), also referred as Digital Terrain Analysis, is a digital representation of earth’s topography in a continuous way [47] . In this study, the slope map was generated from DEM. The potential for slope failure is related to the degree or grade of the topography. Slope failure underneath or adjacent to landfills, will result in waste containment failure and release of debris into the surrounding area. Land with slopes greater than 15% should be considered unsuitable for waste disposal sites [43] . The slope layer was classified as suitable or unsuitable for a landfill site by assigning values 1 and 0, respectively (Table 8). Classes for slop map shown in Figure 20.
An output value of the resultant maps which is the final suitability map was prepared using overlay analyses of ArcGIS Spatial Analyst. Land suitability of the study area was calculated by the LSI. The calculated LSI was between 0.436 and 4.161. The very high and very low suitable areas were determined. Pixels with 0.436 (colored red) were considered as very low suitable and were excluded as candidate’s sites. On the other hand, pixels with
values around 4.161 were considered as suggested sites that are likely to be more suitable and are colored blue, see Figure 21.
3. The Suggested Site
3.1. District (Nahia) Center
Technically, the distance from the center of a collection route to the landfill should be less than 20 - 25 km [35] ; therefore, 20 km distance was adopted (to cover all zigzag roads) from centers of each district (nahia) to restrict suitable lands according to this criterion. The output map produced is given in Figure 22. The suitable land intersected with specific layers of buffer zones around district centers were selected as landfill sites. The output map produced is shown in Figure 23. This map shows the landfill site selected to cover all Al-Mseiabqadaa municipal solid wastes disposal.
3.2. Landfill Area
To achieve right decision in landfill site selection, the area should be suitable or greater than required area to assumed municipal solid wastes to be disposed. According to Tchobanoglous, et al. [13] the principle methods used for landfills in dry areas can be classified as: 1) Area, 2) Trench, and 3) Depression. The adopted method in this research was the area method which is more suitable with Babylon environs lands of shallow ground water depth ranging from 3 to 4 m. The area available for the suggested landfill is shown in Table9
Once the amount of waste generated has been estimated, landfills should be designed in cells with sufficient capacity to receive the cumulative volume of waste generated. The optimal capacity of a landfill site should be-

Figure 21. Output map produced with its suitability index.
no less than 5 years in order to ensure that the major investments required by the landfill are spread over large tonnage of waste.
The cumulative volume of wastes expected to be generated between 2013 and 2017 of selected landfill is presented in Table9 The adopted density of the waste in the landfill is 450 kg/m3. It should be noted that no account for any reduction in the waste going to the landfill through recycling or composting was considered at this stage.
Waste in the landfill should be covered daily by cover in order to minimize health, safety and environmental impacts and nuisances. The volume of daily cover in the landfill varies between 10% and 15% of the waste volume [44] . Adopting a value of 10% of the waste volume, the required capacity of the landfill over the next five years can be estimated as shown in Table 10.
Wastes are unloaded to landfill site and spread in long narrow strips on the surface of land in series of layers in depth of 50 cm. Each layer is compacted at the filling progresses during the course of the day until the thickness of the compacted wastes reaches a high of 3 m at that time, and at the end of each day operation. The cover material must be hauled in by earth moving equipment from adjacent land or from borrow bet areas. The width over which the wastes are compacted is 6 m [44] . Required area of the selected landfill is shown in Table 11. From Table 10 and Table 11, it can be recognized that the available area of selected landfill is quite more than the required area estimated for 5 years. Therefore, the right decision is taken. Table 11 shows the selected landfill with its location and coordinates in addition to required and available area.
3.3. Official and Field Visits Review
In order to check the suitability of the selected area derived from the analysis and the actual case requirement (nahia center and landfill area), official and field checks were performed out to determine the accuracy and suitability of candidate sites. The selected site was discussed with officials at the Physical Planning and Agriculture directorates in Babylon governorate, to check if the suggested area is subject to any of their new projects or conflict might arise due to ownership of the land. Archeological and religious sites were also checked with Antiquities directorate in Babylon Governorate to make sure than none of such sites falls within the area suggested. It was found that, there aren’t any conflicts with activities of these departments, and also we found that this site does not match on any existing landfill sites.
4. Conclusion
Solid waste management is a serious problem all over the world and it is becoming more serious in developing countries like Iraq due to the high population growth rate and rapid increase of the standard of living. Despite
Table 9 . Suggested landfill site and its available area.
Table 10. Cumulative and compacted waste volumes for the landfill and its required area.
the importance of this problem, there are no legislations or regulations for site selection criteria of landfills and their design. In this research, several criteria (e.g. as urban centers, land use, airports, pipes, power lines, railways, roads, slope, streams, surface water, industrial areas, oil pipes, liquid gas pipes, soil types) were used to select the proper landfill site which is friendly to the inhabitants and the environment at Al-Mseiab Qadaa within Babylon Governorate. Multicriteria Decision Analysis (MCDA) and Geographic Information System (GIS) were used to select the proper site. The selected site covers an area of 813,109 m2. The expected solid waste to be generated till 2017 was calculated and it was found that the suggested landfill can well accommodate the generated waste beyond 2017.4.
NOTES
*Corresponding author.