Identification of Preferable Distributed Generators Locations for Congestion Relief in Multi-Bus Power Network ()
1. Introduction
In the last decade, the electricity supply industry has undergone global restructuring, which has significantly changed the electric energy system scenario. Transmission congestion exists in all emerging power networks as a natural consequence of demand and capacity mismatch. Active power generation changes according to load demands and system losses. This involves the most important information with which operators grasp present active and reactive power flow in power system, representing the basis of security assessment and contingency analysis. Ng [1] presented a novel approach to solve the real-time line flow calculation Generalized Generation Distribution Factor (GGDF) sensitivity factor. The GGDF loses its accuracy in line flow solutions [2] for non-conforming load change cases. Referring to recent research, sensitivity-based approaches have been widely proposed and applied in related studies into the control and operation of power systems. In [3] , a direct method has been proposed for line overload alleviation using sensitivities of the bus injections to the overloaded lines. Transmission congestion may prevent the existence of new contracts, lead to additional outages, increase the electricity prices in some regions of the electricity markets and can threaten the system security and reliability [4] . In the literature, direct methods of line overload alleviation using generator rescheduling and load shedding are described in [5] [6] . In [7] , ANN-based preventive approaches are used for congestion management to improve the power system security and reliability in the deregulated power market scenario. In recent days, placement of new generating stations goes under the hand of private entities and under the policy of Transmission Open Access (TOA), Independent Power Producers (IPP) may also be interested to install Distributed Resources (DR’s) close to loads as competitive alternatives since DR’s can ease the risks of market price hike. Currently there are several kinds of DG’s [8] [9] , such as diesel turbines with the capacity under 1MW, gas turbines with the capacity in the range of 1 - 20 MW, micro turbines range from 30 - 200 MW, hydro generation capacity in the range of 100 kW - 1 MW. Extensive research has been conducted for Electric Power System (EPS) security control by DG’s which can also be introduced into the ancillary markets [10] [11] . From the perspective of the Independent System Operators (ISO) and Distribution Companies (DISCO), it is needed to analyze the role of DG’s in congestion management. Parida et al. [12] proposed a value-based sensitivity approach for reactive power cost allocation; in addition Jupe and Taylor [13] presented power flow sensitivity factors for the online control of power output of Distributed Generators and Zhou and Bialek [14] developed voltage and loss sensitivity factors for generation curtailment. Ayres et al. [15] proposed voltage sensitivity as a means to determine the maximum allowable penetration of Distributed Generators without violations in steady-state voltage. Regarding the placement of DG sources, in the literature there are many solutions proposed, namely using fuzzy techniques [16] [17] analytical technique [18] , heuristic optimization algorithm [19] [20] mixed integer nonlinear programming [21] , evolutionary programming (EP) optimization technique [22] , and others. In [23] , a fuzzy clustering method has been used to identify the desirable location of Distributed Generators for congestion management. In [24] , author has presented an introduction of neural network based clustering. It can be concluded that few studies have used fast line flow calculation using a sensitivity based approaches. Nevertheless, the studies mentioned above have demonstrated theoretical feasibility and practical value in the application of power systems. The use of clustering techniques for representing data, measuring the similarity between elements representative for the group, can be very suggestive and attractive. In the present work, identification of DGs desirable locations and its size for congestion management have been proposed. Power Contribution Factor and Voltage Sensitivity Index have been determined and an ANN clustering technique has been implemented to select the load buses for DG allocation with respect to overloaded lines in the system. In this paper, a new network Contribution Factors (CF), for real-time line flow calculation is proposed. Optimal value of the DG capacity can be obtained to enhance the system performance by improving voltage profiles of the various buses and reducing the system losses The method proposed in this paper has a benefit over most of the earlier works cited in this literature, in the sense that union of three factors are considered as an the input for ANN clustering; the approach could be used in the field of new expansion of the networks meeting huge customer demand and estimates desirable zones for the placement of DG by dividing whole power system into different congestion zones reducing real and reactive power losses and improving voltage profiles.
2. Proposed Methodology
DG allocation for congestion management considering their power contribution factors (CF’s) and voltage sensitivity Index will have the more impact on system from reliability point of view. The task is to quantify the CF’s of the DGs according to the most restrictive constraints of the grid that may cause congestion. This paper introduces a simple and direct approach to these challenges. In this section, the closed form contribution factors of DG’s to the line flows and system voltages are derived.
2.1. Contingency Selection
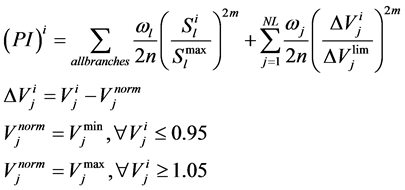
The contingencies are selected by calculating a kind of severity indices known as Performance Indices. Based on the values obtained the contingencies are ranked in a manner where the highest value of PI is ranked first. During contingency both active and reactive power flow limit affects and the bus voltages get altered, hence it is essential to predict the power flow and the bus voltages following contingency. Given this information, an Independent System Operator (ISO) can judge the relative severity on the system security and decide if the preventive actions should be initiate to mitigate congestion problem. The general performance index for a system is defined as [25] ,
 (1)
(1)
where,  Active power flow in post contingency cases in line l with ith outage,
  Maximum active power flow in line i, NL = Number of load buses and m is the integer exponent.
  is the voltage at bus j with ith outage, is
  average of
  and
and  where
where  and
and  the weighing factor of bus-j and line-l respectively that is decided by the system operator depending upon the operating condition of the system. Following a contingency, any line which is overloaded will make a contribution greater than unity. The m value is fixed at 3. These Performance Index (PI) values have been simulated for various cases by considering (N-1) contingency criteria.
2.2. Congestion Index
It is the measure of congestion of a particular line or overall system. It gives an idea about how much percentage of the line is getting overloaded to power flow. If the value of Index more, it means that more power has been transferred and the line will be more congested and vice-versa.  is the rating of the power flow of a line connecting bus i and bus j whereas
  is the actual power flow of the line. For secure operation, the transmission line congestion Index
  is restricted by upper limit as follows:
 (2)
(2)
where  and
and  are real power flow in line
 ,
,  represents voltage magnitude of nth bus and NL represents number of load buses.
2.3. Contribution Factor based DG Allocation in Electric Grid
The contribution factors denote how much active and reactive power flow over a transmission line would change due to change in real and reactive power injections from Distributed Generators. The power flow of a line k can be modeled as the sum of base case active power flow  and incremental power flow
 , that is,
 (3)
(3)
The power flow contribution of Distributed Generators (DG) to each line is computed by the following equations: As proved in the Appendix (Section A.1), the Real power contribution factor of the DG’s to real flow of line k is
 (4)
(4)
The Reactive power contribution factor of the DGs to real flow of line k is given by
 (5)
(5)
 (6)
(6)
2.4. Voltage Sensitivity
The voltage sensitivity related to active power injections has a vital role of improving the system voltage profile in the presence of Distributed Generators. The proposed method for estimating the maximum allowable power injection into each system bus based on the voltage sensitivity is validated in Appendix A. Supposing that , and
, and  non-singular, from Appendix (Section A.2) we have
 (7)
(7)
where  is a reduced Jacobian matrix, which gives the voltage magnitude variations due to active power injection variations. The matrix
  can be used directly in order to indicate which buses of the system will be more or less affected by the installation of a
  unit. Therefore the estimated voltage profile after the installation of one or a group of new generators can be analytically expressed by
 (8)
(8)
where  is the voltage profile for the base case. Equation (8) allows one to estimate the voltage profile when the generator is installed at every possible bus of the system, with unity power factor and with any specified generation level. In the following section, these sensitivities are used in the proposed method for estimating the maximum allowable power injection of Distributed Generators.
2.5. Determination of DG Size
The determination of the maximum power that a Distributed Generator (DG) can inject into a system without causing steady-state voltage violations is difficult. The maximum active power that the installed DG unit at bus i with unity power factor can export to the system without violating the voltage limits of bus n is expressed as follows:
 (9)
(9)
One DG unit can affect all the nodal voltages of the system; thus, the maximum amount of active power that can be injected at bus n will be different if the violation is considered for the different buses of the system. Consequently, the maximum capacity that can be injected at bus i is the minimum amount of power necessary to violate at least one nodal voltage of the system.
3. Clustering Approach for Transmission Congestion Management
To classify the most desirable and undesirable location of DGs in large systems, a proper and simple clustering on the basis of Contribution Factors is necessary. It is observed that the values of the CF’s are diverse according to the location and the expected DG output. Due to the uncertainty of the DG operations, it may be very desirable to determine the trend of such influences in a loading area rather than an accurate value. In the present work, the whole system has been clustered in different zones by estimating power flow contribution factors and voltage sensitivity indexes of DGs to manage the congestion in the operating area.
SOFM Architecture and Algorithm
SOFM is a simplified model of the feature called “localized region mapping” of the brain from which it derives its name. Figure 1 shows the typical architecture of SOFM. This network learns without supervision, implying that the topological relationship of the input data is not necessarily known a priori. This network architecture

Figure 1. Self-organizing neural network architecture with the output layer neurons arranged in one-dimensional.
was originally conceived by Kohonen [26] and in his approach, Kohonen proposed a fully laterally connected network with distance related feedback synapses showing inhibition and excitation features. The remarkable feature of SOFM is that it reduces dimensionality of mapping without losing important topological relationship between them. In the SOFM algorithm, first the weights between input and output are initially set to small random values and an initial neighborhood is also chosen. After that the input vectors for the network are selected, the distance of an input vector from each neuron j in the Kohonen’s layer can be calculated as:
 (10)
(10)
where,  denotes an input vector;
  denotes the weight vector of the jth neuron.
The Kohonen neuron with the minimum distance  is chosen as the winner and is presented input vector, which is given by:
 (11)
(11)
During training, the winner adjusts its weights to be closer to the values of input data while the neighbors of the winner also simultaneously adjust their weights to compete with the winner and to be closer to the same input vector according to the following weight adjustment schedule:
 (12)
(12)
The term  is a gain term that decreases in time. It may be convenient to start with the value of
  and decrease it over time to 0.1 or lower. After training, the weight vectors are self-organized and represent prototypes of the classes that pre-exist within the input vectors.
4. Result and Discussions
All the programming modules have been developed in MATLab working environment. A Pentium IV with 2 GHZ processor speed and 512 MB RAM has been used for simulation of the problem. The performance Index (PI) values are computed considering the outage of only one line sequentially. The PI values of ten most emergency lines with 70% - 80% loading are given in descending order in Table1 It can be inferred that outage of line 2 - 4 in the test system is the most vulnerable one and will result great impact on the whole system.
4.1. Identification of Most Congested Zones in the Network Using Congestion Index
The Performance Indices (PI) with highest value reflect a severe case and the system parameters go beyond their limits which results power flow congestion in the lines. The IEEE-30 bus system has 6 PV buses, 24 PQ buses and 41 lines; hence for the PI calculation a total number of 41 line contingency cases are performed. From Table 1 it can be inferred that the post contingency analysis gives the reflection of overloaded lines connected between buses (28 - 27, 25 - 27, 4 - 6, 1 - 2, 1 - 3, 15 - 23, 6 - 28, 8 - 28, 29 - 30 and 16 - 17) in which desirable operation must be claimed to relieve 1congestion by placing DG at the load buses.
4.2. Utilization of Distributed Generators for Relieving Congestion
4.2.1. Determination of DG Contribution Factors
For each loading scenario, the real and reactive power flow contribution factors associated with real and reactive power injections from DGs are computed in each line and voltage sensitivity at each bus by considering real power flow limit of transmission line as the system security constraints. It is clear from Figure 2 and Figure 3 that two most critical lines Line no. 36 (28 - 27) and Line no. 7 (4 - 6) are the suitable lines to relieve power flow congestion by connecting DG which create the diversity of such effects in heavily loaded areas. The darkened area indicates the desirable locations which will reduce the transferred real power along the critical lines having most negative Real power contribution factor of DGs (CFPDG). Line no. 36 (28 - 27) and Line no. 7 (4 - 6) have the most negative CFPDG with respect to real power injection from DGs. The lightened area represent the DGs with positive CFPDG values has least participation in mitigating congestion which means the line flows may be increased beyond the limit of rated power flow capacity with insertion of DGs which is undesirable from the system reliability point of view. The other post contingency critical lines along with some power injected buses having small real power and reactive power contribution of Distributed Generators are not so much distinct and

Table 1 . Different critical lines with critical contingency.
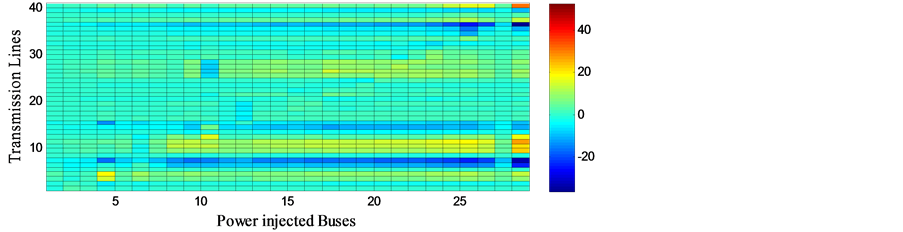
Figure 2. Active power contribution factor of DG.

Figure 3. Reactive power contribution factor of DG.
need to be analyzed by neural network based intelligence.
Similarly the darkened area in Figure 3 indicates that Line no. 7 (4 - 6) has the most negative reactive power CFQDG with respect to real power injection from DGs. For the above lines, most of DGs will even reduce the transferred power through the critical lines, which express importance of DGs to relieve congestion.
4.2.2. Identification of Desirable and Undesirable DG Location Using ANN Clustering
ANN based intelligent technique has been applied to mitigate power flow congestion by clustering approach to identify preferable DG location in the system which mainly depends upon the line flow and voltage scenario of the power system. Active and Reactive power contribution factors of Distributed Generators have been utilized for identifying the desirable location of DG to extenuate overloads in the electric grid. When the generation cannot meet the demand, voltage instability occurs and therefore there will be a large increase in the need for active power generation. When a system is heavily congested voltage sensitivity information of Distributed Generators has taken as a part of the input information in congestion management, otherwise the voltages at different buses becomes lower than a fixed or nominal value and go beyond the security margins. Determination of the number of neurons of Kohonen network should depend on the application and make the Kohonen network capable of forming sufficient clusters of input vectors. It has been found that 16 × 16 neurons in the Kohonen’s layer give the best clustering for this particular system after rigorous testing with 11 × 11, 12 × 12, 13 × 13, 14 × 14, 15 × 15, 16 × 16, 17 × 17, 18 × 18 of output layer neurons. The properties of the clusters can be identified by analyzing the weight vectors associated with the neurons in the clusters, as all neurons belonging to a cluster have “similar” features. In the present work, the properties of the clusters can be identified by analyzing the weight vectors associated with the neurons in the clusters and comparing them with the CFPDG and CFQDG values which are indicated in Table 2, Table 3 and Table 4 based on systems which are clustered as undesirable zone (Zone I), intermediate zone (Zone II) and most desirable zone (Zone III). However, the degree of desirability of DGs for relieving system congestion can be simply identified by SOFM based clustering method.
Figure 4 indicates most desirable zone for the placement of DGs to mitigate congestion and as well as improve the system voltage profiles. It can be observed that in Zone III, bus-30, bus-29, bus-27, bus-26, and bus-25 have the most negative value of real power flow and reactive power flow contribution factors and accordingly the system operator (SO) selects the most desirable zone for placing DG to manage congestion in the network. However, the degree of desirability of DGs for relieving system congestion can be simply identified by SOFM based clustering method.
4.3. Analysis of Congestion Levels before and after Connecting DGs
Our proposed method is capable of handling changes in demand across all buses as well as providing a precise reflection of the active and reactive power injection into the active power flow. At new loading point, the amount of change in the active and reactive power demands of the bus can be expressed as increments from the base load. These incremental terms must be balanced by active and reactive power generation of Distributed Generators without affecting the reference bus. It has been observed that the ISO selects the load bus no. 30 for DG
Table 2 . Zone classification by ANN based clustering for line no. 36 (bus28 - bus27).
Table 3. Zone classification by ANN based clustering for line no. 7 (bus4 - bus6).
Table 4. Zone classification by ANN based clustering for line no. 35 (bus25 - bus27).

Figure 4. Classification of different zone for placement of DG.
connection taking from desirable zone which is clustered by ANN based technique for the whole system. One DG unit can inject into the respective bus without causing superior voltage limit violation in any bus. The maximum active power of installed DG at bus 30 can inject into the system without causing voltage violations is 20 kW, since the installation of generators in these buses extremely affects the system voltage profile. The results provided by the repetitive power flow method, where a step of 1.0 kW of power injection was used to determine the maximum allowable power injection, are compared with those obtained by the analytical method. The congested lines 1 - 3, 6 - 28, 4 - 6, 3 - 4, and 2 - 6 are getting relived with significant amount of 67.8%, 65.62%, 61.54%, and 53.22% respectively and other lines are also listed in Table5
It can be observed that only ten most congested lines, in descending order of their values are shown in Table6 The Congestion Index value for heavily congested lines before and after connection of DGs in desirable locations is listed in this table. Figure 5 shows the variation of bus voltage profiles of the system with DG placement at bus no. 30. It is noticed that, for a particular loading scenario, the installation of DG improve the bus voltages due to injection of power locally.
It should be noted that the voltages at every bus after employing DG within acceptable limits. Therefore an improvement in voltage in buses related to the congested lines indicates a reasonably good and impact of distributed generation (DG) on the voltage profiles. Improvement in voltage profile also suggests an enhancement in voltage stability margin in the system.
Table 5. Percentage of loading in different congested lines.
Table 6. Index values of different lines before and after DG connection.

Figure 5. Improvement of voltage profile with insertion of DG.
5. Conclusions
Contribution Factors of Distributed Generator based on Jacobian based power flow methodologies are proposed. ANN based unsupervised technique has been presented to cluster the whole system into DG connection zone to manage congestion situation of the system. Voltage sensitivity approach is proposed to determine maximum DG size. The proposed methods are tested on IEEE 30-bus system and it reveals the following:
• This voltage sensitivity expresses the incremental changes in voltages in different buses with real power injection from DG with improvement in voltage profiles of the system.
• The suggested method is quite fast and can be applied for updating line flows and hence the cluster of zones for congestion management with help of proper placement of DG’s.
Thus the present research clearly demonstrates the role of DGs as an effective tool for relieving congestion in power networks. The proposed approach is computationally efficient and simple as it utilizes the sensitivity factors, which can be easily updated for future expansion of the system.
Appendices
A.1. Calculation of Contribution Factors (CF) of Distributed Generators to Real Power Flow of Transmission Lines
The real power flow (Pk) and reactive power flow (Qk) in a line k connected between bus-i and bus-j can be written as
 (A1.1)
 (A1.2)
Hence, the total variations of real power flow can be expressed by the following linear formula:
 (A1.3)
Consequently Equation (A1.3) can be written as
 (A1.4)
 (A1.4a)
 (A1.4b)
 and
and  respectively, termed active power contribution factor and reactive power contribution factor of DG.
Substituting Equation (6) and Equation (7) for  in Equation (5)
 (A1.5)
For practical system, it is necessary to include the changes in bus power injection which cause variations in all bus voltage magnitudes and phase angles.
 (A1.6)
 (A1.7)
The inverse Jacobian can be written as
 (A1.8)
 (A1.9)
 (A1.10)
 (A1.11)
 (A1.12)
 (A1.13)
 (A1.14)
A.2. Voltage Sensitivity
Supposing that , and
, and  non-singular,
 (A2.1)
NOTES
*Corresponding author.