Using Artificial Neural Network to Predict Body Weights of Rabbits ()
1. Introduction
Traditional statistical prediction and classification methods (such as linear regression, logistic regression, principal component analysis, discriminant analysis, k-nearest neighbor classification, etc.) have a number of limitations (such as the assumptions upon which they are based [1] ) and results from them are often not the best possible. Artificial neural networks (ANNs), on the other hand, adapt to changes in non-restricted manners and are based on much fewer assumptions. ANNs provide a single tool for solving many problems in which traditionally statistical methods can or cannot provide acceptable solutions for. ANNs have been applied to a huge amount of fields in the past years [2] . However, the number of the use of ANNs is still few in animal science (and a number of other fields). This limited use of ANN in animal science is paradoxical as data analyses are often done in this field despite that a few studies [3] , etc. have shown ANNs to be more powerful than most traditional statistical prediction methods. Unlike traditional statistical methods, ANNs attempt to solve problems through explicit learning [4] [5] . This often makes it more computationally intensive. However, its strengths transcend this mild limitation and we were excited by the results we obtained from using ANN models in this study.
2. Materials and Methods
2.1. Study Location and Experimental Animals
We used 144 F1 eight-week-old rabbits (74 New Zealand White purebred and 70 New Zealand White × California rabbits, crossbred in rabbit unit of National Animal Production Research Institute (NAPRI), Shika, Kaduna State, Nigeria) in this study. The animals were intensively managed under air conditioned building to minimize heat stress. They were fed a pelletized diet in the mornings and green grasses such as guinea grass (Panicum maximum) were given in the evenings.
2.2. Body Parts Measured
Body weight was taken by digital weighing scale (Mettler Toledo, Top Pan Sensitive Balance, J. Liang Int. Ltd. UK). The measurements were taken while the animals were held in a standing position. Three biometric traits were determined using a tape measure on each animal. The anatomical reference points were in accordance with standard zoometrical procedures [6] . The body components measured were:
Body length (BL): Diagonal distance from the points of shoulder to points of hip or first thoracic vertebrae to base of tail or to hip bone. This is also described as the distance between the most cranial palpable spinosus process of the thoracic vertebrae and either sciatic tubers or distance between the tops of the pelvic bone.
Heart girth (HG): This refers to the body circumference and was measured just behind the fore-legs.
Height at withers (HW): This was taken using a graduated measuring stick.
All biometric traits were measured in centimetres.
2.3. Forecasting/Prediction Model
We implemented a three-layer ANN with backpropagation in Python programming language (Figure 1). The input layer had five nodes—Breed, Sex, HG, BL, and HW; and the output layer had one node—body weight, while the hidden layer was made to contain five nodes (for simplicity and easy training of the model). We did not include age in the model since the animals were of the same age (8 weeks).
The entire dataset was randomly divided into two subset viz, the training set (consisting of 75 percent of the entire dataset) and testing subset (comprising of 25 percent of the entire dataset). The network was tested in 1 and 2 hidden layers with 3 to 25 neurons in each hidden layer. Initial weights and bias matrix were randomly initialized between −1 to 1. A nonlinear transformation (or activation) function tangent sigmoid (Equation (1)) were used to compute the output from summation of weighted inputs of neurons in each hidden layer. A pure linear transformation functions were used as output layer for getting network response.

where, x is weighted sum of inputs and α = constant

Figure 1. Neural network showing input nodes (breed, sex, HG, BL, and HW) at the input layer, hidden nodes at the hidden layer, and output node (body weight) at the output layer.
To have a fine training of the artificial neural network model, we set the learning rate to as low as 0.005 and the momentum factor to as low as 0.001. We first ran 10 thousand iterations of training, using the obtained model (i.e. the neural network weights) for predicting the body weights, and saved the results. For the sake of comparison, we fitted a multivariate linear regression (MLR) model (and made sure the model passed various model diagnoses such as normal distribution of regression residuals shown in Figure 1) after we confirmed that the model is statistically significant at p < 0.0001 (see Table 1). We then compared the results from the artificial neural network with that of the fitted multivariate linear regression model. The results were encouraging. Therefore, we went further to run one million iterations of training to further improve the ANN’s weights. R2 was determined using the following stated formula:

Qexp = Observed value.
Qcal = Predicted value.
N = Number of observation.
3. Result and Discussions
We show the summary statistics of the observed weights and the predicted weights at ten thousand, and at one million training iterations of the ANN in Table1 Exact figures (un-summarized statistics) are presented in Table 2 in the supplementary material. Correlation (Pearson correlation) between the observed weights and the predicted weights at ten thousand, and at one million training iterations of the ANN are shown in Table 2; and correlation between the predicted weights at ten thousand, and the predicted weights at one million training iterations of the ANN are shown in Table3
Notably, our implemented artificial neural network (ANN) and the results are encouraging as it outperforms multivariate linear regression (MLR). The coefficient of determination (R2) from each of our ANN models’ results (0.679 for ten thousand iterations, Figure 2; and 0.71 from one million iterations, Figure 3) is much better than that from MLR (0.659, Table 2). The correlation between the observed and actual weights for ten thousand and one million iteration were positive and highly significant with both showing a similar value (r = 0.842), and correlation (r = 0.969, R2 = 0.939) between ten thousand and one million iteration further make obvious that even the ANN model obtained from 10,000 iterations is also quite good in its performances. See Table 2 and Table 3, and Figure 4. The prediction accuracy was validated using the test data sets. The ANN models gave higher R2-values than the multivariate linear regression indicating that the ANN model prediction was able to describe more variation in body weight of rabbits in comparison to the multivariate linear regression. The estimates of correlation between the observed and predicted weights for iterated values (ten thousand and one million) were positive and highly significant (p < 0.001). Estimates obtained in this study correlate better (i.e. have higher prediction values) than those obtained in a similar study in India [7] .
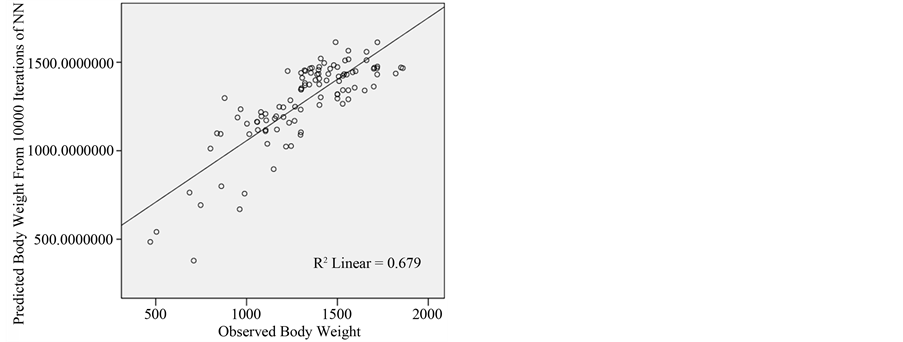
Figure 2. ANN satisfactorily (R2= 0.679) predicted the observed weight after ten thousand training iterations.

Figure 3. This figure shows how well the ANN predicted the observed weight after one million training iterations. Note that the R2(0.71) shows an improvement over ten thousand training iterations (shown in Figure 2).

Figure 4. Relationship between the predictions from one million training iterations and the predictions from ten thousand training iterations. The high R2(0.939) suggests that ANN’s results are highly consistent and should be reliable.

Table 1. Summary statistics of the observed weights and the predicted weights at ten thousand, and at one million training iterations of the ANN.
Table 2. Comparison of ANN (at ten thousand, and at one million training iterations) and MLR of the observed weights and predicted weights.
***p < 0.001.
Table 3. Pearson correlation between the predicted weights at ten thousand, and the predicted weights at one million training iterations of the ANN.
***p < 0.001.
4. Conclusion
Overall, our artificial neural network (even with just ten thousand iterations) considerably outperforms a multivariate linear regression model (Table 2). Hence, we conclude that ANN is more robust and could be used in predicting the bodyweights of animals more accurately than MLR.
NOTES
*Corresponding authors.