Water-Level Fluctuations of Urmia Lake: Relationship with the Long-Term Changes of Meteorological Variables (Solutions for Water-Crisis Management in Urmia Lake Basin) ()
1. Introduction
Urmia Lake is a hyper-saline lake in northwestern Iran near Iran’s border with Turkey. The lake is between the Iranian provinces of East Azerbaijan and West Azerbaijan. It is the largest lake in the Middle East and the third largest saline lake on earth [1] , with a surface area of approximately 5200 km2 (2000 mile2), 140 km (87 mi) length, 55 km (34 mi) width, and 16 m (52 ft) depth Especially during the recent years Urmia Lake extremely has been shrunk and its water-level has illustrated negative trends, as these conditions damaged considerably the ecosystems, environment and socio-economic activities of the local communities, within and around this lake [2] . Periodic changes in climatic and hydrologic variables that cause wide climate changes as well as droughts worldwide and in Iran seem to have a crucial impact in water crisis of Urmia Lake (Figure 1 and Figure 2).


Figure 1. Monthly values of temperature anomaly (top) and precipitation amount (bottom) in northwest of Iran during 1980-2010 (source; NOAA1). Note: increase of temperature and decrease of precipitation through 2000-2010.

Figure 2. Satellite images of Urmia Lake in 1989 (right), 2001 (center) and 2011 (left): these images obviously show the negative trend of water-level and gradually shrinking of the lake through 22 years (source: U.S. Geological Survey).
Some researchers have illustrated this fact that the water-level of Urmia Lake consistently have been changing through historical periods, although there is not any agreement between the researchers about the trend and intensity of these changes. As an example, Jabbarlu-Shabestary in 2000 [3] through a research has found that in 5 - 10 thousand years ago water-level of the lake fell down more than the current position. The results derived from a paleoclimatic investigation on the lake bed by Ali mohammadi et al., 2011 [4] indicated that the lake had never been dried through 23 - 40 thousand years ago, whereas all investigations and data series confirm seasonal and periodic fluctuations in the lake’s water-level.
Figure 3 shows the yearly changes of the lake’s water-level in a 45-year period (1966-2010). From 1998 extremely water-level of Urmia Lake has been decreased below its long-term normal level (1275.35 m).
Maximum depth of the lake measured about 16 m, and it’s water-level is based on the mean sea level (MSL) varies between 1272 m - 1278 m [5] .
If the height of 1274.1 m for Urmia Lake’s water-level considered the crisis threshold, the surface area of the lake should be about 5700 km2 [6] , whereas, currently the lake is shrunk up to a surface almost 3000 km2 [7] .
Satellite images analysis in order to derive the shore line’s changing illustrated a wide range of seasonal/periodic variations in the surface of the lake during the recent decade. Maximum changes happened because of decreasing the lake’s water-level up to 3.5 m from normal, and then resulted in basic shifts over shore lines in particularly on the southeastern and eastern coasts. Appearance of such significant water-level fluctuations caused the shrinking of Urmia Lake up to 23%, so the environmental feedbacks of these critical conditions threat seriously the valuable ecosystems of the lake [8] .
Different investigations indicate relative dependency between ecological status of lakes and climatologic changes. As an example, Kebede, S., et al. in 2006 [9] found around 20% changes in climatologic variables over Tana Lake basin through a 50-year period, although water-level of the lake has been remained stable. In the case of Aral Lake the climate effect is estimated about 14% versus 86% of man-made impact on water-level variations [10] [11] . The studies by Lofgren et al. (2002) [12] , through a hydrological modeling suite using input data from the CGCM1(The first version of the Canadian Global Coupled Model) predict large drops in lake levels, up to a maximum of 1.38 m on Lakes Michigan and Huron by 2090.
A developed research by Tabari and Ghalehni, 2012 [13] , on water-need of Urmia lake shows an extreme increasing trend in water-need of this lake due to recent droughts. It is notable that the water influx to Urmia Lake in the recent years decreased considerably up to 77%, so this critical condition of the lake doesn’t seem to happen only by climatic effects, regarding the fact that the wide constructive operations and developmental projects are in performance over the Urmia Lake basin.
2. Study Area
Urmia Lake, located in northwestern of Iran in a geographic position between 45˚E - 46˚E and 37˚4'N - 38˚17'N, is an oligotrophic lake of thalassohaline origin with a total surface area between 4750 and 6100 km2 and a maximum depth of 16 m at an altitude of 1250 m [14] -[16] (Figure 4).

Figure 3. Water-level fluctuations of Urmia Lake during 1966-2010 (based on height from mean sea level, in meter).

Figure 4. Geographic position of Urmia Lake in northwest of Iran.
The total catchment area of the lake is about 51,876 Km2 which is 3.15% of that of the entire country, and includes 7% of the total surface water in Iran. There are thirteen main rivers in the lake basin, among them Zarrineh rood, the largest with a total annual discharge value of about 2 × 10⁹ m3 [17] [18] . Climate in the Urmia Lake basin is harsh and continental, affected mainly by the mountains surrounding the lake [17] [19] . Considerable seasonal fluctuations in air temperature occur in this semi arid climate with an annual average precipitation of between 200 and 300 mm [20] . The air temperature usually ranges between 0˚C and −20˚C in winter and up to 40˚C in summer. From this point of view, Urmia Lake is a critical asset for the region, because it acts to moderate these extremes [21] . Annual inflow into the lake is 6900 × 106 m3, of which 4900 × 106 m3 is from rivers, 500 × 106 m3 from flood water (through rainfall) and 1500 × 106 m3 from precipitation [22] . Underground springs are also a source of water, but the volume is not known [23] .
3. Material and Methods
Firstly, all synoptic stations on the Urmia Lake basin and surrounding areas, have been taken in consideration, then we selected four stations, which provide long-term data series (50-year data availability) and fully cover the basin, including Tabriz in east, Saghez in south, Urmia and Khoy respectively in west and northwest of the basin (Table 1). The meteorological variables including precipitation, temperature and evaporation through the aforementioned stations have been provided. Precipitation and temperature monthly data series were available over 1961 to 2010, but for evaporation data series; the longest available period covers only from 1990 to 2010.
The water-level monthly data series of Urmia Lake also during a 45-year period from 1966 to 2010 have been obtained through the regional water resource administration of West Azerbaijan province.
In the next step, a data bank in SPSS and Excel software has been designed. We refined all data series and then arranged them in monthly and yearly scales.
In order to find the amount and severity of yearly and monthly changes in the variables and setting those in a comparable frame, all data series have been standardized via the relation below:
1) Standardizing equation:

where: x = the variables, µ = a long-term average, σ = standard deviation.
2) Average:

where: N = number of the variables.
3) Standard deviation:

Then, trend test and standard deviation analysis have been applied, also to compare the periodic changes of all data series we applied T test. Additionally, Correlation and linear regression analysis have been used to estimate the compatibility between all hydro-meteorological variables.
4. Results
1) Trend test and standard deviation analysis:
To estimate the severity of long term changes of all variables, firstly in each four selected stations the Trend analysis to the data series during a long period has been applied. All four stations illustrated rising trends for temperature and decreasing trends for the precipitation, whereas Tabriz synoptic station in the eastern part of basin shows more extreme trends than the 3 further stations of the study area. As in Tabriz station the decreasing trend of precipitation is estimated about −69, along with the growing trends of temperature and evaporation respectively +0.92 and +0.8. The standard deviation analysis in all selected stations confirms the existence of high temporal variability for precipitation comparing to temperature. The Percent of normal of standard deviations, confirms more harsh fluctuations for precipitation, which could potentially imply the effective role of precipitation’s departure from normal in happening of severe droughts over the study area. Urmia Lake’s water-level also indicates a falling trend around −0.76, with a standard deviation of 30%.
Basically, based on the outputs of the trend test and standard deviation analysis, climatic dryness over the basin has been expanded, so these conditions could influence water inflow to the lake as well as water level of the lake through direct evaporation (Table 2).

Table 1. Position of the selected stations on the study area (Urmia basin).
Table 2. The results derived through trend and standard deviation analyzes in four selected stations on Urmia Lake basin.
2) Monthly and yearly changes of the hydro-meteorological variables:
Monthly trend analysis on all variables indicates some notable results, as monthly decreasing trends of precipitation along with rising trends of temperature and evaporation are evident for majority of months; the water-level of Urmia Lake in all months of year shows persistent negative trends. The severity of precipitation-fall and rising of temperature as well as evaporation over Jan to Jun is considered more than what is found for Jul to Dec, on the contrary, decreasing trend of water-level over Jul to Dec shows more severity (Figure 5). Thus we did not find a seasonal correspondence between meteorological indicators over the basin and water-level variations of the Lake.
Yearly standardized values of precipitation, temperature and water-level of Urmia Lake through 1966 to 2010, illustrate a more fluctuant behavior for the meteorological factors (temperature and precipitation) than the water-level. From 1995 water-level indicates a steady decreasing trend, as through 1998-2010 it goes extremely below normal. Also, from 1995 to 2010 temperature is raised above normal and precipitation shows a decreasing behavior, so their peak is found over 1996 to 2002, although their intensities are significantly weak by comparing to the falling rate of water-level of Urmia Lake, and both of those (temperature and precipitation) vary almost around normal especially through 2002 to 2010 (Figure 6).
Regarding the results, it is notable that the water-level of Lake in particular from 1998 to 2010 through all months of year has been slumped harshly and unnaturally, while precipitation and temperature released comparatively more different and poor changes.
3) Comparison of periodic changes in precipitation, temperature and water-level of Urmia Lake:
In order to understand the rate and modality of periodic changes of the variables a T test analysis has been applied, as the entire study period is divided into three spells for comparing them. About precipitation, by comparing the mean value of the recent 16-year spell (1994 to 2009) to the first one (1961 to 1976) we found precipitation declines on the basin around 76 mm, so precipitation’s mean value on the basin from 336 mm in 1961-1976, decreased to 273 mm in 1977-1993 and 260 mm in 1994-2009 (Table 3). Temperature also shows a significant increasing trend on the basin, as in total we have found around 1.39˚C grow in temperature’s mean by comparing the recent 16-year period (1994 to 2009) to 1961-1976. Mean value of temperature in 1961-1976 was 12˚C that is reached 12.45˚C in 1977-1993 and 13.39˚C in the recent spell of 1994-2009 (Table 4).
The standard deviations and standard mean errors of precipitation and temperature data series during the 3 mentioned spells gradually are declining along with the variations of mean values, and illustrating the persistency and extremity of the dryness on the basin especially over the recent 16-year spell, by low positive and negative fluctuations parallel to a falling behavior of precipitation and an increasing behavior of temperature (Table 3 and Table 4).
T test analysis on water-level of Urmia Lake released a decrease around 2 m through 1996 to 2010 comparing to the previous spell (1981-1995). The water-level of Urmia Lake based on the mean sea level, through 1966 to 1980 averagely was around 1275.7 m, and then it is increased to 1276.14 m in 1981-1995, whiles it is decreased extremely to 1274.17 m in 1996-2010. Although standard deviations and standard mean errors significantly indicated a rising trends which could imply the persistent slumping of the lake’s water level through 1996 to 2010, as the water level of the lake from 1278 m in 1996 reached 1271.5 m in 2010 (Table 5).
4) Correlation and liner regression analyze between water-level of Urmia Lake with temperature and precipitation data series:
To find the relationship between the changes of meteorological variables and the water-level fluctuations of Urmia Lake during a long period (1966 to 2010), we applied the Spearman (nonparametric) and the Pearson (parametric) correlation analyzes. Both correlation methods (Spearman and Pearson) released a significant relationship for a combination of water-level (3-year moving average) and temperature by a correlation rank about −0.5, whiles the combination of precipitation and water-level shows poor correlation ranks (in max 0.18) (Table 6). Regression analysis also confirmed significant relationship for 3-year accumulated water-level values and temperature, with a R2 rank of 0.22 (Table 7 and Figure 7). Thus these results may imply a more significant periodic impact of temperature to water-level variations of the lake comparing to precipitation.
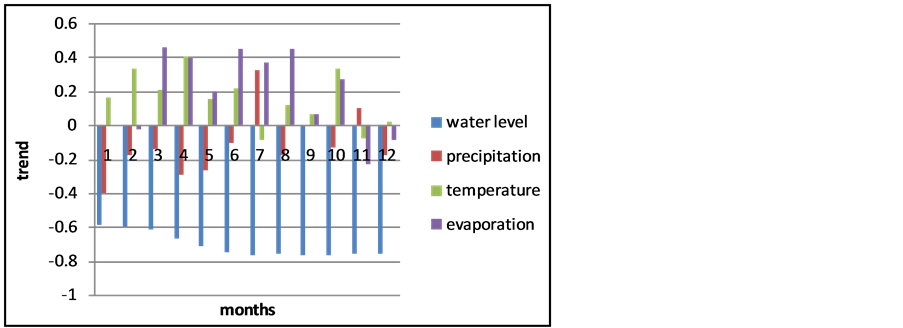
Figure 5. Monthly trend analysis on precipitation, temperature, evaporation and water-level during a long-term period.

Figure 6. Comparing the yearly changes of precipitation, temperature and waterlevel of Urmia Lake during 1966 to 2010.
Table 3. The results derived through T test on precipitation data series of the watershed in three 16-year spells (through 1961 to 2009).
Table 4. The results derived through T test on temperature data series of the watershed in three 16-year spells (through 1961 to 2009).
Table 5. The results derived through T test on water-level data series of the watershed in three 15-year spells (through 1966 to 2009).
Table 6. Pearson correlation (top) and spearman correlation (bottom) between water-level with temperature and precipitation.
**Correlation is significant at the 0.01 level (2-tailed).
Table 7. Out puts obtained through linear regression analysis between water-level of Urmia Lake and the variables.
 (a) (b) (c)
Figure 7. Linear regression analysis between water-level and temperature (a); water-level 3-year moving average and temperature (b); water-level 3-year moving average and precipitation (c).
Precipitation in general through its produced runoff on the basin, feeds the lake, whiles the runoff extremely has been reserved and controlled by dams and irrigation channels especially through 15 recent years on the Urmia Lake basin. On the contrary, increase of temperature could directly and indirectly affects the water-level of the Lake by raising evaporation as well as water-use rate in agricultural and urban affairs, etc.
Existence of the man-made factors on the basin [Annex] that intensify the water crisis of Urmia Lake could result in a poor consistency between water-level fluctuations of the lake and the changes of meteorological variables (although temperature seems to be more correlated to the water-level, nonetheless the ranks estimated remain always poor). As the low linear correlation estimated ranks don’t imply application possibility of prediction scenarios for the lake’s water-level behavior based on the precipitation and temperature of the basin.
5. Conclusions
During the recent years, water crisis of Urmia Lake is intensified, as from 1998 to the present the water-level of the lake has been slumped persistently below its long term average (1275.35 m). These conditions extremely damaged its valuable ecosystems as well as socio-economic activities of the surrounding areas. Through this investigation, we have found that the meteorological variables on the Urmia Lake basin during 1995 to 2010 show a different behavior, as precipitation’s mean value is decreased around 76 mm (from 336 mm to 260 mm), on the other hand the temperature’s mean value increased 1.4˚C (from 12˚C to 13.4˚C) compared to the previous periods. Nonetheless, reduction of the water-level of the lake, whether in monthly or yearly scales was more harsh and different than the changes of precipitation and temperature.
Correlation and regression analysis also indicated more significant compatibility between periodic changes of the water-level of Urmia Lake and temperature than the precipitation on its basin. This is because of 1) more chaotic and complicated behavior of the precipitation; and 2) runoff produced by precipitation on the basin extremely is reserved beyond the dams, and disorderly feeds the lake. On the contrary, temperature with a more regular seasonal cycle could significantly affect the water-level of Lake by evaporation and raising the water-use rate on the basin.
The unnatural shrinking of Urmia Lake especially through the recent decade could imply existence of some anthropogenic factors such as: extraordinarily reserving the runoff and construction of dams on the rivers of the basin, over-developing of agriculture and industries on the upstream areas, hyper exploitation of groundwater via deep wells, population growth followed by increase of water use on the basin, construction of a causeway through Urmia Lake that disturbed the normal water cycles of the Lake, etc. [Annex], which could be considered the supplementary causes in recent water crisis of the Lake.
To cope with the current water crisis of Urmia Lake, there could be some management/mitigation plans related to the constructional and natural systems of the basin. One of the imaginable urgent plans in this case, is the finding of the effective synoptic systems with relating to heavy precipitation over the basin in order to recommend the best time for cloud seeding operations, and then extracting the double water perceptible over the basin.
NOTES
*Corresponding author.

1National Oceanography and Atmospheric Administration.