Recent Study of Anomaly of Global Annual Geopotential Height and Global Warming ()
1. Introduction
The extreme weather phenomena had been recorded over the globe and became more frequent through the last decades. The stability conditions like as, blocking systems, fluctuations in precipitation and temperature, strong and extreme frequency of hurricanes, heat waves, droughts, flash floods, extreme weather events and global warming through the year. It has been long recognized that there are certain anomalous weather patterns that persist on time scales longer than typical synoptic-scale variability. These events, which include blocking, teleconnection patterns, and other realizations of persistent flow anomalies are associated with significant and important changes in the extratropical general circulation and related weather sequences e.g., [1] -[12] . However, the global geopotential height at level 500 hpa is a dominant parameter in controlling weather and climatic conditions over the globe. There are several literature discussing the distribution of the geopotential height [6] [13] -[24] . Global warming is the rise in the average temperature of Earth’s atmosphere and oceans since the late 19th century and its projected continuation [25] . The North Atlantic Oscillation (NAO) is one of the major modes of variability of the Northern Hemisphere atmosphere. It is particularly important in winter, when it exerts a strong control on the climate of the Northern Hemisphere. It is also the season that exhibits the strongest interdecadal variability. NAO is associated with changes in the system of westerly winds across the North Atlantic onto Europe [26] [27] . The Southern Oscillation Index (SOI) is coupled with El-Nino which is called ENSO. A strong signal of climate variability in the tropics is derived from El-Nino [28] [29] . El-Nino can have severe consequences for the living conditions on earth, [30] and recently [31] . Many studies have shown that ENSO has a significant influence on climate in many parts of the globe e.g., [32] [33] . The present work, particularly aims to study on the relationship between the global annual of 500 hpa geopotential anomaly and global warming through the period (1950-2011).
2. Data and Methodology
2.1. Data
The NCEP/NCAR Reanalysis data on monthly mean of geopotential height at level 500 hpa over the globe (90˚N - 90˚S, −180˚W - 180˚E) for the period (1950-2011) from the Web site http://www.cdc.noaa.gov/ has been used through the present study [34] . Furthermore, the corresponding monthly mean values of global mean surface air temperature (GMSAT) obtained from NASA. Monthly data of climatic indices, NAO, SOI, and El-Nino3.4 have been obtained from the Climate Prediction Centre.
2.2. Methodology
2.2.1. Anomalies Methodology
The anomaly in the annual mean value of meteorological elements, e.g., geopotential height, is (A´) for each grid point over the globe through the period of study (1950-2011) through the present work. This anomaly is calculated as the difference of the mean annual of geopotential height (A) and its climatic mean value (Ǡ) for each grid point. Whereas, the climatic mean values of geopotential height have been taken through the period (1981-2010). However, the climatic mean through the period (1981-2010) is the recent 30 years mean which includes the period of climatic changes [35] . In the same manner annual anomaly in the values of GMSAT, NAO, SOI and El-Nino3.4 was calculated.
2.2.2. Linear Correlation Method
For a linear correlation analysis of the GMSAT, NAO, SOI, and El-Nino3.4 datasets and the mean of geopotential height at 500 hpa level over the globe the methodology of Monte Carlo has been used [36] . Monte Carlo methods are a broad class of computational algorithms that rely on repeated random sampling to obtain numerical results; typically one runs simulations many times over in order to obtain the distribution of an unknown probabilistic entity. These methods are especially useful for simulating phenomena with significant uncertainty in inputs and systems with a large number of coupled degrees of freedom. Based on this methodology a correlation of +/− 0.3 would be significant. These significance levels are local for a resolution of 144 × 73 grid points. One would assume at least 0.05 × (144 × 73) = 526 grids would be significant by chance at the one-sided 95% level (At website http://www.cdc.noaa.gov/Correlation/significance.html).
In addition to that the linear correlation method according to [37] has been used. However, the term correlation coefficient (r) is a measure of the linear correlation between two variables. When a change in the value of one item involves a change in another item, the values of the two items cannot combine in every random way. If the relationship between the two items is strictly proportionate, then the correlation is said to be perfect. If the proportion is direct r is +1, if the proportion is inverse r is −1. If there is no correlation r is 0. However, the Spiegel method of linear correlation is the common method in statistics. However, there are several scenarios of models for global warming and its impacts in the future, unfortunately it has an uncertainty factor [38] [39] .
2.2.3. Local Significance and Calculation of Correlation Patterns
For a given monthly resolved means of meteorological elements e.g., geopotential height at 500 hpa level time series at each grid point is correlated with GMSAT and climatic indices NAO, SOI, and El-Nino3.4 time series. Each grid point correlation is t-tested for local significance using [40] allowing for temporal autocorrelation according to Monti Carlo method. For field significance, the areal extent of locally significant correlations in a correlation map must exceed the areal extent that can be expected by chance. To estimate the correlation, we use the Monte Carlo methodology. The field-significance statistic is the area-weighted average absolute correlation of a given correlation maps (considering only the locally significant correlations). The field-significance threshold is the 95th percentile of a 1000-member Monte-Carlo population [36] . This method is used for data array correlation till now in NOAA and recently in scientific literatures e.g., [12] [13] and [40] .
3. Results
3.1. Study of the Global Annual Geopotential Height Anomaly at 500 hpa Level through the Period (1950-2011)
In the present work NCEP/NCAR Reanalysis data on monthly mean of geopotential height at level 500 hpa over the globe (90˚N - 90˚S, −180˚W - 180˚E) for the period (1950-2011) have been used to study the global annual varies in Geopotential height. Anomaly method and time series trend analysis is used for this study. The variability study revealed that the global geopotential height varies from year to year dramatically; almost of the years before 1997, whereas, the geopotential height values are less than normal values. However, the normal is taken for the period (1981-2010). It is noticed that after the year 2000 the geopotential height varies more than its normal values till 2011. The maximum positive anomaly of global geopotential height is (+14 m) existed in the year 2010. Meanwhile, the minimum negative anomaly is (–14 m) in the year 1993. The linear trend analysis shows that there exists a positive trend of global geopotential height. The trend values became more than its normal values from the year 1995 till 2011 (as shown in Figure 1).
3.2. Study of Global Annual Mean Surface Air Temperature Anomaly through the Period (1950-2011)
Through this section NASA monthly data of global mean surface air temperature through the period (1950-2011) has been studied and analyzed using of time series analysis of the anomaly of global mean surface temperature. In addition to that linear trend analysis has been used too. The results revealed that the global mean surface temperature anomaly varies from year to year with notable increase. The surface air temperature was less than its normal value from year 1950 till 1997 except year of 1990. After year 2000 the temperature increases sharply
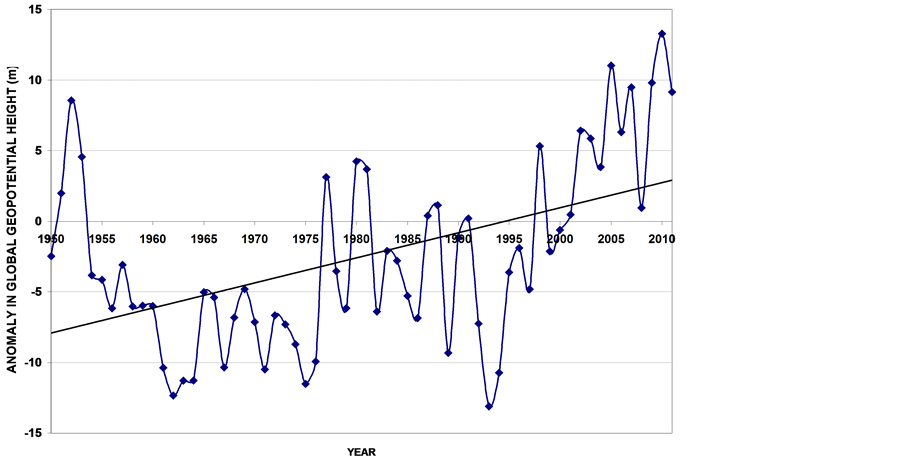
Figure 1. Time series and trend analysis of anomaly in global annual geopotential height at 500 hpa level through the period (1950-2011).
than its normal values to year of 2011.The temperature varies with a positive trend and it is clear that the trend values became more than its normal value after the year of 1995 till 2011 (see Figure 2).
3.3. The Climatic Indices NAO, SOI and El-Nino3.4 Annual Variability through the Period (1950-2011)
From time series and linear trend analysis of data of the NAO, SOI and El-Nnino3.4 anomaly through the period (1950-2011) it is found that:
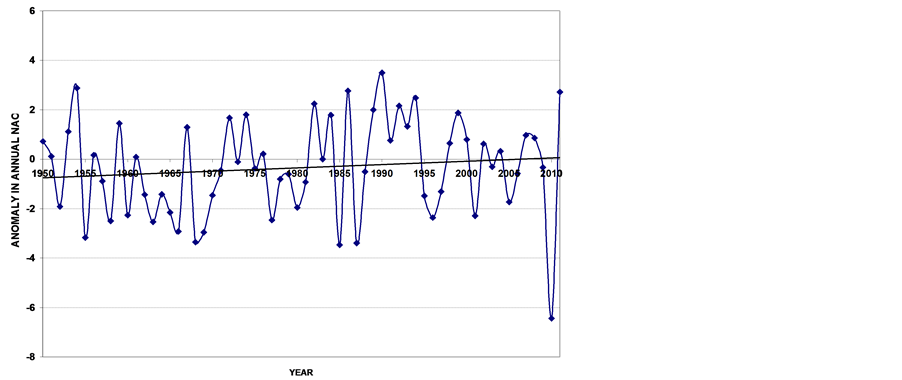
1) For NAO, it is noticed that, its values oscillate from year to year round the normal value. However, the maximum anomaly is (+2.8) on the year of 1990 meanwhile the minimum negative value is (−6.6) on the year of 2010. It has a slightly positive trend toward its normal value direction (as shown in Figure 3(a)).
2) For SOI, it is clear that, the annual SOI oscillates from year to year, more than its normal value in general. There is maximum anomaly of (+2.8) on the year of 1950. Meanwhile, the minimum negative value is (−1.8) for the year of 1987. However, it has a negative trend toward its normal value direction, although the trend values are more than the normal (as clear in Figure 3(b)).
3) For El-Nino3.4, it is obvious that, the annual El-Nino3.4 varies from year to year less than the normal values in general. There is maximum anomaly of (+1.2˚C) on the year of 1987. Meanwhile the minimum negative value is (−1.4˚C) on the year of 1955. It has a positive trend toward its normal value direction, although the trend values are less than the normal (as illustrated by Figure 3(c)).
3.4. Correlation between the Anomaly of Global Annual Geopotential Height at 500 hpa Level and GMSAT, NAO, SOI and El-Nino3.4
Correlation coefficient analysis between annual 500 hpa geopotential height anomaly over the globe and GMSAT, NAO, SOI and El-Nino3.4 of the period (1950-2011) has been studied and analyzed. The results revealed that:
1) There is an outstanding very strong significant positive correlation coefficient (+0.8) between the geopotential height and mean surface air temperature over the tropical region (30˚N - 30˚S). In addition to that the entire northern hemisphere has a significant positive correlation. Meanwhile the higher latitudes and polar region in the southern hemisphere (60˚S - 90˚S) had a significant negative correlation (−0.4) (as shown in Figure 4(a)). The linear correlation coefficient analysis shows that there exists a high significant positive correlation (+0.82) between global 500 hpa geopotential height and global warming (global mean surface air temperature, Table 1).
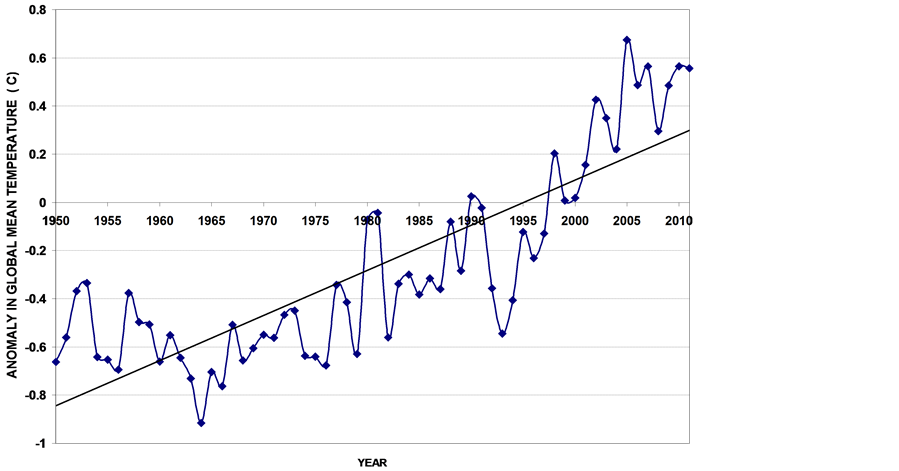
Figure 2. Time series and trend analysis of anomaly in global annual mean surface air temperature through the period (1950-2011).
 (a)
(a)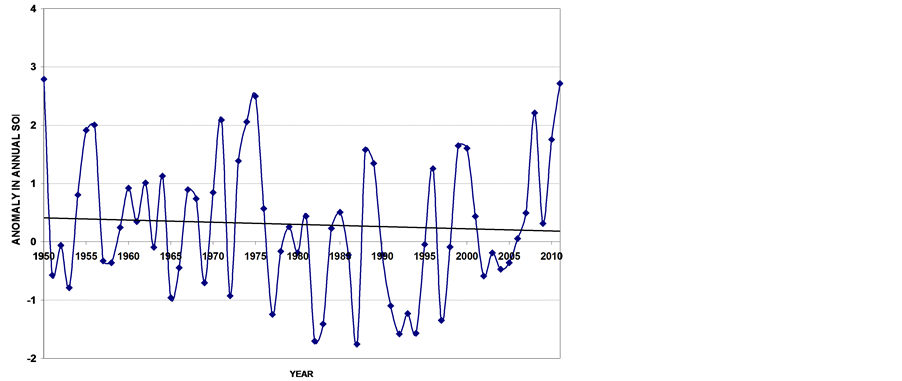 (b)
(b)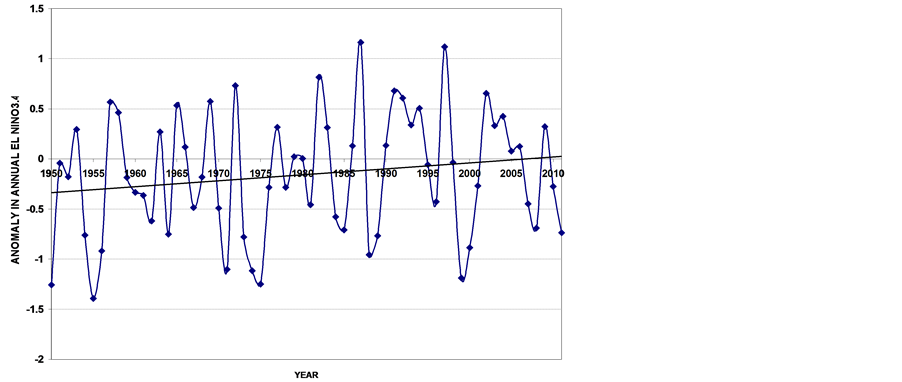 (c)
(c)
Figure 3. Time series analysis of the anomaly and trend of annual values through the period (1950-2011); (a) For NAO; (b) For SOI; (c) For El-Nino3.4.

Table 1. The linear correlation coefficients between annual global geopotential height anomaly at 500 hpa level and global mean surface temperature (GMSAT) and climatic indices NAO, SOI, El-Nino3.4 through the period (1950-2011).
*Very highly significant correlation with significant level more than 99%.
2) There is a significant negative correlation coefficient (−0.4) over the polar region in the northern hemisphere between the geopotential height and NAO. Over northern Atlantic region had an outstanding positive correlation (+0.7). However, almost of the oceans over the globe have a little significant negative correlation. In general, the correlation is more significant in the northern hemisphere rather than the southern hemisphere, as illustrated in Figure 4(b). The linear correlation coefficient analysis revealed that there exists a weak negative correlation (−0.15) between global 500 hpa geopotential height and global warming (global mean surface air temperature, Table 1).
3) Tropical region has a high significant negative correlation coefficient reached to (−0.7) over central of Indian and Pacific oceans between the geopotential height and SOI. In Contradicting to that, northern and southern Pacific Ocean had (+0.7). Almost of the continent in the globe of the earth has a significant negative correlation except Eastern Europe, as illustrated in Figure 4(c). The linear correlation coefficient analysis revealed a weak negative correlation (−0.04) between global 500 hpa geopotential height and SOI, Table1
4) Tropical region has a strong high significant positive correlation coefficient particularly over the Indian Ocean and tropical pacific and reached to (+0.7). Almost of high latitudes and polar region in the southern hemisphere has a significant negative correlation (−0.5). North and South Pacific Ocean has significant negative correlation. Meanwhile, west of North America has a strong positive correlation (+0.6). As illustrated from Figure 4(d). The linear correlation coefficient analysis revealed a weak positive correlation (+0.15) between global 500 hpa geopotential height and El Nino3.4, Table1
4. Discussion and Conclusions
Through the present work, the relationship between the anomaly of global annual 500 hpa geopotential and GAMST, NAO, SOI, and El-Nino3.4 has been studied. From above analysis and results, it became clear that the annual global geopotential height anomaly varies from year to year dramatically almost of the years before 1997. It has revealed that after the year 2000, the geopotential height has a positive value till 2011, whereas, the maximum positive anomaly of global geopotential height existed in the year 2010. However, there exists a positive trend of the annual global geopotential height anomaly and its values became more than its normal values for the year 1995 till 2011. This result ensures that the annual global geopotential height anomaly has been impacted by abnormal weather and climatic conditions in the atmosphere though the period from 1995 to 2011. Analysis of monthly data of GAMST anomaly revealed that it varied and increased from year to year with the notable positive trend. The trend values became more than its normal value after the year of 1995 till 2011. After year 2000 the temperature increases sharply than its normal values to the year of 2011. This result is completely matched with the variability of the annual global geopotential height anomaly. This result is worth being mentioned with physical processes in the atmosphere, whereas, temperature is directly a proportion to the pressure (geopotential height in the upper atmosphere).
Correlation coefficient analysis in annual between the 500 hpa geopotential height over the globe and global mean surface air temperature (GMSAT), NAO, SOI and El-Nino3.4 in the period (1950-2011) has been studied and analyzed. The results of the present study appear strong and very high significant correlation coefficient (+0.82) was found between global annual 500 hpa geopotential anomaly and global annual mean surface temperature. There is a weak correlation between annual global geopotential height and climatic indices. Meanwhile, this correlation is significant for distinct regions over the globe through the study period. In addition to that, from above results it becomes clear that:
1) There is an outstanding strong significant positive correlation coefficient (+0.8) between the geopotential height and mean surface air temperature over the tropical region (30˚N - 30˚S). Meanwhile the higher latitudes and polar region in the southern hemisphere (60˚S - 90˚S) had a significant negative correlation (−0.4), as shown in Figure 4(a). The linear correlation coefficient analysis shows that there exists a high significant positive correlation (+0.82) between global 500 hpa geopotential height and global warming (global mean surface air temperature).
2) There is a significant negative correlation coefficient (−0.4) over the polar region in the northern hemisphere between the geopotential height and NAO. In addition to that, the northern Atlantic region has an outstanding positive correlation (+0.7), as shown in Figure 4(b). In general, the correlation is more significant in the northern hemisphere rather than the southern hemisphere.
3) The linear correlation coefficient analysis revealed that there exists a weak negative correlation (−0.15) between global 500 hpa geopotential height and global warming.
4) Tropical region has a high significant negative correlation coefficient that reached to (−0.7) over central of Indian and Pacific oceans between the geopotential height and SOI. In contradicting to that, the northern and southern Pacific Ocean had (+0.7). Almost of the continent in the globe of the earth has a significant negative correlation except Eastern Europe, as shown in Figure 4(c). The linear correlation coefficient analysis revealed a weak negative correlation (−0.04) between global 500 hpa geopotential height and SOI.
5) Tropical region has a strong high significant positive correlation coefficient that reached to (+0.7) particularly over the Indian Ocean and tropical pacific. Almost of high latitudes and polar region in the southern hemisphere has a significant negative correlation (−0.5). North and South Pacific Ocean has a significant negative correlation. Meanwhile, west of North America has a strong positive correlation (+0.6), as shown in Figure 4(d). The linear correlation coefficient analysis revealed a weak positive correlation (+0.15) between global 500 hpa geopotential height and El-Nino3.4.
However, it became clear that the variability of global annual geopotential height is impacted by global warming and climatic indices mainly through the last three decades. It appears that, strong and very high significant correlation coefficient (+0.82) was found particularly between anoamly of global annual 500 hpa geopotential and global annual mean surface temperature. It is obvious that, the correlation between the geopotential height anomaly and climatic indices varies from region to region over the earth globe. Although the variability of global geopotential height has not significant correlation with climatic indices, it has a regional impacts. In fact, global warming is a complex phenomenon, and its full-scale impacts are hard to predict far in advance. Natural variability and global warming almost certainly played a role in last decade’s extreme heat and drought. Global warming is already causing damage in many parts of the globe of the earth. The impacts of global warming are not limited to a specific region. Extreme heat waves caused several thousand deaths in Europe in 2003 and 2010 [11] [41] . One can conclude that the global warming causes extremely increasing anomaly of global annual geopotential height. So that the stability conditions over the globe was changed through the last three decades and extreme weather phenomena existed.
Acknowledgements
It is a pleasure for the authors to thank the Earth System Research Laboratory, Physical Sciences Division, Climate Diagnostics Centre, for supporting the data used throughout this study. The authors also, thank the Climate Prediction Centre for supporting the NAO, SOI, and El-Nino3.4 data.
NOTES
*Corresponding author.