Does the Nature of Chief Complaint, Gender, or Age Affect Time to Be Seen in the Emergency Room ()
1. Introduction
It is possible that physicians have an inherent bias against patients with nonspecific complaints or those requiring more extensive work-ups. This may result in these patients being seen less quickly than patients whose symptoms are more straightforward, despite equally assigned triage scores or the possibility of an increased severity of illness [1] [2] . We examined the metric “time to be seen” to identify if there was an objective measurement of this bias and if there was a possible explanation for the bias. The goal of our study was to do a retrospective analysis of five years of data to ascertain which patients, if any, were seen quicker in the ED based on their chief complaints. We examined wait times, defined as the interval between arrival and first physician contact, for adult patients in a busy urban emergency room. Our hypothesis is that there is a statistically significant difference in time to be seen between the chief complaints.
2. Methods
2.1. Study Design
This study is a single center retrospective review of medical records at a major urban teaching hospital in New York. The medical center’s IRB approved the study via expedited review in April 2011.
2.2. Study Setting and Population
The inclusion criteria was any adult seen in the ED assigned an Emergency Severity Index (ESI) of 3 from 2005 thru 2010. Exclusion criteria included adults with an ESI of 1, 2, 4, 5 as these patients were typically seen in different areas of the emergency room, with different staffing patterns. Patients assigned ESI’s of 1 and 2 are seen in the more acute area of the emergency department where they are attended to more quickly and at times immediately, thus they were excluded from the study. Patients assigned an ESI of 4 or 5 were treated as fast track patients and were seen in their own designated area covered by a single physician’s assistant. These patients were also excluded.
2.3. Measurements
A report was generated from the Emergency Medicine electronic medical record system for all adult patients (18 and over) who visited the Emergency Department from January 1, 2005 thru December 2010 at Maimonides Medical Center and had an Emergency Severity Index (ESI) of 3. The 18 most common chief complaints included (in alphabetical order): abdominal pain, alcohol intoxication, back pain, chest pain, cough, difficulty in breathing, dizziness, fall, fever, flank pain, headache, infection, pain (not otherwise specified), psych evaluation, “sent by MD”, vaginal bleeding, vomiting, weakness. We measured the time in minutes from the initiation of triage until the time to be claimed by a practitioner. The practitioner was either a physician’s assistant, resident, or attending physician. To assess for the possibility that some chief complaints may be more prone to present at different times of the day where there is less or more practitioner coverage, we did an arrival distribution curve which analyzed the distribution of patients at each hour of the day.
2.4. Data Analysis
The data were exported to SPSS for analyses. Statistical analyses involved comparing the chief complaints and assessing if there was a statistical difference between median wait times to be claimed by a practitioner from time of triage in the electronic medical record. Non-parametric independent sample tests were used to assess a difference between the various chief complaints and median time to be seen by a practitioner. Further analysis involved comparing differences in wait time between males and females regarding the same chief complaint. If there was a statistically significant difference in time to be seen between genders, this was then further stratified into two age groups in order to assess for a difference in times to be seen for women of child bearing age and those who were not. These groups were divided into ages 18 - 50 and age greater than 50. Additionally, the Chisquare test was used to compare percentage of patients in the ED per each hour of the day. Statistical significance was set at p-value <0.05.
3. Results
We obtained data from 116,194 patient records for the 18 most common chief complaints from the years 2005- 2010. We found that patients with a chief complaint of weakness (n = 3628) and dizziness (n = 5577) waited the longest with a median time of 35 minutes, patients with vaginal bleeding (n = 4843) waited a median time of 34 minutes, patients with back pain (n = 3776), chest pain (n = 4994), and diff in breathing (n = 3098) waited a median time of 33 minutes, patients with abdominal pain (n = 30,384), patients with pain not otherwise specified (n = 11,262), vomiting (n = 4220), and headache (n = 4258) waited a median time of 32 minutes, patients who were “sent by MD” (n = 7491), infection (n = 4038), and fall (n = 7126) waited a median time of 31 minutes, patients with cough (n = 2252) waited a median time of 30 minutes, patients with fever (n = 4626) waited a median time of 29 minutes, patients here for psych evaluation (n = 4421) waited a median time of 28 minutes, patients with alcohol intoxication (n = 6155) waited a median time of 26 patients, and finally patients with flank pain (n = 3944) waited the shortest with a median time of 24 minutes, This data is presented in Figure 1.
Overall, male patients (n = 47,685) waited approximately 30 minutes and female patients (n = 68,509) waited 32 minutes. The difference was statistically significant (p < 0.0001) (See Figure 2).
When each complaint was stratified by gender, we found the following results: females with abdominal pain (n = 20,143) had a median wait time of 33 minutes whereas males with abdominal pain (n = 10,241) had a median wait time of 29 minutes and this was statistically significant (p < 0.0001). Females with chest pain (n = 2569) had a median wait time of 34 minutes whereas males with chest pain (n = 2554) had a median wait time of 31 minutes and this was statistically significant (p < 0.0001). Females with flank pain (n = 1856) had a median wait time of 27 minutes whereas males with flank pain (n = 2088) had a median wait time of 22 minutes and this was statistically significant (p < 0.0001). Females with weakness (n = 2099) had a median wait time of 36 minutes whereas males with weakness (n = 1529) had a median wait time of 33 minutes and this was statistically significant (p < 0.037) (See Figure 3).
Finally, when further stratifying the statistically significant chief complaints by age group, we found that younger, child bearing females between the ages of 18 - 50 (n = 14,502) presenting with abdominal pain waited
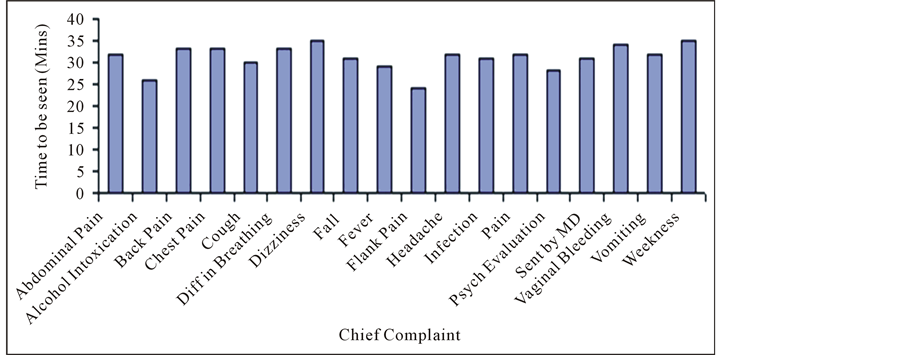
Figure 1. Median time to be seen by chief complaint.
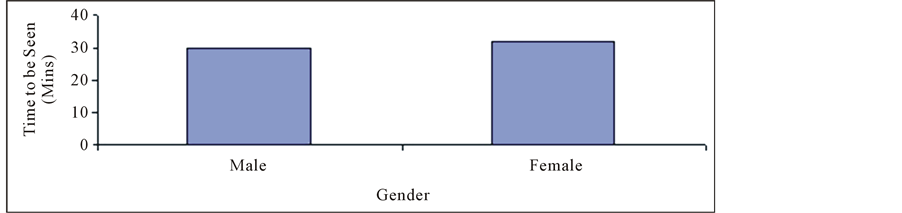
Figure 2. Median wait time for adult patients.
33 minutes whereas younger males between the age of 18 - 50 (n = 6644) waited approximately 28 minutes and this is statistically significantly (p < 0.0001). Older females over the age of 50 (n = 5641) presenting with abdominal pain waited 33 minutes to be seen whereas their male counterparts (n = 3697) waited 31 minutes and this was statistically significant (p < 0.018). Females between the ages of 18 - 50 (n = 1609) presenting with chest pain waited 33 minutes whereas younger males between the age of 18 - 50 (n = 1.746) waited approximately 29 minutes and this is statistically significantly (p < 0.013). Older females over the age of 50 (n = 960) presenting with chest pain waited 37 minutes to be seen whereas their male counterparts (n = 679) waited 35 minutes and this was not statistically significant (p < 0.381). Females between the ages of 18 - 50 (n = 1282) presenting with flank pain waited 27.50 minutes whereas younger males between the age of 18 - 50 (n = 1311) waited approximately 21 minutes and this difference is statistically significantly (p < 0.0001). Older females over the age of 50 (n = 574) presenting with flank pain waited 25 minutes to be seen whereas their male counterparts (n = 777) waited 24 minutes and this was not statistically significant (p < 0.367). Females between the ages of 18 - 50 (n = 670) presenting with weakness waited 36 minutes whereas younger males between the age of 18 - 50 (n = 457 waited approximately 35 minutes and this difference is not statistically significantly (p < 0.906). Older females over the age of 50 (n = 1429) presenting with weakness waited 37 minutes to be seen whereas their male counterparts (n = 1072) waited 33 minutes and this was statistically significant (p < 0.014) (See Figure 4).
An arrival distribution curve was done for each statistically significant complaint stratified by gender which showed equal trends in arrival times throughout the day. This did not demonstrate a difference in diurnal distribution of arrival times for patients with each of the particular complaints (See Figure 5).
4. Discussion
Given these findings, we found a difference does exist in time to be seen based on chief complaint. Given the type of complaints which waited longer, there may be a bias towards seeing patients who may have a narrower differential and have more straightforward complaints. For example, in our study we found that young males with flank pain waited an average of 21 minutes which was the least amount of time for any of the most common complaints. The most likely diagnosis in these patients is renal stones and the given work up for these patients typically involves minimally invasive testing which include a urine test, and a non-contrast CT. We hypothesize that young females with similar complaints wait longer as their workup involves ruling out a more broad differential diagnosis that includes ovarian and pelvic pathology and hence a more invasive and comprehensive physical exam. It is interesting to note that elder males do wait longer than younger males with flank pain even though there are more life-threatening diagnoses to consider such as a ruptured aortic aneurysm [3] . We also noted that patients with the chief complaint of dizziness and weakness, which are often vague complaints that are difficult to qualify, were noted to wait the longest in our study overall. We hypothesize that this

Figure 4. Median time to be seen by age.
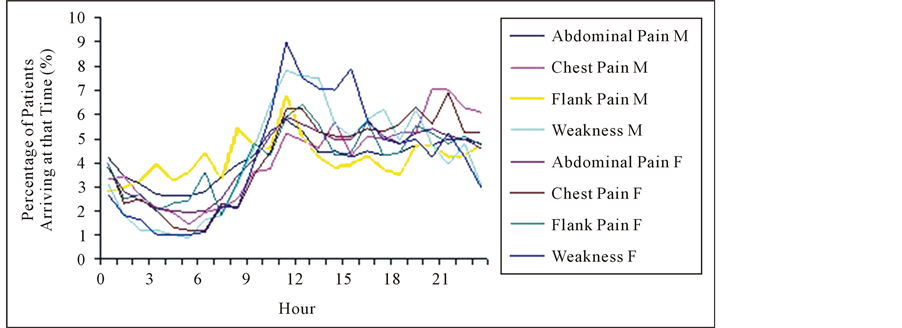
Figure 5. Arrival time distribution curve.
longer wait is due to the fact that the differential diagnosis is much broader and the work up is more challenging as there are many etiologies of weakness or dizziness.
5. Limitations
We recognize that the time to be claimed by the practitioner in our electronic medical record does not necessarily accurately reflect the time the patient is actually seen by the practitioner as often times multiple patients may be claimed at the same time. That said, the time the patient is claimed does represent the time at which a provider is willing to commit to seeing a patient. This may actually be a more direct measure of bias as this time represents intent rather than the more practical considerations which may keep a provider from the patient’s bedside.
The differences in time to be claimed for these patients are statistically significant, but in some cases are only a few minutes apart and could be considered to be clinically inconsequential. A patient in acute pain, however, may argue that a few minutes of additional time is very important [4] . Also, while the time differences are relatively short, there was a consistent bias toward a delay in the care of women across the entire group of presentations. Were these differences due purely to chance, there would likely have been more instances where men waited longer.
While ESI has been extensively studied, we recognize that any triage designation may be relatively subjective in its application [5] [6] . Thus, a patient’s initial triage may not in fact actually represent the severity of their condition and how soon they should be seen [7] .
Lastly, there may be a bias toward complaints like flank pain because practitioners can respond to acute pain quickly by administering medications in a short time frame. Patients with vaginal bleeding may have a potentially more life threatening condition than flank pain however we hypothesize the work up is more extensive and hence these patients wait longer.
6. Conclusion
There is a statistically significant difference in time to be seen based on chief complaint. There are additionally significant time differences when stratified by gender and age group with patients presenting with abdominal pain, chest pain, flank pain, and dizziness. Given these findings, we can recognize the “undertreated” complaints which might benefit from efforts to improve their care. Younger males, who are seemingly healthy and thus easier to disposition, seem to be seen faster than patients who have more life threatening differentials. This lends us to two conclusions. First, triage systems should perhaps take age and gender further into account for different chief complaints when triaging. Regarding patients that present with more broader and vague chief complaints such as dizziness and weakness, we recommend a more detailed triage initially to help narrow down the differential, more accurately assess for probable resource use and possibly decrease wait times. Second, emergency physicians and emergency medicine training programs should be aware of this potential gender and complexity bias. Efforts should be made to educate emergency physicians on the delays and potential quality issues associated with this bias in an attempt to move toward a more egalitarian approach to patient selection.