Probabilistic Prediction for Earthquake in Bangladesh: Just How Big Does the Earthquake Have to Be Next Years? ()
1. Introduction
On March, 2011, an earthquake struck the town of Fokoshima, Japan. The earthquake lasted only few seconds, but many people were killed [1] . This example shows how deadly earthquakes are. Earthquakes have killed 2.7 million people during period from 1900 to 1976 [2] . In recent time, more people are killed by earthquakes than those by any other form of weather hazard. Bangladesh is one of the largest deltas of the world situated at the south Asia confluence with the Bay of Bengal. Tectonically, Bangladesh has been affected by earthquake disasters since ancient times [3] . Earthquake which occurred in 1918 about 5.0 o’clock (local time) is shown to have the town of Srimongal, Shylet, Bangladesh. This earthquake lasted nearly one minute and damaged particularly all the brick buildings and injured many people [4] . An earthquake is tedious because they strike without warning. If better methods could be found to predict earthquakes, people could be given advance warning of an earthquake, and lives could be saved.
An earthquake is the result of a sudden release of energy in the Earth’s crust that creates seismic waves. The seismicity or seismic activity of an area refers to the frequency, type and size of earthquakes experienced over a period of time. Earthquakes are measured by Richter magnitude (ML) scale and moment magnitude (MW) scale. Earthquakes are classified by the depth at which they occur. There are two types of earthquakes: shallow and deep. Shallow earthquakes, which compose the majority of earthquakes, occur at depths down to 300 kilometers. Deep earthquakes occur at depths from 300 to 680 kilometers. Shallow earthquakes produce more damage. In addition, the mechanism that produces shallow earthquakes is known, while the mechanism that produces deep earthquakes is not fully understood. The information in this study refers only to shallow earthquakes, because they are more common, more destructive, and better understood.
Statistical analysis is an essential part of the scientific method, and it is especially important in earthquake prediction because public safety, public funds, and public belief are involved. A number of candidate statistical distributions have been proposed for computation of conditional probabilistic of future earthquakes, including the Laplace or double exponential (Utsu [5] ), Gamma (Utsu [6] ), Lognormal (Nishenko and Buland [7] ), and Weibul (Hagiwara [8] ; Rikitak [9] ) distributions. Veysel Yilmaz et al. [10] obtained a reasonably good fit to a Weibull distribution for earthquake data. In this paper, the earthquake data which occurred in the area coordinated 23˚ - 26˚ North latitudes and 89˚ - 91˚ East longitudes between 1918-2007 years and whose magnitude equals 7 or higher were used. The last earthquake (ML ≥ 7.0) occurred on the Bangladesh region is the Tsunami due to earthquake (Cox’s Bazar) of 12 September, 2007 [11] .
The purpose of this paper is to review earthquake zones in Bangladesh, and methods of predicting earthquakes. The statistical analysis of earthquakes has been discussed here of predicting earthquakes in Bangladesh. In order to demonstrate the statistical analysis, a case study will be reviewed: region in Bangladesh. An earthquake prediction states the probability of occurrence, time span, region, and magnitude range of the earthquake.
This work is divided into three main sections. In Section 2, we discussed the earthquake zones in Bangladesh according to seismic zones. An understanding of this section will help to understand how we could be used to predict an earthquake for particular regions in Bangladesh. The statistical analysis of earthquakes instructs in Section 3. Finally we specify discussion in Section 4.
2. Earthquake Zone in Bangladesh
According to geology and tectonics of Bangladesh and neighborhood five tectonics blocks can be identified which have been active in producing damaging earthquakes. These are 1) Bogra fault Zone 2) Tripura falt zone 3) Assam fault zone 4) Shillong plateau and 5) Sub Dauki fault zone [3] .
The maximum magnitudes of earthquake that can be produced in different tectonic blocks are given in Table 1, Bolt [12] [13] , and different magnitude level of earthquake zone in Bangladesh given in Figure 1.
The Largest Earthquake in Bangladesh
Bangladesh and north-eastern India states are seismically very active and earthquake risks are increasingly seen as a major problem. During 1918-2007, twelve earthquakes with magnitude M ≥ 7 have affected parts of Bangladesh out of which two had their epicenters inside Bangladesh given in Figure 2. No major event occurred during the last decades, but seismicity is still high. The pictorial and tabular behaviors of this entire earthquake are exhibited in Figure 2 and Table 2.
3. Statistical Analysis of Earthquake
Many methods for earthquake prediction have been suggested and some of these methods may be reliable. Statistical analysis is one of interesting method for predicting earthquake. Statistical analysis is when you look at the history of earthquakes in a given region and see if there is a recurrent or cyclical pattern of the earthquakes. If earthquakes in a given region have a recurrent pattern, then a long-term prediction can be made based on the recurrent pattern, see in Figure 3. In order to illustrate the statistical analysis, we consider one case study will be reviewed as Bangladesh.
There were twenty nine earthquakes (ML 6 and above) strong enough to damage houses during 1918 to 2007.

Table 1. ML level in different tectonic block.

Figure 1. Different magnitude levels of Earthquake zones in Bangladesh (Source: Banglapedia).
Three of them (ML 8.5 and above) were powerful enough to cause serious devastation. Even though it may be hard to gauge the extent of damage caused by the earthquakes, the following list is reliable 1918, 1923, 1927, 1930, 1932, 1933, 1934 (severe), 1935, 1936, 1938, 1940, 1941, 1943, 1954, 1955, 1956, 1957, 1958, 1959, 1964, 1970, 1975, 1980, 1993, 1994, 1995, 1997 (severe), 2004, 2007 (severe). Using statistical analysis of earthquake, the average interval among these twenty nine earthquakes is 3.179 years. However the time between 2007 and the last previous earthquake were 3 years. After doing statistical calculation, which assumes the random recurrences of earthquakes and we found that by 2007, there was a 62% probability of an earthquake that could damage structure. If only three severe earthquakes are considered, the average interval is 24.33 years. But by 2007, 10 years had elapsed since the last severe earthquake, the one in 1997.

Figure 2. Earthquake magnitude M ≥ 7 in Bangladesh.
Table 2. Major earthquake in Bangladesh the last 100 years including date, magnitude, and epicenter.
Again according to Vevsel Yilmaz et al. [10] , in modeling earthquake data the most appropriate distribution was established as Weibull distribution. Henceforth, to determine earthquakes risk we also consider Weibull distribution. Let us consider T is a random variables defined as years elapsed between two earthquakes occurred successively on different areas in Bangladesh. The probability density function of T random variable is seen, in detail [14] [15]
 (1)
(1)
and the cumulative distribution and the reliability function are
 (2)
(2)
 (3)
(3)
and the mean of the two parameter Weibull distribution is .
.
Equations (2), (3), α and β are fitting parameters of the distribution. Yilmuz [16] fits this distribution to finding out ML estimation on earthquake data. The cumulative distribution function of the Weibull distribution indicates the recurrence time f(t) and the reliability function expressed a more useful function of the probability that the earthquake times can be exceeds any given times. Parameter estimation values and means occurrence period found by using Maximum Likelihood Estimation technique are given in Table 3.
Putting these values in Equation (1) we get
 (4)
(4)
and earthquake data are well modeled by Weibull distribution in Equation (4). The mean occurrence period of earthquakes in Bangladesh which have magnitude equal to 6 or above is calculated approximately 2.95 years. So it is expected to have another earthquake having magnitude equal to 6 or above in Bangladesh is average 2.95 years later than the preceding one. Cumulative distribution function graph that shows occurrence risk of an earthquake having magnitude equal to 6 or more in t years after an earthquake occurred in region of Bangladesh with magnitude equal to or above 6 is given in Figure 4. The probability of having another earthquake with magnitude 6 or above in 7 years later (i.e. 2014) in the investigation area after the preceding one with the same magnitude is 92%.
The graph of reliability function that gives the probability of having another earthquake with magnitude 6 or above in t years after the preceding one with the same magnitude in Bangladesh is given in Figure 5.
4. Discussion
An unbiased statistical method of an earthquake prediction must involve adequate information that incorporates well known feature of earthquake occurrence. Statistical methods are useful for characterizing seismic hazard
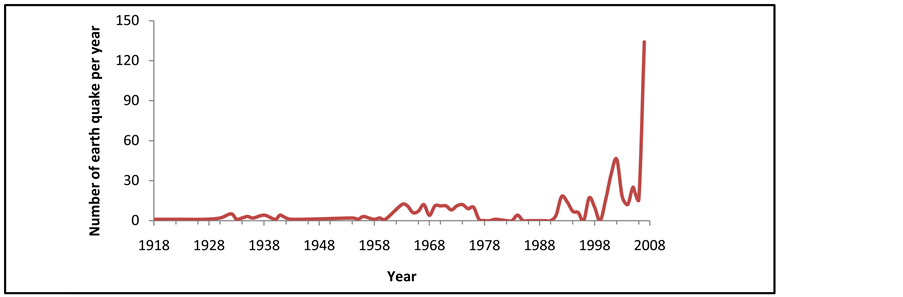
Figure 3. Trend in number of earthquake each year (1918-2007).

Figure 4. The graph of the cumulative function F(t).
Table 3. Parameter estimation values and mean occurrence period.

Figure 5. The graph of reliability function R(t).
because earthquakes are, for all practical purposes, random phenomena. Seismic risk and earthquake occurrence probabilities can be estimated by using statistical distribution. In this article, I have examined the statistics of great future earthquake occurrence on the Bangladesh region by using statistical analyses. Figure 2 indicates that the number of earthquake is increasing each of every year and its magnitudes level also increases time to time. These earthquake recurrences of certain magnitude are very dangerous for us and its impact will be demonstrated in near future. For our purely statistical estimations of great future earthquakes on the Bangladesh, I found that an earthquake with magnitude 6 or above, in the East investigation area is the most risk area. Risk of another earthquake after the preceding one in 7 years in east investigation areas is 92%. These results apply to any earthquakes on the fault between Tripura and Assam, rather than at a point on the fault. First time in these fault purely statistical estimates has been made and I believe that its importance will be more significant than other methods like purely filed based approach. Modules programmed in GIS, Easyfit-5.1, and excel 07 for performing tabulation, computations and depictions are available from the author.
Acknowledgements
The author thanks the editor and anonymous referee for thoughtful comments. The paper have been substantially improved due to their constructive feedbacks. Also grateful thanks are due to Tanjina for his help in data management.