Geophysical Mapping, Geochemical Evidence and Mineralogy for Nuweibi Rare Metal Albite Granite, Eastern Desert, Egypt ()
1. Introduction
Airborne radiometric and magnetic surveys have been used extensively in the mineral exploration industry predominantly for the delineation of mineral deposits [1] . Its application ranges from mineral exploration [2] , structure mapping and rock characterization [3] . Recent advances in technology have substantially increased the accuracy and resolution of these techniques so that they can be used to provide useful enhanced information on lithology and geological structures [4] . Additionally, advances in data analysis, processing and image enhancement techniques have improved the resolution of geophysical datasets further so that very subtle variations in the geophysical responses can be identified [5] .
Rare metal granites have been identified as those with high concentrations of normally dispersed elements such as F, Li, Rb, Cs, Sn, Ta, Nb, Zr, and REE [6] [7] . Such granites occupy a special place in petrologic thinking because of their unique and often extreme chemical features. The Nb-Ta oxides described in this study are part of the mineral assemblage in raremetal granites from the Nuweibi area. The most common Nb-Ta bearing minerals in these parageneses are zircon and Nb-Ta-bearing columbite-group minerals (CGM). Although exploration activities have decreased since then and several projects were wild due to a recession in tantalum prices, the development of some large scale projects is, however, still on track. One of them in Arabian-Nubian Shield of northeastern Africa and Arabia: Nuweibi is about to arise as a major Ta province. Sub-economic Ta concentrations have been found in the Nuweibialbite granite, located 20 km SSW of Abu Dabbab [8] [9] . In the central Eastern Desert of Egypt, rare metal mineralization was examined during a joint Egyptian-Soviet exploration program in the early 1970s; Sn-Nb-Ta connected with albite granite (apogranite) has been discovered for the first time at Igla, Nuweibi, Abu Dabbab, and Humr Waggat by [10] . They have attributed the formation of rare-metal mineralization to the metasomatic alteration processes affecting the host granites. The present paper strives to shed some light on the distribution of radioactivity, tectono-metallogenetic setting and the over allgenetic framework of the deposits as well as on possible exploration implications.
2. Occurrences of Tantalum Mineralization in the Nuweibi Area
Nuweibialbite granite lies between lat. 25˚11'30" to 25˚12'35"N and long. 34˚28'50" to 34˚30'10"E. The granites of Nuweibi are divided into eastern and western parts (FAG & MAG) by strike-slip fault along Wadi Nuweibi (Figure 1). The granites in the FAG have intruded the schist, and serpentinite rocks. The granites in the MAG are surrounded mostly by grey granites. Small bodies of Nuweibi granites intrude the country rocks. Nuweibi is located 20 km SW of Abu Dabbab area. The contact between the Nuweibi granite and the country rock is marked by a stocks cheider consisting of feldspar-quartz pegmatite and quartz cap [11] [12] . The FAG and MAG are petrographically slightly different, and can be also distinguished by their different degrees of mineralization. The FAG has higher modal albite contents and lower Nb/Ta ratios of about 0.6. It contains resources of 98 Mt of ore at 146 g/t Ta2O5 [9] . The two parts of the Nuweibialbite granite (FAG & MAG) are interpreted as sequentially emplaced melt batches from a two sources as indicated from the aeromagnetic maps that will be discussed latter. The FAG is representing the later and more fractionated magma.
3. Methodology
The application of integrated geophysical data (magnetic and radiometric) in the study area to predict zones

Figure 1. Geologic map of Nuweibi area, Central Eastern Desert, Egypt.
which have the ability to host mineralization have shown that the technique is potent and could be applied in deeply weathered terrains or regolith regions to pick exploration targets for blind ore deposits. The mapped geological structures, lithology and other hydrothermally altered zones (playing the role of mineralization indicators) from the aeromagnetic and radiometric datasets [13] .
The ground gamma-ray spectrometric measurements were conducted using a Geophysica Brno GS-256 spectrometer having a 0.35 L sodium iodide (NaI) thallium activated detector and a counting time of 30 seconds. The spectrometer is well calibrated on artificial concrete pads containing known concentrations of K, U, and Th. The data were generally recorded in the form of a square grid of 50 m interval.
The study area is included in the airborne magnetic survey that covers the Eastern Desert of Egypt conducted between by [14] . The purpose of the survey was to provide data, which would be of assistance in identifying and assessing the mineral, petroleum and ground water sources of the region and subsequently stimulate interest for further exploration.
Detailed petrographic, SEM and microprobe studies of the Nuweibi albite granite have been done in order to detect the mineralogical characterization, the associated alteration features, the spatial variations and alterations trends in the granite. In this task, 9 thin sections representing the two albite granite were investigated at the CREGU Laboratory.
Nine samples were collected from the Nuweibi area. These samples with least alteration were selected for geochemical analyses and mineralogical studies. Whole-rock and mineral element concentrations were analyzed at the CREGU Laboratory of Ore Deposit Geochemistry, Lorraine University, France. Mineral major elements were determined using the CREGU electron microprobe.
4. Petrographic Features and Mineralization
Nuweibi granites are fineto medium-grain, consisting mainly of quartz, alkali feldspar (albite + orthoclase), and muscovite. Cassiterite, columbite-tantalite, zircon, and ixiolite are the main accessories (Figure 2). They are characterized by equigranular, seriate to prophyritic textures. Quartz occurs either as phenocrysts or in the groundmass. The quartz phenocrysts are euhedral to anhedral, ranging in size from 1 to 3 mm in diameter. It contains poikilitic inclusions of albite laths arranged concentrically along the growth zones of the quartz crystals.
This is a characteristic texture for rare-metal granite in many places of the world. The presence of snowball textures as well as melt inclusions in the albite granite can support their magmatic origin [8] [15] . K-feldspar is represented by perthitic to non-perthiticphenocrysts of microcline up to 1.5 mm long.
Albite is the most abundant mineral in the granite. It is present either as minute euhedral laths up to 0.15 mm length included in quartz and K-feldspar phenocrysts, or large (0.2 - 1 mm), subhedral to euhedral laths in the groundmass. Swaps of albite crystals are also located along the margins of K-feldspar. The presence of albite as inclusions in the phenocrysts of quartz and K-feldspar as well as that of albite usually does not contain other rock forming and accessory minerals, proving that albite is the first crystallized mineral. Mica ranges in color from light green to colorless and occurs mostly as subhedral to anhedral flakes interstitial to albite and rarely found included in quartz phenocrysts. Replacement texture on albite and K-feldspar indicate that part of white mica was formed by subsolidusmetasomatism. Microclinization and amazonization of K-feldspar as well as greisenization represent the main hydrothermal metasomatic processes observed locally in the study granites. The metamict zircon crystals are rimmed with pleochroic haloes in both FAG and MAGdue to their radiogenic nature and presence of uranothorite (Figure 2(d) and Figure 2(f), respectively).

Figure 2. Photomicrographs for Nwueibi albite granites: (a) Zircon crystals show zonation enclosed in microcline. (b) Mn-tantalite and tapiolite-Mn surrounded by plagioclase crystals. (c) Mn-columbo-tantalite and Ixioliteinclosed in plagioclase crystals. (d) Zircon and Ixiolite enriched with uranothorite corroded muscovite flake. (e) Mn-columbite and zircon with radioactive halos en-closed in orthoclase crystals. (f) Metamictization of zircon anddark brown Mn-columbitesurrounde by orthoclase and muscovite crystals.
5. Ground Spectrometric Survey
[16] Demonstrated the utility of airborne radiometric data even in its primitive form. [17] Demonstrated thatradiometric classification of formation data and outcrop data into lithological categories can beaccomplished. In such type of exercises the ternarymaps are particularly valuable. Gamma-ray maps reflect the geochemicalvariations of K, U and Th in the upper 30 cm of the earth’s surface. This thin layer is subject tow eathering which leads to the loss of the radio elements. Mineralizing process may also alterradio element content. K may increase in altered rocks. Th may show increase or decrease during hydrothermal alteration. Detailed interpretation of aerial gamma-ray survey requires the delineation of major geological units and examination of subtlevariations with the aid of other data [18] .
Consideration of the surface distribution of radioactive elements is represented by the image maps for K, eU, eTh and eU/eTh in Figures 3-6 as well as of Table 4. It is clear that the Nuweibi Granite is characterized by a
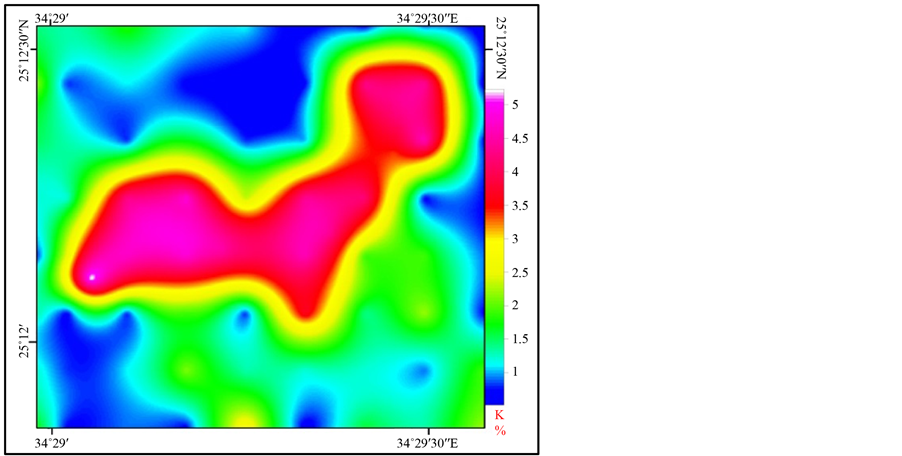
Figure 3. K, % image map of the Nuweibi area.

Figure 4. eTh (ppm) image map of the Nuweibi area.

Figure 5. eU(ppm) image map of the Nuweibi area.

Figure 6. eU/eTh image map of the Nuweibi area.
high level of radiation compared with the surrounding rock. The FAG has slightly higher eU contents (4 to 14 ppm, average 10 ppm) than the MAG (3 to 11 ppm, average 7 ppm) as shown in Table 4 and Figure 5. eU contents of both granites are greater than the average upper crust value (2.7 ppm [19] ). While the MAG contain higher concentrations of both thorium (21 - 40 ppm, average 33 ppm) and potassium (3% - 5.4%, average 4.3%), than in the FAG, which has concentrations of thorium ranges from 14 - 33 ppm with an average 22 ppm and lower potassium content (2% - 4.4%, average 3.5%). Therefore, the map of the distribution of uranium to thorium ratio shows a marked increase in the northeastern part of the area that occupied by the FAG.
Potassium image map (Figure 3) shows that the MAG already contains higher concentrations of potassium reached up to about 5.5% more than that of the FAG which reached to only 4.5%. Figure 5 shows the image map of the equivalent uranium distribution of Nuweibi area, which reflects that the highest eU concentration in the studied area is associated with the FAG that located in the northeastern part then followed by the MAG. This corresponds also to the concentrations of chemical analysis of the samples of both types (Figure 17 and Figure 18). In contrast, the eTh concentrations of the MAG are higher than those in the FAG where the highest thorium anomaly is located in the western side of the studied area, which up to about 40 ppm (Figure 4). Hence, the eU/eTh ratio map (Figure 6) shows that the FAG is characterized by high anomaly (0.7) compared to the MAG (0.4), which considered higher slightly than the averages ratio of the crustal rocks (0.25). Consequently, both K and eTh for the MAG is higher than those for the FAG and vice versa in the case of eU, where the FAG contains a highest eU concentration in the study area.
6. Correlation of Both Spectrometric and Chemical Data
Figure 7 shows a comparison of the concentrations of radioactive elements for each of the results of chemical analysis and the results of the ground spectrometric survey data. Figure 7(a) shows that the K concentration in the FAG resulting from the chemical analysis is higher than those resulting from ground spectrometric measurements. While the opposite in the case of MAG where K concentrations that measured in the field are higher than that analyzed chemically. This indicates that the MAG is more altered than the FAG.
Figure 7(b) shows the distribution of Th resulted from the chemical analyses and eTh resulted from ground spectrometric measurements. The MAG is characterized by higher eTh concentrations than those chemically measured Th. While in the case of the FAG, there is a rapprochement between the two values with a slight increase for the field measurements than chemically measurements in the lab. This confirms that the MAG is more altered than the FAG. Generally, the concentration of thorium in both cases is higher for the MAG than for the FAG indicating that those are two different magmas.
Figure 7(c) shows the distribution of the uranium for both the MAG and FAG, which reflects an increase of

Figure 7. Th(ppm)-U(ppm) relationship of Nuweibi area.
U-content of the FAG than those for the MAG in both field spectrometric and chemically data. It is noted that the concentrations of eU that measured in the field in both cases are higher than the U values measured chemically.
It is worth mentioning that the concentration of the U measured by ground spectrometric survey is higher than those measured chemically in the case of the MAG than in case of the FAG. This confirms that the uranium in the studied area has been subjected to leaching and migration away. This migration is more in the case of the MAG that subjected to more weathering than in case of the highly fresh FAG.
7. Processing of Aeromagnetic Data
Magnetic anomalies in the Earth’s magnetic field are caused by magnetic minerals in the rocks, and maps of these anomalies can be interpreted in terms of geology [20] . Relatively less expensive and wider covering gravity and aeromagnetic data have also led to elucidation of both the near-surface and deep structure of granite-greenstone terranes (e.g., [21] ).
The regional-residual separation of magnetic anomaly was applied to the RTP magnetic map of the study area (Figure 8 and Figure 9). Two main average magnetic interfaces at depths of 0.576 and 1.458 km below the measuring level were calculated through the application of a power spectrum technique (Figure 10). Filtering assisted in the discrimination between shallow and deep sources of magnetic anomalies and produced the regional and residual magnetic component maps (Figure 11 and Figure 12).
The interpretation of magnetic data in the study area is mainly carried out on the RTP magnetic map (Figure 8 and Figure 9), the regional-component from deep-seated sources (Figure 11) and the residual-component from near surface sources (Figure 12). By investigation and correlation between the magnetic features and the geo-

Figure 8. Total magnetic intensity reduced to the pole 3D-image map (nT) of Nuweibi area.

Figure 9. Total magnetic intensity contour map (nT) with geologic background of Nuweibi area.
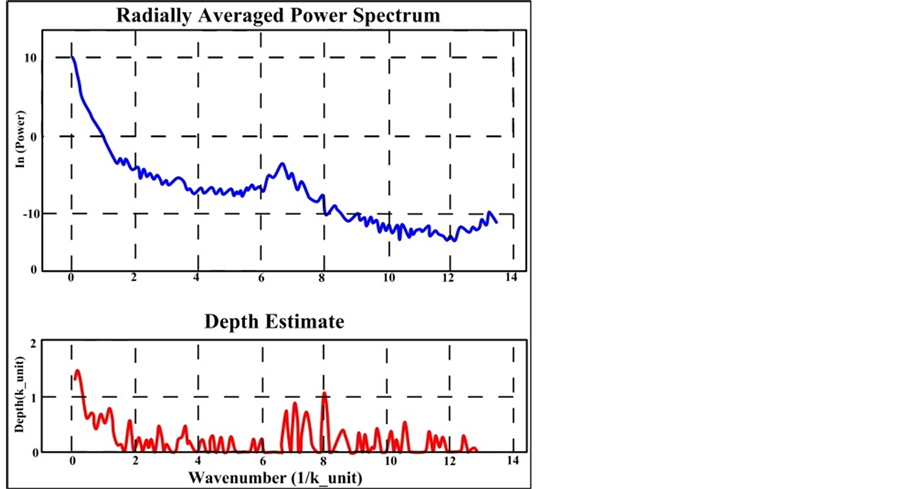
Figure 10. Spectrum frequency chart for RTP magnetic data of Nuweibi area.
logic map, it was found that there is a good correlation. The basic lithologic units possess high magnetic response, while the acidic ones have low response. The contact between the granitic outcrops with the schist on the eastern part of the geologic map is clearly obvious on the magnetic maps. This zone is nearly extending in the N-S directions on the RTP magnetic anomaly map (Figure 9). The amplitudes of the positive anomalies reach about 42,550 nT, which indicates that the causative bodies are ultrabasic in their composition. This zone is relatively elongated to relatively oval in shape. The high contrast change of the magnetic intensity along the contact of this zone clearly reflects mostly intrusive contact. Since the magnetic gradients of this zone decrease gradually towards the west, this reflects the change in the lithological composition that may be due to a causa-

Figure 11. Regional-component of the RTP image map (nT) of Nuweibi area.

Figure 12. Residual-component of the RTP image map (nT) of Nuweibi area.
tive granitic body toward the east-southeast and extent beneath the schist. This is also clear in the geologic section and verified with drilling boreholes.
On the regional magnetic anomaly map (Figure 9), this anomaly shows wide circular positive and strong amplitude (42,530 nT) which indicates, clearly that this anomaly represents a deep-rooted highly-magnetized body. Meanwhile, on the residual (near-surface) magnetic anomaly map (Figure 9) this anomaly is represented by corresponding to positive and negative closures of high amplitudes, which indicate that the causative body continues till a shallow depth from the ground surface with intruded by shallow acidic bodies that shown in the geologic section by intruded biotite granite.
Southeastern part which covered by the serpentine, gabbro and schist in addition to biotite granite is characterized by negative magnetic intensity reached to 42,200 nT compared to the adjacent high positive anomaly (42,550 nT) for the same rock units (Figure 8 and Figure 9). This negative anomaly also exists in the regional magnetic map (Figure 11). Therefore it could be due possibly to intruded a large body of albite granite extends to considerable depth below the serpentine and gabbro and schist.
This zone may be represents the source of that MAG in the center area. On the other hand there is a negative anomaly occupies a large zone located in the north of the study area and often associated with the biotite granite, albitegranite and wadideposits and in addition to a small part of the schist. This anomaly also appear in the regional component magnetic map, which confirms that it represents a large body of albite granite extends to great depths and probably represents one of the main source center of the intrusion of the FAGs in the eastern part of the studied area.
The northwestern parts of the studied area has two anomalies of moderate magnetic intensity and take the form of an elongated shape extended in the direction of the east-northeast. It is expected that is due to two parallel basic dikes. This expectation is enforced by existence of small outcrops of these basic dikes in the field.
From preview of the residual component magnetic map (Figure 12) as well as the Werner depth map (Figure 13) shows that the depths of the interface contact with the basement rocks ranges from 0 - 380 m and geological structures affecting the studied area is divided into several different stages.
The most important and perhaps the newest trend of these structures is extended in the northwest-southeast because it is characterized by a long length of extension and cutting most of the rocks units of the studied area. The second phase of the structural lineaments or faults extended northeast-southwest while the third phaseis elongated in the north-south direction. There are also two structural phases but with few impact that elongated in the north northwest-south southeast and in the northeast east-southwest west directions.
8. Magnetic and Radioelements on Selected Geological Cross Section
Figure 14 show the geological cross section for the northeastern part of the study area, which cut the FAGs and the surrounding basic rocks as well as five wells that has spread along it (Figure 14). The profiles for each of the magnetic intensity data and radioactive elements (K, eU, eTh) have been constructed, as well as the ratio

Figure 13. Werner-deconvolution depth and structural lineaments cluster map of Nuweibi area.

Figure 14. Magnetic and radio elements stacked profiles on a selected geological cross section along the FAG of Nuweibi area.
(eU/eTh). It is clear that the serpentine, gabbro and schist outcroppings have high magnetic intensity up to 42,480 nT, which gradually decreases in the direction of the west as a result of presence FAG which is characterized by severely magnetic less than 42,240 nT. It is clear that the center of the abite magma intrusion comes from the western direction for this profile, which is located near the middle of the northern studied area, as shown by the map (Figure 8 and Figure 11). Meanwhile, the profiles of radioactive elements show clear increasing concentrations associated with the FAG which reached up to 15 ppm, 30 ppm and 5% for the uranium, thorium and potassium respectively. It also notes that the eU/eTh ratio for the FAG is also characterized by an increase level up to 0.6, twice the rate of natural granitic rocks that is about 0.25. The basic country rocks that are located in eastern direction represent a very low background radiation in the studied area.
9. Geochemistry
It is noted that the samples of Nuweibi area are divided into two groups, one of them (Nwb1, Nwb2, Nwb3, Nwb4, Nwb5) represented the FAG while the other group (Nwb6, Nwb7, Nwb8, Nwb9) is representing the MAG.
9.1. Major Element Concentrations
The relationship between  and
and , (Figure 15) is showed positive direct relationship for most samples of the studied area. It is noticed that eastern partis characterized with the highest level of albitization while west of the area tend to increase in feldspars.
Figure 16 of the relationship between  &
&  shows an inverse relationship for Nuweibi samples. While the east samples represent less B values and relatively high values of A than west samples. This confirms that all samples of the studied areas are located in the field of strongly peraluminous.
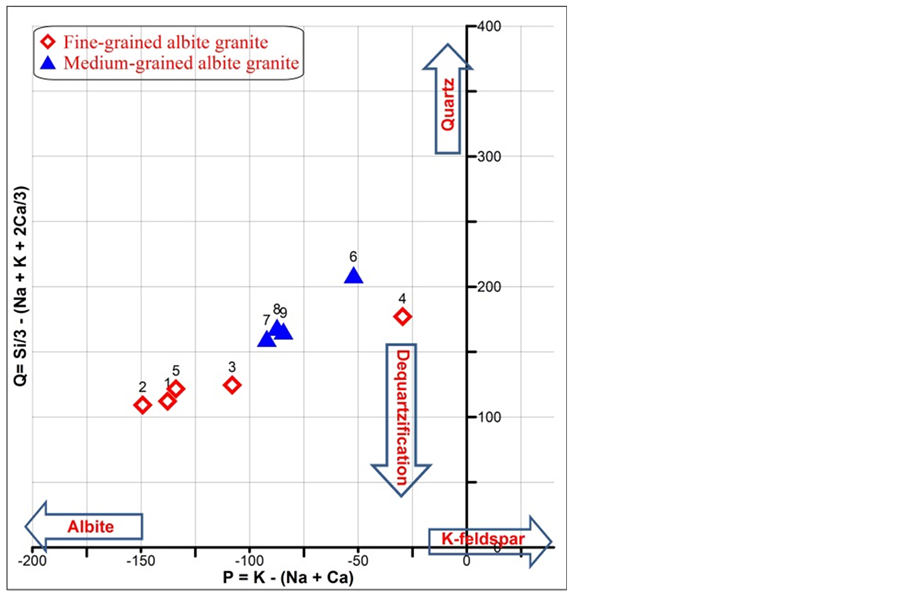
Figure 15. Variation of the K-feldspar/albite (P parameter) versus quartz contents (Q parameter) for the MAG and FAG at Nwueibi area. Q-P mineralogical-chemical diagram from [22] .

Figure 16. Variation of the peraluminous index (A) with fractionation index (B), for the MAG and FAG at Nwueibi area. A-B mineralogicalchemical diagram, from [22] .
9.2. Trace Element Distributions
Figure 17 shows relationship between U and K where east Nuweibi area (FAG) is the highest one of the U values indicating increase of the uranium with albitization. The lines of  and
and  are represented range of the FAG whereas the ratio range of
  to 1 are associated with the western part (AFM).
It is clear from the relationship between Th and U (Figure 18) that the Nuweibi area represents normal contents of both Th (16 - 27 ppm), and U (1.5 - 7 ppm) (Table 2). Meanwhile the FAG shows an increase in the U content than the MAG indicating increase of the uranium with albitization. The samples of MAG lie between two lines of ratios  whereas samples of FAG lie between two ratios of
 .
.
Figure 19 shows that the relation of Hf against Zr. Hf has equal values in both of the AMF and MAG of about 23 ppm (Table 1). The MAG has Zr content twice of that for the FAG. The AMF of Nuweibi area represents a significant increase of the hafnium compared to the accompanied zircon (Hf/Zr = 1/3 to 1/2). On the other hand, the ratio of Hf/Zr is low in case of the MAG that ranged from 1/7 to 1/4.
Figure 20 represents the relationship between each of the Nb & Ta shows that the samples of the studied area are scattered through two separated zones due to the increase in Ta in case of the FAG compared to the Nb content. The Nb is nearly equal for both FAG and MAG with an average of about 60 ppm. Meanwhile the FAG has high content of the tantalum reaching to 180 ppm compared to low content of Ta for the MAG of an average 25 ppm (Table 2). Nb/Ta ratio is low for the FAG with an average of 0.6 whereas it is high in the case of MAG reaching twice value of an average 1.2.
9.3. Rare Earth Elements
Table 2 lists the abundances of trace elements including the REE data of whole-rock samples. The primitive mantle-normalized incompatible trace element patterns of samples from Nuweibiarea are enrichments in elements, such as Rb, Ta, Nb, Zr, and Hf and depletions in elements such as Ti and Eu (Figure 21). The depletions of Ba, Sr and Ti are most likely caused by the fractionation of plagioclase, apatite, and mafic minerals [23] . The granite samples are characterized by higher uranium contents than the average of the other granites in the world

Figure 17. K(%)-U(ppm) relationship of Nuweibi area.

Figure 18. Th(ppm)-U(ppm) relationship of Nuweibi area.

Figure 19. Hf (ppm)-Zr (ppm) relationship of Nuweibi area.

Table 1. Ground Spectrometric data for Nwieba area, Central Eastern Desert, Egypt.

Figure 20. Nb (ppm)-Ta (ppm) relationship of Nuweibi area.
(3 ppm [24] ). The chondrite-normalized patterns of representative samples show that they are characterized by highly fractionated REE patterns, i.e., LREE enrichments relative to HREE (Figure 22). Nuweibi albite granites are depleted in total REE and LREE and have more pronounced negative Eu anomalies. This result suggests more evolved fractional crystallization. The low δ Eu values indicate residual plagioclase in the source region or the removal of plagioclase from the parental magma.
Table 2 . Major elements (%) and trace elements (ppm) compositions of the Nwieba area.
Continued

Figure 21. Primitive mantle-normalized trace element spider diagrams for the Nweibi granites (The normalization values of the primitive mantle are from [25] .
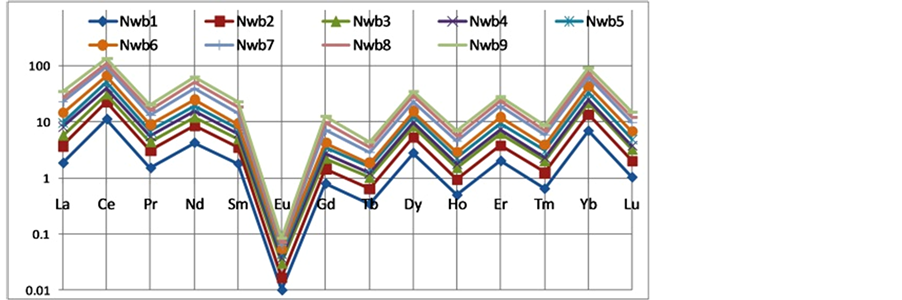
Figure 22. Chondrite-normalized REE patterns for the Nweibi granites. (The normalization values of the chondrite are from [26] ).
10. Mineralization
10.1. Cassiterite
Cassiterite occurs as grains or euhedralbipyramidal crystals included in the zircon phenocrysts (Figure 24). It exhibits progressive zoning with color grading outward from deep brown core to yellowish brown or yellow rim. The dark bands are rich in Nb, Ta, and Mn. Cassiteriteis bearing in zircon as in FAG and found with Mn-columbite as in MAG (Table 4 and Figure 25).
10.2. Columbite-Tantalite
Mn-Columbite, Mn-columbo tantalite and Mn-tantalite are the main Nb-Ta-bearing minerals in the studied Nuweibialbite granite samples. They occur as bladed or prismatic euhedral to subhedral crystals (Figure 23, Figures 26-29), either as inclusions in the quartz phenocrysts or as dispersed crystals in the groundmass. Other rare Ta-bearing minerals such as ixiolite, wodginite, and tapiolite are also identified (Figure 27 and Figure 30, Table 3). The examination of polished sections under microscope reveals a reflectivity very close, but slightly higher than that of mangano columbite inclusions, more intensive anisotropy and internal reflections, and very similar polishing hardness. The effective distinction from mangano columbite was assured only by the unusual composition obtained by microprobe analyses with Ta2O5, Nb2O5, SnO2, MnO2, and Fe2O3 contents ranging from 52 to 69 wt%, 5 to 13 wt%, 7 to 17 wt%, 6 to 14 wt%, and 2 to 7 wt% respectively (Figure 23, Figure 27 and Figure 30, Table 3). This large range in composition is observed crystals that show oscillatory composition alzoning with a general trend of enrichment of the heavy elements (Ta + Sn) in the rim and of Nb in the core (Figure 23).
10.3. Zircon
Zircon is one of the most important radiogenic accessory minerals in the granitic rocks [27] . It occurs as short and long euhedral prismatic and/or bipyramidal crystals, possessing various colors (pale yellow, reddish-brown, reddish-orange and colorless). The euhedral shape of the zircon suggests its magmatic origin (Figure 23). Ocassionally, zircons show slight to moderate roundness at one or both ends and terminations of the pyramidal and/or prismal faces, most probably as a result of late magmatic corrosion (Figure 24). The composition of zircon is not normal because it enriched with Hf, where ZrO2, HfO2 and SiO2 make the main components with possible substitution of Zr by Y, REE, Th and U (Figure 23, Figure 24 and Figure 29). Most of zircon in the MAG and FAG is characterized with distinct concentrations in U and Th in core and has high content of Nb, and Ta at its rim (Figure 24 and Figure 29).
10.4. Uraninite UO2
Although the FAG underwent pervasive alteration, U enrichments are the product of primary magmatism. As shown in Figures 27 and Figure 28 U-rich accessory minerals inclusions are represented by zircon and uraninite. Radiation halo occurs around with these minerals. These minerals are magmatic origins and they are the principal hosts of U in the Nweibi granite.

Figure 23. SEM-BSE images for Mn-columbite and tantalite minerals and zircon in the FAG (Nwb2), Nweibi area.

Figure 24. SEM-BSE images for Uraninite and cassiterite minerals as inclusions in Zircon in the FAG(Nwb3), Nweibi area.
10.5. Uranothorite (U, Th) SiO4
Uranothorite is considered as one of the radioactive minerals that are derived from the magma differentiation. Uranium is usually present in amounts up to about 18% in this mineral (Figure 29). Uranothorite occurs as in-

Figure 25. SEM-BSE images for tantalite and cassiterite minerals at the rim of Mn-columbite in the MAG(Nwb6), Nweibi area.

Figure 26. SEM-BSE images for Mn-columbite and tantalite minerals and zircon in the FAG(Nwb2), Nweibi area.
clusions in zircon (Figure 29). The obtained EDS spectra for these inclusions reflect the chemical composition of uranothorite. It is mainly composed of ThO2 (51.8 wt%), SiO2 (23.7 wt%) and UO2 (18.0 wt%). Other elements present in small to minor amounts are Zr, Pb (Figure 29).
10.6. Monazite (Ce, La, Th) PO4
Monazite is the most common REE-bearing mineral, which has preferential selectivity towards the LREE and is also known as ultrastable mineral during weathering. Uranium may also occupy some of the REE sites in mona
Table 3 . Electron probe microanalyses (EPMA) of columbite, tantalite and cassiterite in Nuweibialbite granite.
Continued

Figure 27. SEM-BSE images for Mn-columbite and tantalite minerals and zircon in the FAG(Nwb2), Nweibi area.
zite [28] . It must be noted that the studied monazite mostly exist in the MAG and contains appreciable amounts of average ThO2 (4 wt%) together with Ce2O3 (50 wt%), La2O3 (12 wt%) and Nd2O3 (10 wt%). Subordinate amounts of Ca and P are also present (Table 4).
10.7. Thorite (ThSiO4)
This mineral is mainly found as inclusions in feldspars causing radiation damage of the feldspar lattice. Under
Table 4. Electron probe micro-analyses (EPMA) of Zircon, hafnium, uranium and thorium in Nuweibialbite granite.
Continued

Figure 28. SEM-BSE images for Mn-columbo tantalite and walferitein the FAG (Nwb4), Nweibi area.
the binocular microscope, thorite is mainly found as individual grains measuring at 0.1 mm in diameter (Figure 27). The EDS analysis (Figure 27) showed that thorite is Mn-rich and consists essentially of ThO2 (67%) and SiO2 (16.7%). Other elements detected in small to minor amounts are Nb, Ta, Ca, P, Nd and Zr (Figure 27 and Figure 30, Table 4).
10.8. Relationship of (Nb + Ta)-(Fe + Mn)-(Sn + Ti)
The lowest Nb/Ta ratios are observed low in the FAG whereas the MAG is characterized with the highest Nb/Ta ratios (Figure 31). The Nb enrichment of MAG and thus, their distinctly higher Nb/Ta ratio very probably reflect a different nature of the protolith (e.g., [29] ). In all of the Nweiba granites, Nb and Ta are predominantly hosted in zircon and in columbite-group minerals. The columbite-group minerals from the Nuweibi area have a

Figure 29. SEM-BSE images for zircon enriched with Hf and uranothorite minerals in the MAG(Nwb7-5), Nweibi area.

Figure 30. SEM-BSE images for Ixiolite, Mn-columbo tantalite and thoritein the FAG (Nwb1-10), Nweibi area.
highly variable  ratio, ranging from 0.64 to 0.72 in MAG and from 0.42 to 0.89 in FAG (Figure 31). The increase of
  ratio in columbite-group minerals is typically attributed to fractional crystallization in raremetal-enriched granites and granite pegmatites [30] .
The only other known occurrenceof tapiolite in rare-metal granites was described by [31] where this mineral is associated with columbite-group minerals. In common with thetapiolite-bearing assemblage from the FAG, the crystallization of tapiolite-(Mn) occurred in the final stages of granite evolution.
These compositions, in a triangular plot of Ti, Sn vs. Fe, Mn vs. Nb, Ta lie along a linear trend between usual cassiterite, columbite and ixiolite compositions, filling a gap observed by after [32] [33] , between naturally coexisting columbite-tantalite and ixiolite (Figure 32). In this mineral the pattern of compositional zoning with

Figure 31. Compositional trend of columbite group minerals of FAG and MAG IN Nwueibi area.

Figure 32. (Nb + Ta)-(Fe + Mn)-(Sn + Ti), atomic ratios, ternary plots of the investigated columbite-tantalite (after [32] ). The field boundaries of cassiterite (Cst), rutile (Rt), columbite-tantalite (Ct), ixiolite (Ixt) are from [33] .
enrichment of tantalates is that of a late Ta and Mn enrichment at expense of Fe and Nb.
11. Conclusion
Nuweibi granite can be distinguished into two facies: these are the MAG and the FAG (FAG), which are characterized by significant enrichment in Nb, Ta, Zr, Hf, U, Th and the rare earths. These studies have shown that FAG, which is located to the east of the studied area, is characterized by high concentrations of tantalum, up to 65.4% and niobium that reached up in some samples to 60% with an average of 30%. FAG is also characterized by a slight increase of uranium compared to thorium and potassium. Meanwhile, MAG is rising in concentrations of both thorium and potassium compared to uranium. The Hf/Zr ratio is high for the FAG than for the MAG where the concentration of zircon in almost equal for the two types, which reached up to about 55%. Meanwhile hafnium reached up to 28% in FAG and to 11% in MAG. The advantage of MAG is its high concentration of niobium, which reached up to 68% while its contents of tantalum does not exceed 33% and hence the Nb/Ta ratio is always high compared to the FAG. The Ground gamma ray spectrometric survey conducted for the study area, explained differentiation of FAG in its uranium content of more relative to thorium and potassium, and this is consistent with the results of chemical analyses, while the opposite in the case of MAG is characterized by increasing of both K and Th relative to U that also agree with the chemical data. To identify the tectonic sitting in the studied area and the extent of qualitative of MAG and FAG relationship with each other and with the surrounding rock, it was necessary to use the aerial magnetic survey data for mapping of the area. The interpretation of the magnetic maps showed that the geological structures of the studied area were represented by five main trends. The most important and recent one of them is trending in northwest-southeast and extends to large distances and cutting most of the old faults. They followed in importance with faults often trending in the northeast to east northeast direction that have high density and cut most rocks of the studied area. The third structural trend is that trending in the north-south and north northwest-south southeast. Through deepcomposite maps it is clear that the roots of the FAG are located in the center of the north zone while the roots of MAG perhaps are located to the south east of the studied area which reached to depth more than 1470 m. The Werner depth map shows the interface depths of the granite and basement rocks that extend to great depths ranging from 10 to 380 m. It is nested under the surrounding schist rocks in the area and contains nested inside parts of these rocks. By comparing chemical data analysis with ground spectrometric data, it is clear that the FAG is more recent and fresh than MAG. It is evidenced from the geologic cross section compatible with drilling wells in the FAG and adjacent schist, as well as the related aeromagnetic survey data and spectrometric data that spanning distances and depths are more than 200 m down the schist.