Can Loyal Customers Tolerate Service Failure? The Moderating Roles of Service Failure Severity and Transaction Frequency in a B2B Context ()
1. Introduction
Customer loyalty has been the goal that firms pursue, because loyal customers are less likely to change their purchase behaviors solely due to environmental and marketing impacts [1]. Once establishing loyal relationships with customers, firms can not only attain repeated purchases, but also enhance the lifetime value of customers [2,3]. A service failure refers to a failure during service processes; customers feel dissatisfied when provided services fail to meet customers’ demands [4]. If firms do not handle service failure with care, it will result in direct customer complaints and even negative word-of-mouth, bringing damage to the corporate image [5,6]. Prior research into customer loyalty focused on the antecedents, such as service fairness, service quality, customer satisfaction, and customer lifetime value; less attention has been paid to the consequences of customer loyalty. Our study uses service failure severity and transaction frequency as moderating variables to examine the relationship between customer loyalty and zone of tolerance of service failure.
2. Theory and Hypotheses
2.1. Customer Loyalty
Customer loyalty has been regarded as one of central issues of customer relationship management [7]. In recent years, increasing attention has been paid to the notion of customer loyalty because it is the major conesquence variable [8] and is one of the important resources for profits [9]. Kotler [3] suggests that customer loyalty occurs when consumers repurchase, pleasantly share products with others, tend to neglect marketing advertising from other competitors, and would not purchase the products from other competitors. Zeithaml and Bitner [10] divided customer loyalty into behavioral loyalty and attitudinal loyalty, whereas the former refers to repeated purchase and the latter refers to customer attribution or identification with the products or service [11].
2.2. Zone of Tolerance to Service Failure
In cases where simultaneous service and consumption exist, the occurrence of service failure could not be avoided in the service process regardless of concurrent efforts by employees [12-14]. Consumers tend to act with negative emotion as service failure occurs, which could lead to consumers switching service providers [15]. Due to inconsistencies in service delivery, Grönroos [13] proposes that every customer has a zone of tolerance, and the perceived zone of tolerance varies for every customer. Johnston [16] categorizes expected service and actual service in the service process into three types: fully acceptable, acceptable and unacceptable, with the first two being known as the tolerance zone. Researchers [16,17] further found that price, competition, or specific service can affect the zone of tolerance for service failure. Are there other factors that may influence the zone of tolerance for service failure?
2.3. Moderating Effects of Service Failure Severity
Service failure severity refers to customer perceptions of the levels of severity when a service failure happens [18]. The zone of tolerance to service failure range may be reduced while the level of dissatisfaction increases [18, 19]. Social judgment theory [20] holds that everyone has his/her own standards based on previous experiences. These standards will form two latitudes: the latitudes of acceptance and rejection. The latitudes of acceptance and rejection for each person vary, and many factors affect such latitudes. Customer involvement is one of them [21, 22]. When customers engage more frequently with suppliers, they tend to have a deeper understanding of the product through a high degree of participation in the service delivery process and the latitude of acceptance narrows while the zone of tolerance diminishes. On the other hand, lower involvement means that customers care less and the latitude of acceptance broadens, leading to a larger zone of tolerance. For this reason, when customers perceive more severe service failure, their zone of tolerance diminishes. Hence, the study proposes that:
H1: The positive relationship between customer loyalty and tolerance to service failure is weaker for high severity of service failure than low severity of service failure.
H1-1: The positive relationship between customer loyalty and tolerance to service failure is weaker for high severity of delivery time error than low severity of delivery time error.
H1-2: The positive relationship between customer loyalty and tolerance to service failure is weaker for high severity of product delivery mistakes than low severity of product delivery mistakes.
H1-3: The positive relationship between customer loyalty and tolerance to service failure is weaker for high severity of poor service attitude than low severity of poor service attitude.
2.4. Moderating Effect of Transaction Frequency
Transaction frequency refers to the number of transacttions a customer makes with a firm within a specified time. In general, customers with higher transaction frequency know the firm’s products and services well. Morgan and Hung [23] found that when the two parties satisfy the transaction, the interaction can increase mutual trust and reduce transaction risks. In their study, Becerra and Mehta [24] also found that increased frequency of interactions increases the trust between organizations and between individuals. Hence, customers with higher loyalty tend to engage in higher transaction frequency, meaning that trust between the two parties lowers transaction risks and the zone of tolerance to service failure also increases accordingly. Based on the aforementioned statement, the study proposes:
H2: The positive relationship between customer loyalty and tolerance to service failure is stronger for customers with high transaction frequency than for those with low transaction frequency.
3. Research Method
3.1. Measurement
A survey was conducted on the hair salon industry in Taiwan. For customer loyalty, the study adopted the scale from Prus and Brandt [25] and, Reichheld and Schefter [20], divided into three constructs: repurchase intention, recommendation behavior, and price tolerance. Minor changes were made for the use in this study. The questionnaire consisted of nine questions, and the measurement method adopted the Likert 7-point scale, giving 1 to 7 points for replies ranging from highly disagreed to highly agreed, wherein a higher score implies higher customer loyalty to suppliers in the hair salon industry. For the zone of tolerance to service failure, measurement constructs include 1) employee response to service delivery system failures; 2) employee response to customer needs and requests; and 3) unprompted and unsolicited employee actions, as inspired by Kelley, Hoffman and Davis [26], as well as Bitner, Booms and Tereault [27]. A total of 10 questions were asked by using a Likert 7-point scale, giving points from 1 to 7 for replies ranging from completely intolerable to completely tolerablewherein a higher score implies a higher zone of tolerance for hair salons industry than for other suppliers. Service failure severity was measured with scales derived from Weun et al. [18]. Each respondent was asked to answer three questions: failure in product delivery time, failure in delivering products or equipment, and failure in service attitude, which were measured on a nominal Liker’s 5-point scale, giving points from 1 to 5 for replies ranging from not severe at all to very severe. According to industry practices, transaction frequency employs a monthly unit divided into 4 intervals from the shortest one time per month to the highest of 11 times (inclusive) or more per month.
3.2. Sampling
The questionnaire was improved and finalized on the basis of the pilot-test, after which the final questionnaire was distributed in person to the attending members of 2012 hair salon industry annual assembly in Zhongli City of northern Taiwan because of concern with the low recovery rate often encountered in using a postal questionnaire. Based on the previous experiences, the hair salon companies in Zhongli City have assigned representatives to attend the annual event. The attending representatives were usually positioned as chairman, general manager, assistant manager, and division heads as well as other supervisors. Additionally, some of the questionnaires were distributed through the referral of product suppliers to complete the questionnaires and fax them back to the authors. A total of 113 usable questionnaires were received, providing an effective retrieval rate of 91%. In these samples, females accounted for the majority with 88%, aged 31 - 40 years old mainly, followed by 21 - 30 years old and 41 - 50 years old. The majority of seniority is 16 - 20 years, with 1 - 5 years of transactions with the product suppliers. The majority of monthly transaction is 2 - 3 times.
4. Research Results
4.1. Exploratory Factor Analysis on Customer Loyalty
This study conducted factor extraction from a questionnaire on customer loyalty, as shown in Table 1. We discovered that all questions (other than question 2 with a lower factor loading) had a factor loading of 0.6 and above with a cumulative explained variance of 76.5%, indicating that these factors represent the structure of primary data.
4.2. Exploratory Factory Analysis on Zone of Tolerance to Service Failure
Table 2 shows that the factor loading for the zone of tolerance to service failure are all greater than 0.6 without deletion of any questions. Three factors were extracted using the oblique rotation method while the cumulative explained variance is 74.483%, indicating that factors represent the structure of primary data. Reliability was assessed using Cronbach’s alpha for the three constructs. Estimates exceeded the 0.7 standard suggested by Nunnally [28].
4.3. Hierarchical Regression Analysis
Hierarchical regression analysis was used to test the moderating effects. Model 1 - 3 in Table 3 shows that control variables, independent variables and moderating variables, all not reaching significant levels.

Table 1. Exploratory factor analysis on customer loyalty.

Table 2. Exploratory factory analysis on the zone of tolerance to service failure.
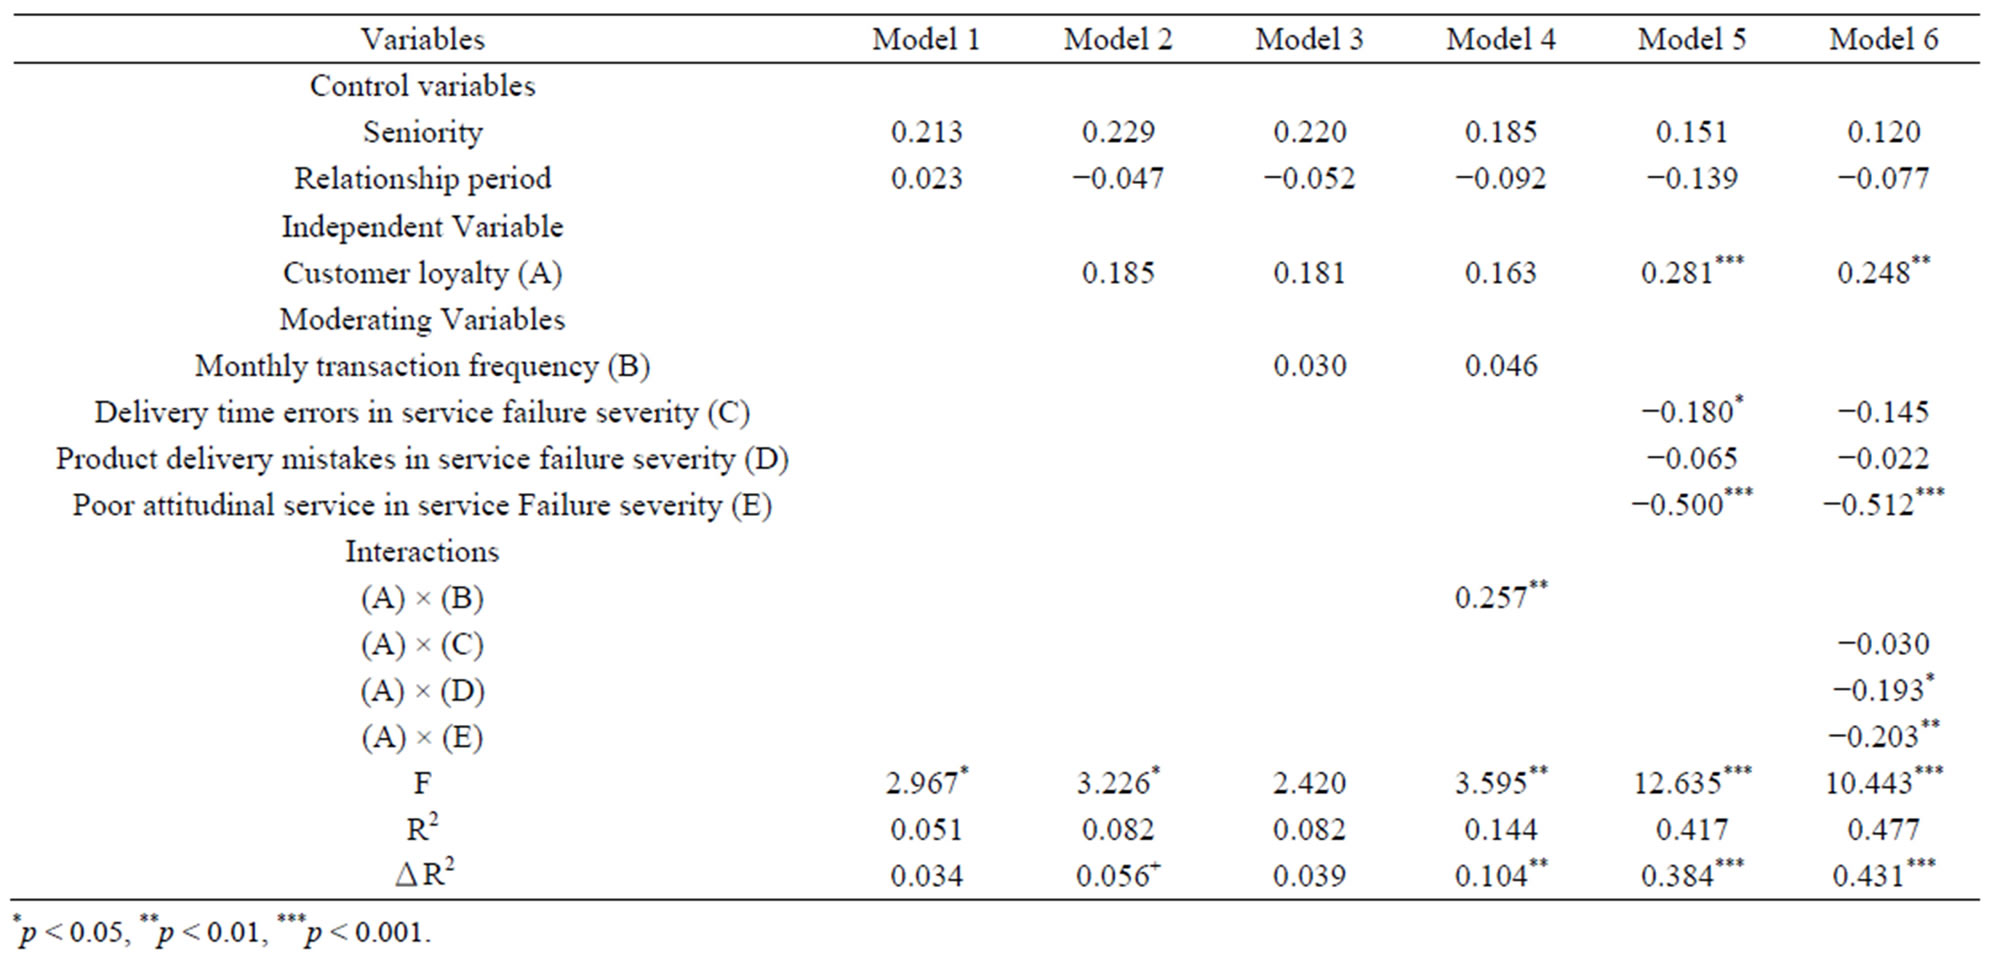
Table 3. Hierarchical regression analysis.
4.3.1. Moderating Effect of Transaction Frequency
With regards to the moderating effects, Model 4 shows that the interactive effect between customer loyalty and transaction frequency is statistically significant (β = 0.257, p < 0.05). In order to further understand the interactive effect between customer loyalty and transaction frequency, we divided customer loyalty into high and low groups, produced a means contingency table, and rendered an interactive effect diagram. Figure 1 shows that, for customers having a high transaction frequency, the relationship between customer loyalty and the zone of tolerance to service failure is stronger than those having a low transaction frequency. Hence, H2 is supported.
4.3.2. Moderating Effect of Service Failure Severity
Product Delivery Time in Service Failure Severity. Model 5 shows that delivery time error in service failure severity is significant on the zone of tolerance to service failure, and appears as a negative correlation (β = −0.180, p < 0.05). With regards to the moderating effect, Model 6

Figure 1. Moderating chart of transaction frequency (TF) on the relationship between customer loyalty and zone of tolerance to service failure (ZTSF).
shows that the interactive effect between customer loyalty and delivery time error of service failure severity is not statistically significant. Therefore, H1-1 is not supported.
Product Delivery Mistakes in Service Failure Severity. Model 5 indicates that product delivery mistakes in service failure severity do not have significant impact on the zone of tolerance to service failure (β = −0.065, p < 0.05). Nonetheless, Model 6 shows that the interactive effect between customer loyalty and product delivery mistakes in service failure severity is statistically significant (β = −0.193, p < 0.05). In order to further understand the interactive effect between customer loyalty and transaction frequency, we divided customer loyalty into high and low groups, produced a means contingency table, and rendered an interactive effect diagram. Figure 2 shows that for high severity of service failure in product delivery mistake, the relationship between customer loyalty and the zone of tolerance to service failure is weaker among those having low severity of service failure in product delivery mistake. Hence, H1-2 is supported.
Poor Attitude Service in Service Failure Severity. Model 5 shows that poor altitudinal service in service failure severity has a significant impact on the zone of tolerance to service failure, and appears in negative correlation (β = −0.500, p < 0.001). With regards to the moderating effect, Model 6 shows that the interactive effect between customer loyalty and poor service attitude in service failure severity is statistically significant (β = −0.203, p < 0.01). In order to further understand the interactive effect between customer loyalty and transaction frequency, we divided customer loyalty into high and low groups, produced a means contingency table, and rendered an interactive effect diagram. Figure 3 shows that for high severity of service failure in poor service attitude, the relationship between customer loyalty and the zone of tolerance to service failure is weaker than those having low severity of service failure in poor service attitude. Hence, H1-3 is supported.

Figure 2. Moderating chart of product delivery mistakes in service failure severity on the relationship between customer loyalty and zone of tolerance to service failure (ZTSF).

Figure 3. Moderating chart of poor attitudinal service on the relationship between customer loyalty and zone of tolerance to service failure (ZTSF).
5. Discussion and Conclusions
5.1. Discussion
Can loyal customers tolerate service failure in a business-to-business context? We found that customer loyalty is positive (0.185) but not significantly influence service failure tolerance. However, when two moderators were added, transaction frequency comes with moderating effects in which a higher monthly transaction frequency results in a greater zone of tolerance to service failure. This result reflects that Taiwanese hair salon industry will tolerate more service failures due to being familiar with the salespersons of the supplier firms. This result conclusion might be attributable to having 88% of the samples in this study as females. According to Kahle [29] and Tai [30], females prefer closer relationships with salespersons, thus placing great value on warm relationships with others. The zone of tolerance to service failure tolerance increases as a result.
We also found that loyal customers were less likely to tolerate service failure, in instances when service failure severity includes product delivery mistakes and poor service attitude. For the former, loyal customers lower their zone of tolerance to service failure in delivering the wrong products or equipment, because the products and equipment need to be ordered in advance for contingency use, and the wrong delivery of products and equipment by the supplier could result in the industry being unable to immediately provide services to consumers, while the wrong products delivered could not be used by the Industry. For the latter, poor service altitude could lower the correlation between customer loyalty and the zone of tolerance to service failure. Because the hair salon places high value on attitudinal service, the poor attitudes from suppliers can dissatisfy even those customers with high customer loyalty, thereby driving down the zone of tolerance to service failure. Interestingly, the moderating effect of the latter (0.203) (see Table 3) is higher than that of the former (0.193), meaning that the hair salon associates pay more attention to salespersons’ service attitude. It is because the more critical the service attribute, the narrower the zone of tolerance would be and vice versa [31].
5.2. Conclusions
Research indicates that the relationships between customers and service providers will influence customer response to service failure [32-34]. Our findings clearly show that two kinds of service failure have a negative impact on loyal customers; even prior positive experiences mitigate the effects of negative experiences of service failure [35]. Every customer holds a different zone of tolerance, and such tolerance is formed between the customer expectations of the service and the results of actual service received [17]. In addition to price, competition and specific services [16,31], the study found that transaction frequency and service failure severity also affect a customer’s zone of tolerance.
Three managerial implications are drawn from the findings. First, product suppliers should place more emphases on preventing service failure, such as on-the-job training and experience sharing, to reduce the dissatisfaction from the loyal customers of the industry. Second, suppliers can strengthen service attitudes and interpersonal relationships with female customers so as to increase tolerance of service failure. Third, increasing the transaction frequency within the industry can lead to loyal customers having a higher tolerance for service failure and less loss of trust in reaction to service failure.
5.3. Research Limitations
This study used non-random sampling due to time and budget limitations, resulting in a low quantity of sample collection. The 7-point scale questionnaires providing the variable measurement via personal subjective determination incurs probable deviation. Although the questions were developed from relevant theory, the zone of tolerance to service failure relations came only from prior analyses of service failure, possibly resulting in a less than optimal questionnaire design. Our study solely examined service failure severity and transaction frequency as moderating variables; adding other moderating variables into the discussion is suggested. Being limited to the hair salon industry in Taiwan, future research should study other regions and/or industries to obtain supporting or conflicting analyses.