Geospatial Modeling for Sinkholes Hazard Map Based on GIS & RS Data ()
1. Introduction
Urban development is rapidly occurring in the karstic terrain of the Kinta Valley, Malaysia. Sinkholes are an inherent feature of the landscape; they present hazards and engineering challenges to the development of infrastructure. Sinkhole hazard is common in limestone karst, associated with subcircular surface depression or collapse structure formed by the collapse of small subterranean karst cavities [1-3]. The annual sinkhole hazard potential in a given area may be estimated using Equation (1):
 (1)
(1)
where R is the potential hazard, expressed in terms of victims per year or financial losses per year; H is the hazard; E is the exposure or elements at potential hazard, referring to the population and the economic value of the properties and activities that may be affected by sinkholes; and V is the vulnerability, given by the unitary fraction of the exposure that is expected to be damaged if affected by a sinkhole. The total annual potential hazard corresponds to the sum of the estimated potential hazard for each exposed human element. Preferably, the hazard should include two components: the probability of sinkhole occurrence and the expected severity of the future sinkholes [4].
“Reference [5]” quantifies bedrock geology, depth to bedrock, sinkhole density, and distances to the nearest sinkhole in southeastern Minnesota but potential controlling factors such as structural control, topographic settings, human activities, and land-use are not yet built into the model. “Reference [6]” conducted a comparable study to produce a sinkhole density map of 385 sinkholes in the Forest City Quadrangle of Central Florida. This map was used to evaluate applications for sinkhole hazard prediction, and was further extended to construct sinkhole-risk models used in sinkhole risk assessment due to the lack of data coverage. “Reference [7]” studied the phenomena of sinkholes along the eastern part of the Dead Sea using 2D multi electrodes resistivity imagining that a lot of recent sinkholes were interpreted.
The environmental conditions most commonly thought to control sinkhole morphometry are the underlying geology, including bedrock, fractures and faults, soil depth to bedrock, and local hydrology [8,9]. There is a need to develop a more detailed karst map by identifying and ranking factors that control the morphometry of mapped sinkhole formations. Spatial technology has been used intensively to study and map aspects of karst areas. “Reference [10]” studied the environmental impact of sinkholes in Dead Sea area. “Reference [11]” constructed a sinkhole probability map based on various parameters such as sinkhole distribution, bedrock geology, depth to bedrock, and nearest-neighbor analysis. “Reference [12]” suggested that sinkhole clustering occurs because such zones had similar geologic and topographic characteristics favoring sinkholes formation. Various mapping techniques that had been applied to the study of landslides had been modified for the study of sinkhole development [13].
As a natural phenomenon, the occurrence of sinkhole is controlled basically by geological conditions, morphological conditions, land cover conditions, etc. The sinkhole susceptibility analysis can give a clue of the dangerous degree by site. In this context, space borne satellite images have been largely used in the environmental related studies [14-16]. Karst terrain is very difficult to map. Sinkholes are the most common karst features mapped because they are an indicator of bedrock dissolution, and they can be recognized on topographic maps or through remote sensing techniques [5]. “Reference [17]” located sinkholes through stereoscopic viewing of panchromatic aerial photography and plotted them on 1:24,000 scale topographic maps. “Reference [17]” primarily relied on these remote sensing techniques, but also performed some field check where sinkhole locations were questionable.
The use of a GIS permits the integration of the data from various sources and on different topics more accurately and faster than the traditional analytical methods. GIS applications enable researchers to objectively identify the conditions that trigger karst hazards. However, karst formations develop in very specific ways that are influenced by the unique local conditions of the area [18]. Local climate, geology, and urban development all affect the evolution of karst formations [19]. This study demonstrates the utility of computer visualization and geographic information system (GIS) software to develop a more detailed karst map for Kinta valley region to assist in future planning initiatives.
2. Study Area Location
The Kinta Valley is located approximately at latitude 4.60˚N, longitude 101.07˚E, lies to the west of the Main Range of the Peninsular Malaysia, and east of the Kledang Range, in the state of Perak, Malaysia (Figure 1). It is under laid by limestone of Devonian to Permian age. The topography reflects typical mature tropical karst with scattered steep-sided limestone hills protruding throughout the flat-lying valley. Only about 23% of the limestone occurs as hills, while the rest is an over laid by the alluvium [20]. Since it is sandwiched between two granitic highlands, so it provides 1) constant water supply, 2) lowland, scattered wet areas?, 3) swampy areas. Swampy areas are believed to be a factor of high rate of karstification.
3. Materials and Methodology Used
3.1. Data Collection and Analysis Concept
The data used in this study comprise of remotely sensed imageries and relevant ancillary data. The imageries acquired by SPOT 5 and LandSat 5 satellites over the study area, were collected from the Malaysian Centre for Remote Sensing (MACRES); Spot5 images on March 27, 2005 while LandSat 5 images in 2000. Aerial photography of the study area and its surrounding, acquired in 1981 and 2004, were collected from the Department of Survey and Mapping (JUPEM). The images provided information on karst surface features and facilitated the process of field investigations, especially when identifying surface features across large landscapes. Soil and land use maps (2000) of the study area were provided by the Department of Agriculture, Malaysia. The spatial data were geo-coded to conform to the Malaysian Rectified Skew Orthomorphic (RSO) projection and then converted to GIS format for multi-criteria analysis.
3.2. Data Pre-Processing
Prior to implementation of the automatic edge detection processing to map lineaments, SPOT 5 and Landsat TM data were enhanced and then geometrically corrected. Geometric errors were corrected using sensor characteristics and ephemeris data include scan skew, mirror-scan velocity variance, panoramic distortion, platform velocity, and perspective geometry. Visual screen digitizing of lineaments were done after performing proper image enhancements using the appropriate filters.
3.3. Image Enhancement
Image enhancement techniques were used to produce the

Figure 1. Location map of the study area.
best representation of the initial scene for clear visual presentation of the image and so improve its information content to the interpreter.
3.4. Lineament Visual Extraction
A reference map is required to validate the accuracy of the discontinuity map produced by automatic edge detection algorithms. In addition, to detect the non-geological lineaments such as roads with human eye [21]. Prior to image smoothing, the noise was eliminated by using an average low pass filter. Later, manual lineament extraction was performed. In this process, directional filtering method was applied for the lineament extraction. Directional nature method of Sobel kernels was applied on band 4 and this has generated an effective and faster way to evaluate lineaments in four principal directions [22].
3.5. Digital Terrain Model (DTM) Generation
DTM were derived using the SOCET TEM generation software from stereo-pairs of both Black-White and color scanned aerial photo. Image-matching techniques were used to locate conjugate points in the images and then determine the heights based on the image orientation data. The DTMs were generated for all areas of mining at a spatial resolution of 0.85 m. Given the reliability of the GCPs used, an accuracy of 99% in relative height differences in stereo models was achieved. Ortho-images were then generated from the orientated Black-White and colour images and the DTMs resampled at ground distance of 0.85 m to annotated grid spacing of 30 m as shown in Figure 2.
Once the TINs were created, their surface area characteristics were determined using ARC GIS 3D Analyst extension. The two first-order derivatives of elevation (slope measured in degrees, ranging from 0˚ to 90˚) and aspect measured in compass bearings, from 0˚ to 360˚ were easily calculated from the DTM in ArcGIS using the Spatial Analyst extension.
3.6. Geo-Hazard Map Generation Method
The production of sinkhole geohazard map requires summing the weightage of each hazard element. The preparation of the sinkhole geohazard map involved summing the weighted values for each hazard element, which permits the construction of: geohazard model. For this, the calculated and extracted factors were mapped into a 10 m × 10 m grid in ARC/INFO GRID format. Next, using the weights-of-evidence method, spatial relationships between the landslide location and each of the landslide-related factors, soil distribution, the trends of major faults, sinkhole density, lithology, distribution of ponds and streams, main roads and highways and the distribution of slopes were analyzed. These themes were rastrized into GIS environment and supplied with weighted average.
The spatial relationships were used as each factor’s rating in the overlay analysis. Subsequently, tests of conditional independence were performed for the selection of the factors to be used in landslide susceptibility mapping. The factors’ ratings were summed to calculate a sinkhole susceptibility index, and sinkhole susceptibility was mapped for 8 combinations of the factors. Finally, the results of a comparison of the 8 different combinations were validated using sinkhole test location data.

Figure 2. Typical grid point with XYZ generated from stereo-photo pairs.
The contributed factors and their influence coefficients of sinkhole occurrence are tabulated in Table 1. As following:
Geospatial data can be presented either in raster or vector form. We have chosen to develop the sinkhole geo-hazard model as a raster model, because they are easier to manipulate and process. The calculation and determination of the sinkhole hazard map depend on the geospatial data presentation model (raster or vector) of its factors. The difference of these factors data model requires unification. Between the raster model and vector model, the raster data model are easy to manipulate and process compared with vector models. Thus, the output data model of the sinkhole geohazard map. The calculation unit of the raster data model is pixel (P); where the pixel presents, in reality, a metric square. Each contributed hazard factor (F) is expressed in matrix of pixels that present the raster model of that factor. Depending on the number of the factors (n), the total contributed factors in geo-hazards map are ; for each pixel of the sinkhole geo-hazard map. However, the contributed factors have different influence. Thus, each factor Fn have a coefficient Cn that determine the influence level on sinkhole geo-hazard map. Therefore, the total contributed factors with it’s’ influence coefficients of sinkhole geohazard map for each pixel, (
 ) is expressed as follows:
 (2)
(2)
where P = final value of the pixel on the model;
Fn = value for that pixel of hazard factor n;
Cn = influence level coefficient associated with Fn.
Each hazard element is assigned a weight and the presence or absence of the hazard element within the cell determines if that weight is added to the sum (Figure 3). We utilized the Model Builder in ArcGIS (Figure 4) to house the model. While the weighted sums are calculated as floating point variables, they were binned into ranges when inserted into the model’s grid. These ranges represent ranks, and each rank is given an integer value. The higher values represent higher hazard levels. Each type of hazard will therefore have several rakes, depending on

Table 1. Weighting of controlling factors influence of hazard map.

Figure 3. Components of the sinkhole susceptibility method.
the specifics of that hazard type. For example, slopes are divided into four ranks; those with the lowest gradients have the value of “1”, and the highest gradients have the value “4”. The model was built by making criteria tree, where the conditioning parameter maps are grouped, standardized and weighted.
4. Results and Analysis
4.1. Geo-Hazard Map in the Kinta Valley
The most important factor of the geo-hazard map construction is the spatial distribution of sinkholes occurrence. Investigation on the history of sinkholes occurrence, urban development, faults distribution and ex mining ponds are factors that are directly responsible on all sinkholes and land subsidence hazards. Most of sinkholes concentrated on the northwest across the urban areas and west along the granite-limestone contact as well as the area further south of Kinta Valley as shown Figure 5. The waste chemical ponds of ex-mining, the main streams, the vibration and noise of high ways roads that cross the hazards area are the possible factors found to indicate the highest number of sinkholes occurrence.
Surface mining and sinkholes occurred in the past and will be developed in the future. The south and southwest of the study area is characterized by low slope rate varying from 0˚ to 10˚. This indicates slow ground water movement and probable low erosion (dissolution) in the limestone and more stability except in the locations of ex-mining.
Geological lineaments in terms of faults, joints and fractures, slope variation of limestone, sinkholes intensity, water table variation and urban distribution are significant parameters for the construction and the scoring of each location in geo-hazard map. The classification and the zoning of geo-hazard maps could be used as geotechnical reference for geologist and geotechnical engineers to identify the crucial location of high karst and dissolution rate as well as the buried sinkholes that could lead to unpredictable earth surface collapse.
Geo-hazard map has a vital role of sinkholes studies and management especially in area under laid of very sensitive carbonate rocks such as limestone and dolomite (Figure 5). In addition, it exposed to extreme high intensive urbanization and ex-mining activities. Figure 6 represents a geo-hazard model tool for sinkholes based

Figure 4. A GIS-geoprocessing model for geohazard sinkhole map.

Figure 5. The overlay of mining and urban areas to form a geo-hazard map for the Kinta Valley.
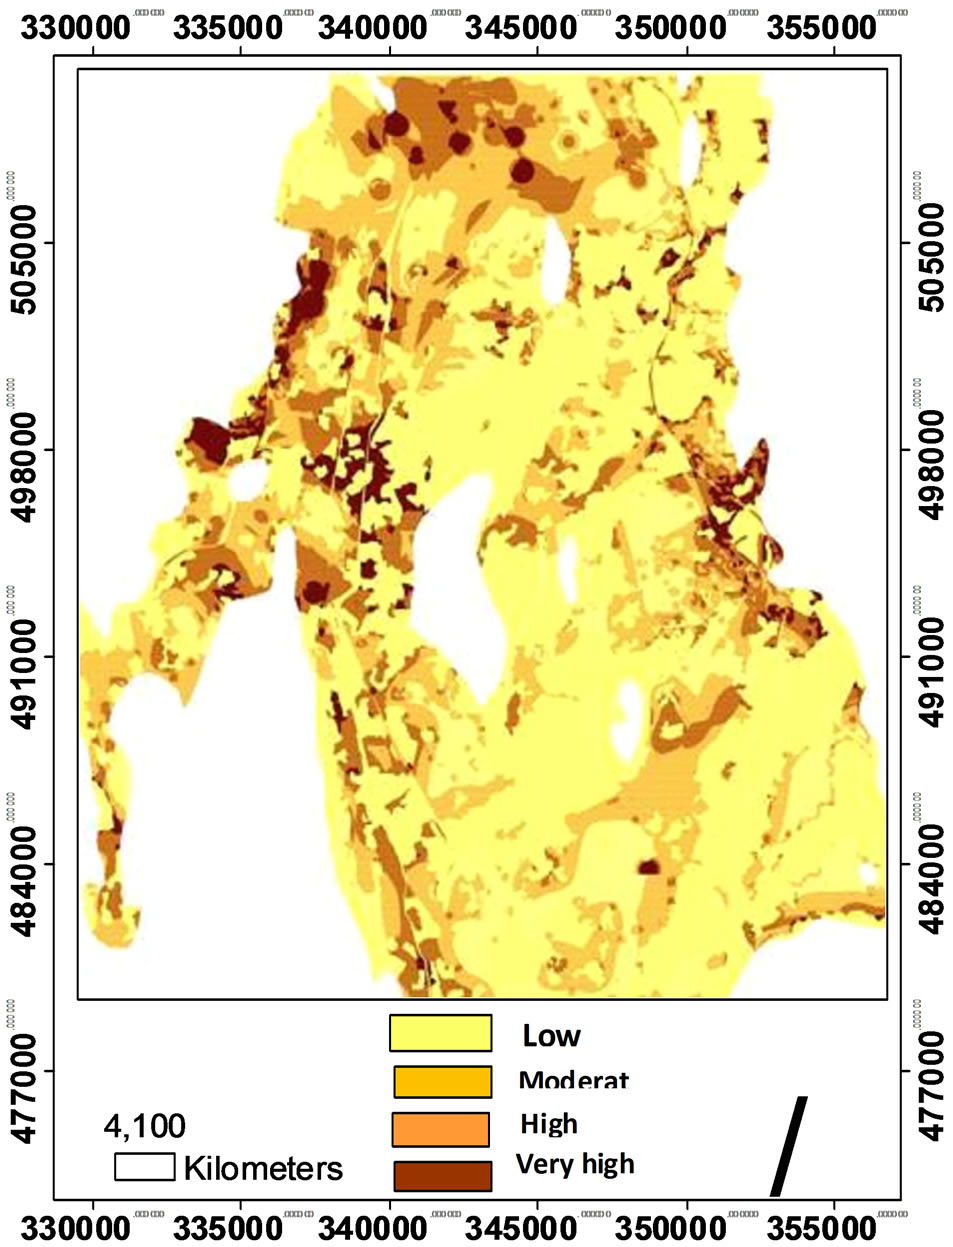
Figure 6. Geo-hazard map in the Kinta Valley.
on contributed factors and hazards densities maps. This map was classified into four categories:
4.1.1. Low Potential Hazard Areas
There is only one sinkhole observed on the map having low probability for sinkhole development. The low potential hazard areas characterized of low slope varying from 0˚ to 10˚, less of human, less streams, mining/exmining and agriculture activities. These areas actually extend from east to further south of Kinta Valley. One sinkhole recorded in these areas during last decades (Table 2).
4.1.2. Moderate Potential Hazard Areas
Containing only widely scattered individual sinkholes or isolated clusters of two or three sinkholes, these areas have moderate probability to sinkholes, earth subsidence/ collapse and even rock failure occurrence. These however, specified of low slope varies between 0˚ to 10˚, quite number of streams and moderate urban development distributed in the north such as Ipoh city and south. This class covers most of the study area of weighted average of sinkholes. These areas beside the low potential hazard areas could be recommended from authorities for further small buildings, planimetric elements and agriculture.
4.1.3. High Potential Hazard Area
The high potential hazard areas which include steep slope varies from 10˚ to 20˚, intense streams, high density fractures, high urbanization and ex mining activities as well as ponds and lakes distribution. These areas lie adjacent to granite ridges in the East-West and North of Kinta Valley. It shows many sinkholes and earth subsidence throughout the last two decades.
The high ways noise and vibrations in conjunction with streams/ponds distributions found to be responsible of Jeram Village sinkholes and local earthquake occurrence in the south east of Kinta Valley. Furthermore the location of the study area near to ring of fire along Sumatra has directly influenced the development and occurrence of sinkholes especially further south of Kinta Valley far from granite ridge protection.
4.1.4. Very High Potential Hazard Areas
The crucial sites within the study area are located in the North, North-East and North-West especially near granite ranges (limestone/granite contact) and high urban areas as well as the ex-mining areas in terms of ponds and lakes. In other words, Close to the very steep slope areas, the intersection of river and faults with ponds and urban areas are factors control most of the very high potential hazard areas of weighted average. An important number of sinkholes recorded and documented along high ways and industrial areas along the limestone-granite contact for example, Bukit Merah exposed to 21 sinkholes and earth surface subsidence during the period from 1981 to 1998. These types of areas must be categorized as restricted areas for new and long towers constructions.
4.2. Validation of the Geo-Hazard Maps
The accuracy of the hazard map was evaluated by comparing the hazard map extracted from the model with actual ground observations. The recorded Global Positioning Satellite (GPS) data was added to the hazard map to validate its accuracy. It was found that twenty (20) elements were located in their proper potential hazard class (Table 3).
To validate the model of potential hazard of sinkhole occurrence we inspected twenty one ground truths. Ten locations of the actual field observation are located within the high potential hazard areas, and seven locations are located within very high potential hazard areas. Figure 7 shows the resulting Geohazard Map and the locations of actual hazard based on sinkholes location in high and very high potential hazard areas. It can be concluded that the accuracy of the model is about 95% for the hazard area based on field observation location and report from The Malaysian Geological and Mineral Department. However, field observations, ground truths and geophysical data in Bukit Merah Village found that four locations of ground truth are located within very high potential hazard area (Figure 7).

Table 2. Percentage area of geo-hazard map classification.

Table 3. Location of ground truths observations in Kinta Valley.

Figure 7. Geohazard map validation in the Kinta Valley.
- 5. Conclusion
- Sinkholes are the most serious geological hazard in karst terrains. It is formed as a result of a sudden collapse of the overlying soil into a depression with steep to sub-vertical sides. Occasionally, a sinkhole is a funnel-shaped or bowl-shaped depression and sometimes it is circular. The size of a sinkhole may vary in diameter from as small as 1 m to as large as 30 m.
- The study area has abundant karst features, resulting from various factors such as rapid urban-industrial developments, ex-mining activities and intense rainfall on hilly areas.
- GIS and Remote Sensing were used to address information extraction, database establishment and model development.
- The use of GIS model facilitated these updates. Microsoft Access and GIS software were used to develop the database application tools for data input. This helps the creation of a hazard map based on sinkholes distribution and controlling factors.
- Geospatial technologies were found to be quantitative analysis of hazard map for sinkholes distribution with multi thematic layers compared to current method of sinkholes data organization based on papers, articles and reports, which were converted to digital format to be processed in GIS.
- Quantitative sinkhole hazard (probability) allows assessing the potential damage that may be caused by sinkholes hazard and performing cost-benefit analysis.
NOTES