The ~3.6 to 3.7 M Paucity in Global Earthquake Frequency: Potential Coupling to Zero Point Fluctuation Force and Quantum Energies ()
1. Introduction
In addition to the impacts from coronal mass ejections [1] that involve source energies in the order of 1025 Joules within a brief period, the most intense temporal increments of energy within local geophysical space are associated with seismic events. Although their life times are in the order of tens of seconds, the energy release ranges from 104 (M = 0.01) to 1018 (M = 9.0) Joules. Assuming the universal application of the central limit theorem which states that the mean of the total set of all subsets of random process should display dispersions of incidence around a central tendency that reflects a Gaussian (normal) distribution, one would predict a comparable pattern for the numbers of global earthquakes along the continuum of magnitudes. However, examination of all recorded global seismic events catalogued between January 2009 and September 2013 indicated a deviation from this prediction. In addition to a bimodal and positively skewed distribution of frequency as a function of magnitude, there was a conspicuous paucity of events from expected values that occurred within the range of 3 to 4 magnitude releases of energy.
This bimodal distribution of global seismicity was reported by Zielke and Arrowsmith [2] for a synthetic record of 540 kyrs containing ~900,000 earthquakes with rupture areas > 5 km2 or M ~ 4.5. The best fit equation for the magnitude-frequency distributions was a power law for M = 4.8 to 6.8 events with a second function to describe the event probability near M ~ 7.3. They attributed these patterns to the abrupt increase in width of the rupture at the transition between smaller and larger seismic events to the temperature dependence of the depth related changes in friction and decrease in coseismic stress. The distinction between the two populations occurred between 11 and 12 km or about half the depth for the Curie (temperature) point for iron. With greater global coverage and sensitivity of instrumentation, unusual distributions of even smaller magnitude events have been noted. Speidel and Mattson [3], who analyzed 10,341 earthquakes with magnitudes 2.0 to 8.2 from 1989 to 1991 revealed a conspicuous flattening of the increase in frequencies of earthquakes within a narrow interval (mean = M ~ 3.3; standard deviation = SD ~ 0.4) when the entire population between M 2 and M 8 was plotted. The other distribution anomalies were around M = 4.9 (SD = 0.5) and M = 7.1 (SD = 0.5), which was similar to the results of Zielke and Arrowsmith [2].
There is an alternative concept to potentially explain this divergence from the normal distribution curve and implicitly, assuming random occurrences, the Central Limit Theorem. We suggest the deviations from expectation for the frequency of this increment of energy reflects focal alterations in the physical-chemical features of Earth’s matter due to more fundamental and universal processes. The mass of the planet occupies space whose sub-matter (<10−16 m) structure has been considered to be multidimensional with mathematical connectivity to KaluzaKlein configurations [4] and physical coupling to gravity [5] and the Zero Point (Fluctuation) Force (ZPF) of the vacuum. As aptly stated by Puthoff [6] and Sakharov [7] gravity is not a separately manifesting fundamental force but an induced effect associated with ZPF within the structure of space (the “vacuum”). One type of expected vacuum quantum effect is the creation of particles from the vacuum condition [8]. If energy is transferred from an external field to vacuum oscillations, these “virtual particles” can emerge in macrospace as real increments of mass. Conversely, in a dynamic context where Newton’s Third Law, for every force there is an equal and opposite force, is operative, “real” particles could be immersed into their virtual representations. A similar concept was developed by Sir Arthur Eddington [9] during the early 20th century.
If the discrepancies between observed and expected frequency distributions of the release of energy by seismic events over the surface of the earth relate to quantum processes, then the wavelength of energy associated with the transition should reflect Planck’s length derived from:
 (1)
(1)
where G is the gravitational constant, h is Planck’s constant and c is the velocity of light, and, the Planck cutoff frequency of the ZPF spectrum, which is:
 (2)
(2)
where  is Planck’s reduced constant
  . This is 3.442 × 1043 Hz, and, is approaching the inverse of Planck’s time or, as frequency, 1.855 × 1043 Hz. Here, we present evidence of a remarkable convergence between the paucity of earthquakes within a specific band of magnitudes and the congruence of their equivalent wavelengths and quantum frequencies for both Planck’s length and the discontinuity frequency of the vacuum zeropoint-fluctuation.
2. Methods and Materials
All of the earthquakes recorded by USGS between 1 January 2009 and 31 August 2013 were obtained. There were a total of 483,906 events. Figure 1 shows the frequency of the 0.1 magnitude increments of different magnitude seismic events between 0 and 9. Because of the infrequency of events above 7, they were masked by the scaling that is dominated by less intense events. Figure 2 shows the amplification of the section of Figure 1 to reveal the sudden shift (increase) in frequencies of seismic events between 3.9 and 4 M. The trough interval was between 3.6 and 3.9 M which is congruent with the interval observed by Speidel and Mattson [3].
3. Results
To discern a more precise range for the diminishment of the expected frequency, successive increments of 0.1 M were plotted. The results are shown in Figure 2. Note the bimodal distribution and the sudden increase between 3.9 and 4.0. The diminishing steps of frequency of occurrence occur between 3.6 and 3.7 M.
In order to relate the radiated energy associated with each magnitude, we employed the Gutenberg-Richter Relation:  . The related photon wavelength (λ) was obtained from the Planck relation of:
  . The equivalent frequency was obtained by dividing the velocity of light, c, in a vacuum (~3.0 × 10⁸ m/s). The results are shown in Table 1 for the range of
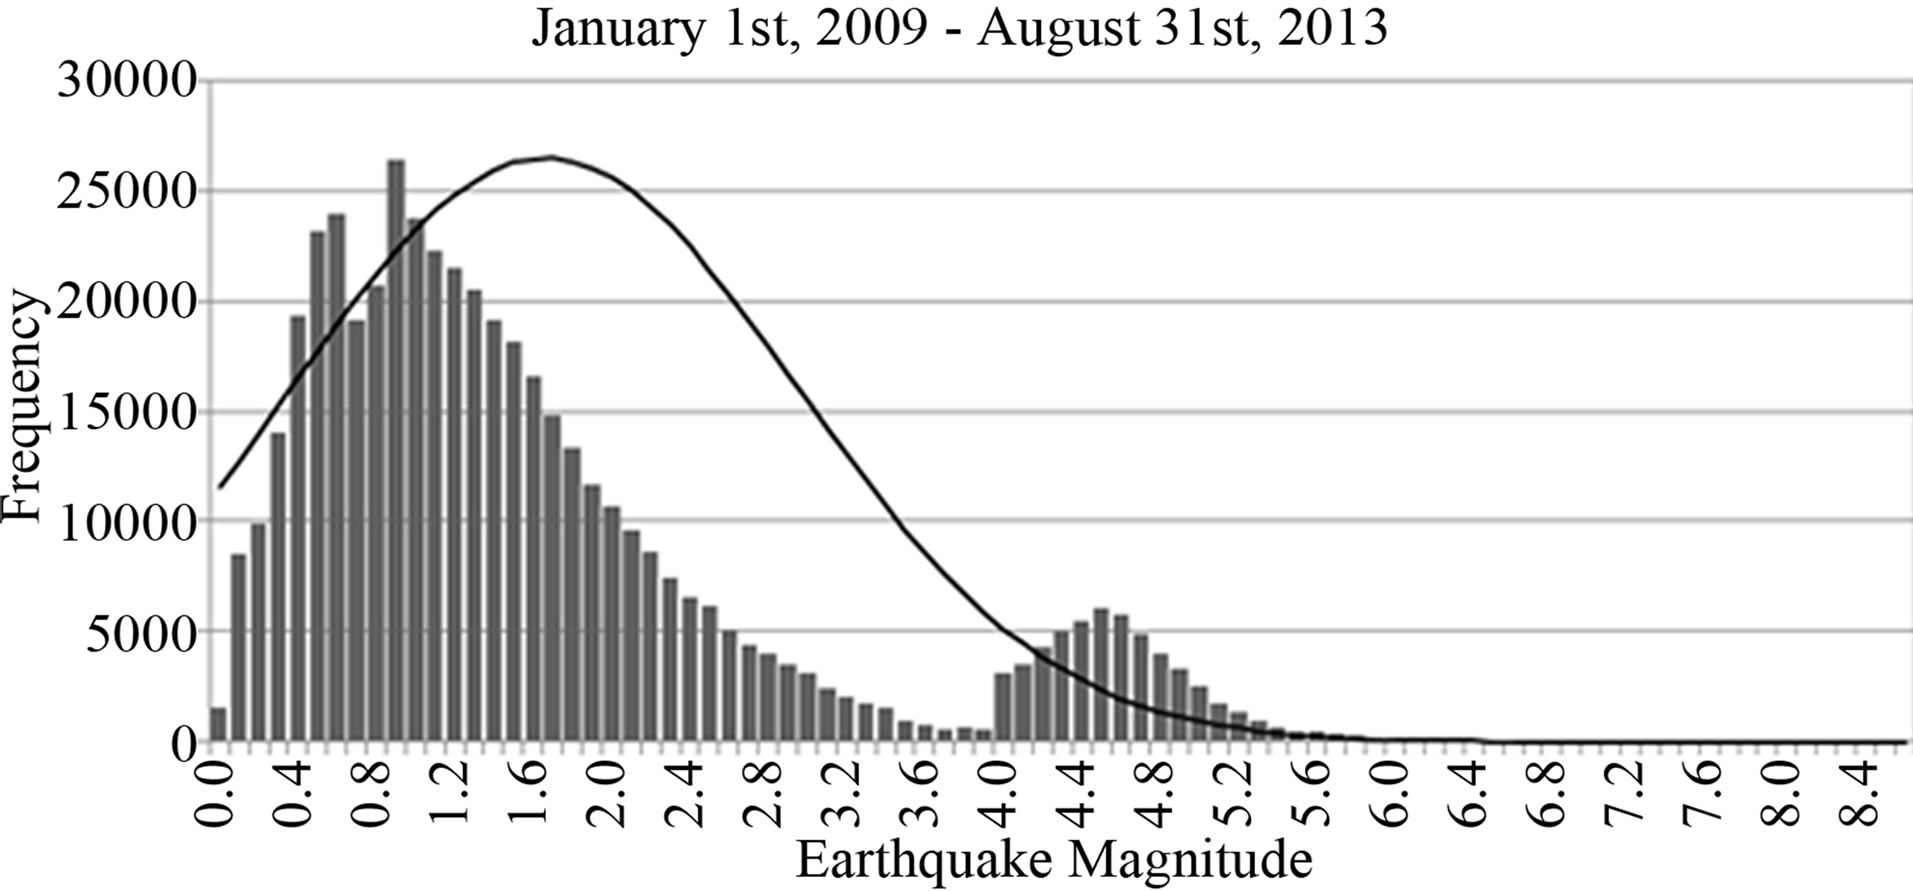
Figure 1. Total numbers of global earthquakes between January 2009 and August 2013 as a function of increments of magnitude between 0 and 9. The numbers of events above 7 are so infrequent they are masked by the scale.
magnitudes with particular emphasis on the magnitudes associated with the inflection threshold between 3.5 and 4.0 M. The equivalent photon λ at ~3.6 M is remarkably similar to the 1.616 × 10⁻³⁵ m values for Planck’s length.
4. Discussion and Implications
If the discrepancy in expected frequency of magnitudes of earthquakes with energetic equivalences approaches the wavelengths associated with the structure of spacetime, then the source of these seismic phenomena could reflect their more cosmological connections. For example, the approximate 10- to 11-year cycle in global seismicity has been known for almost a century [10]. Several correlational studies have demonstrated, employing annual increments of analyses, coefficients of ~0.4 to 0.5 between the global release of seismic energy and solar activity within the 10- to 11-year cycle [11]. Movement of the Sun around the barycenter of the solar system, as inferred by the absolute value in the change of the Sun’s acceleration with time, was correlated 0.45 with the amount of seismic energy released from deep (>60 km)
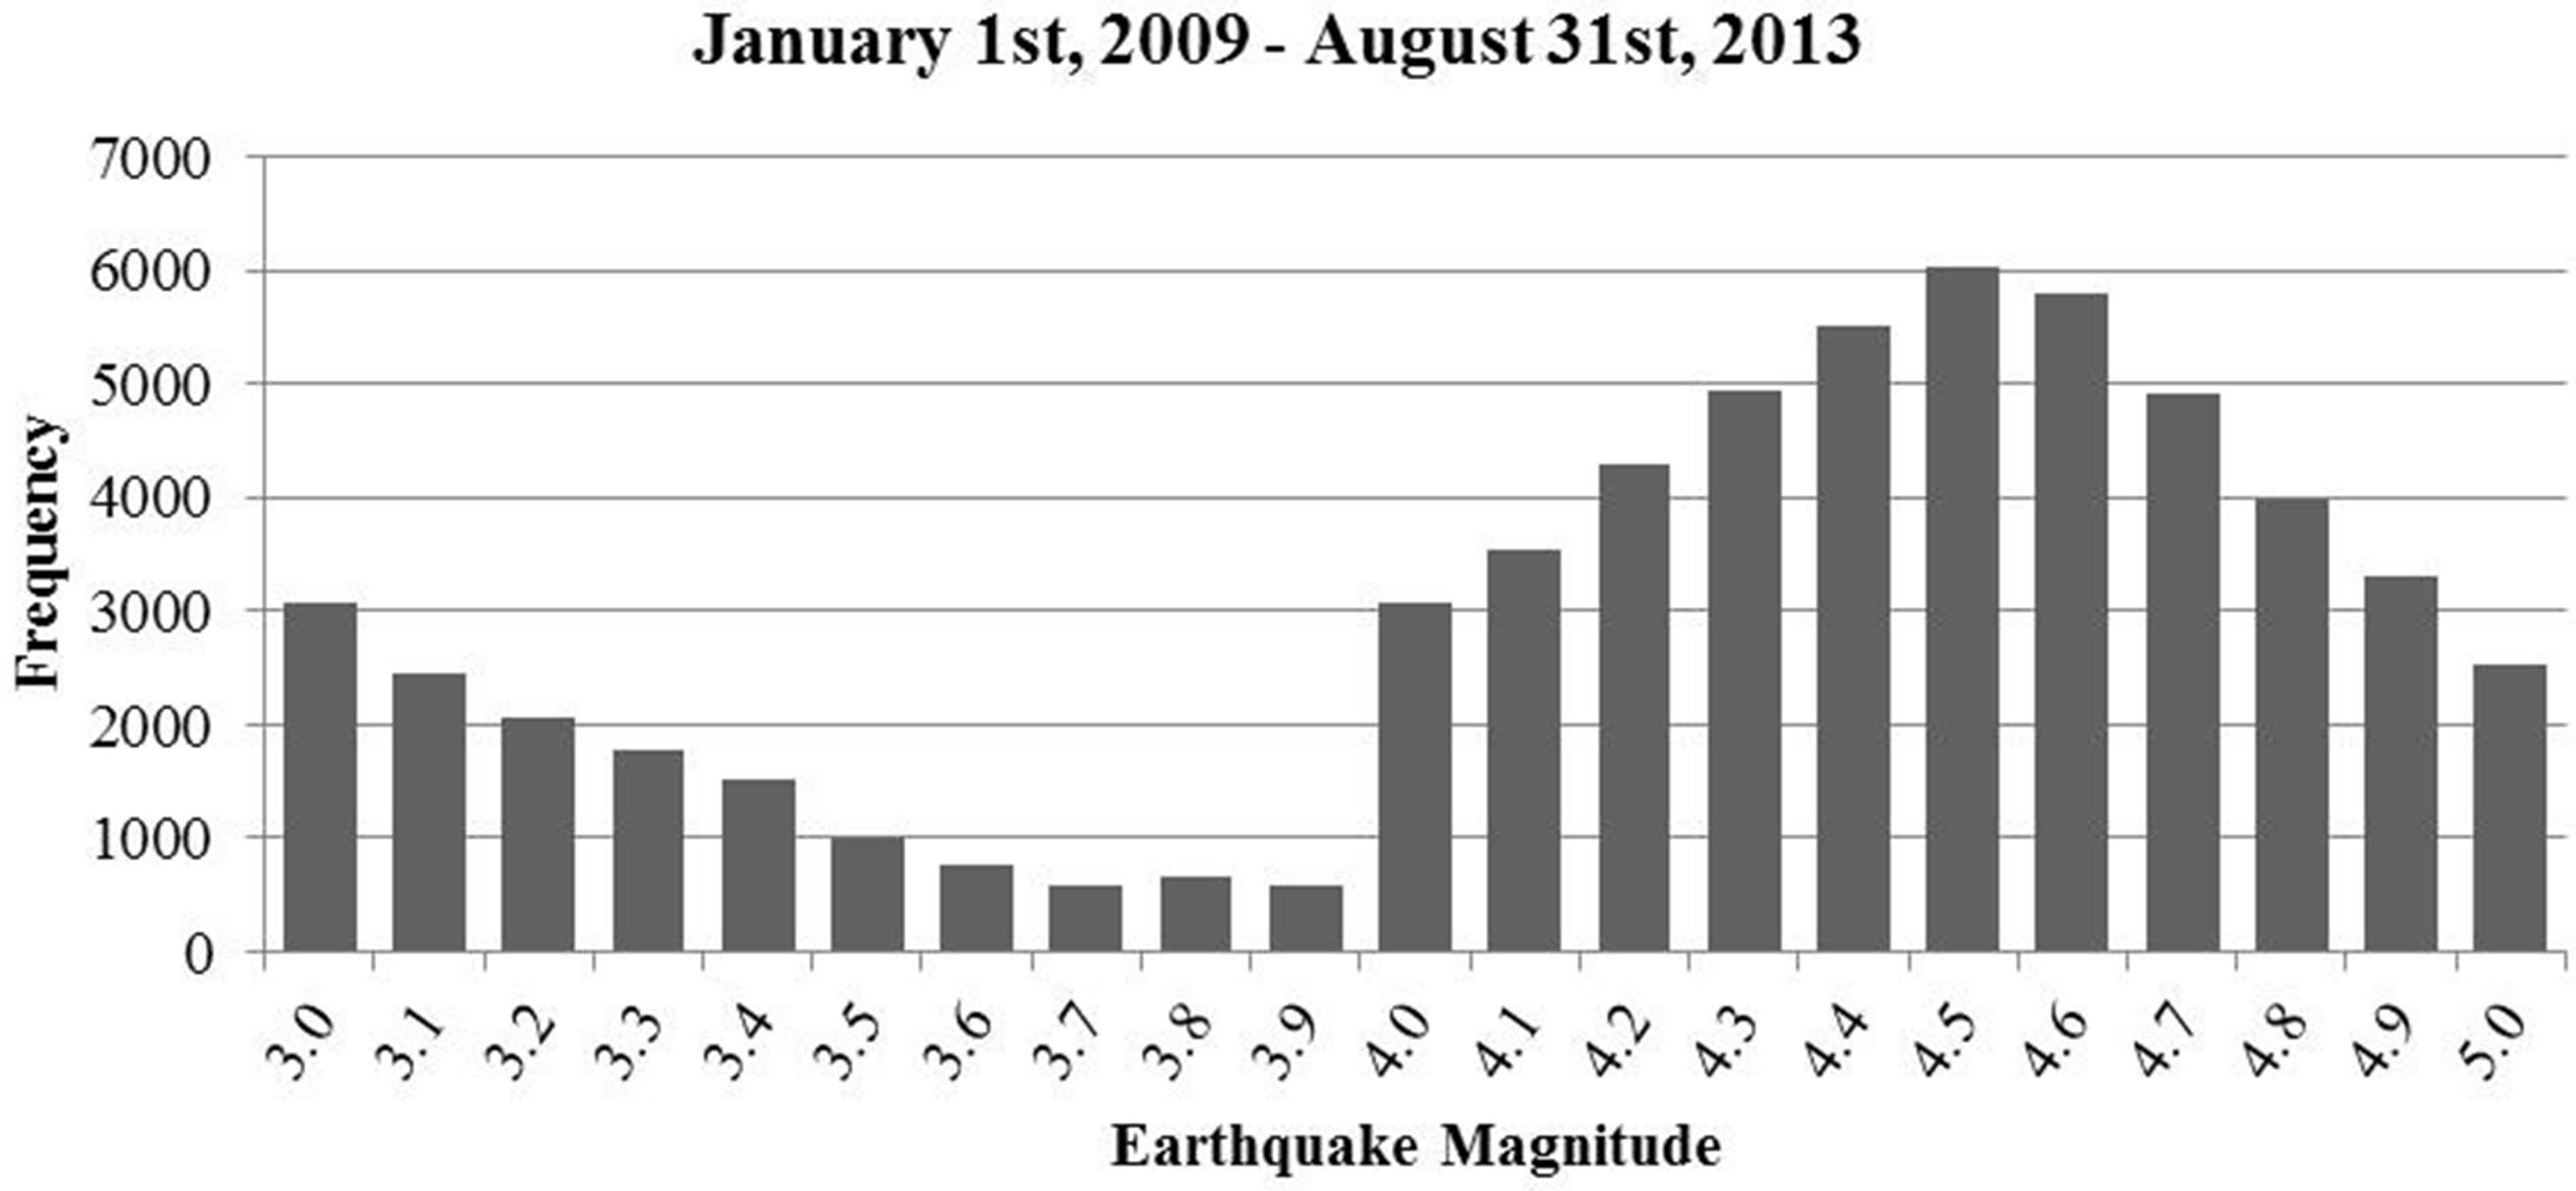
Figure 2. Amplification of the numbers of seismic events as a function of 0.1 increments of magnitude before the inflection between 3.9 and 4.
but not shallow earthquakes [12]. That planetary positions, which could potentially affect the barycenter and produce secondary electromagnetic atmospheric effects (shortwave signal quality) had been known since Nelson’s classic 1952 publication [10] and was recently elucidated with more rigorous mathematical and quantitative analyses by Abreu et al. [13].
The temporal direction between seismic events and solar activity, although evident with analysis increments of months or years, is less clear when daily increments are employed. Sytinskij’s [14] powerful analyses of global seismicity and solar activity reiterated their large scale associations. Although the intuitive explanation was that the solar activity produced the conditions for seismic events through accelerated velocity and density of the solar wind, Sytinskij found that earthquakes preceded geomagnetic activity by 1 or 2 days. This relationship would be more consistent with a change within the shared Planck space-time and intrinsically gravitational associated zero point fluctuation force transiently occupied by the solar system as it moves through the galaxy.
From this perspective, the temporally discrepant elicitations of the terrestrial and solar releases of energy simply reflect their differential latencies to this third factor. There are new approaches to consider the effective coupling of gravity to matter [15] and sufficient mathematical models that could test the predictions of topological transitions and large-scale space-time structure for those multidimensional theories of gravity [4,5]. The existence of this connection could also accommodate some of the anomalies, namely the “stochastic fluctuations” of the dynamo driving parameters for the coupling between the minimum-maximum of the Sun’s activity and the meanfield dynamo [16].
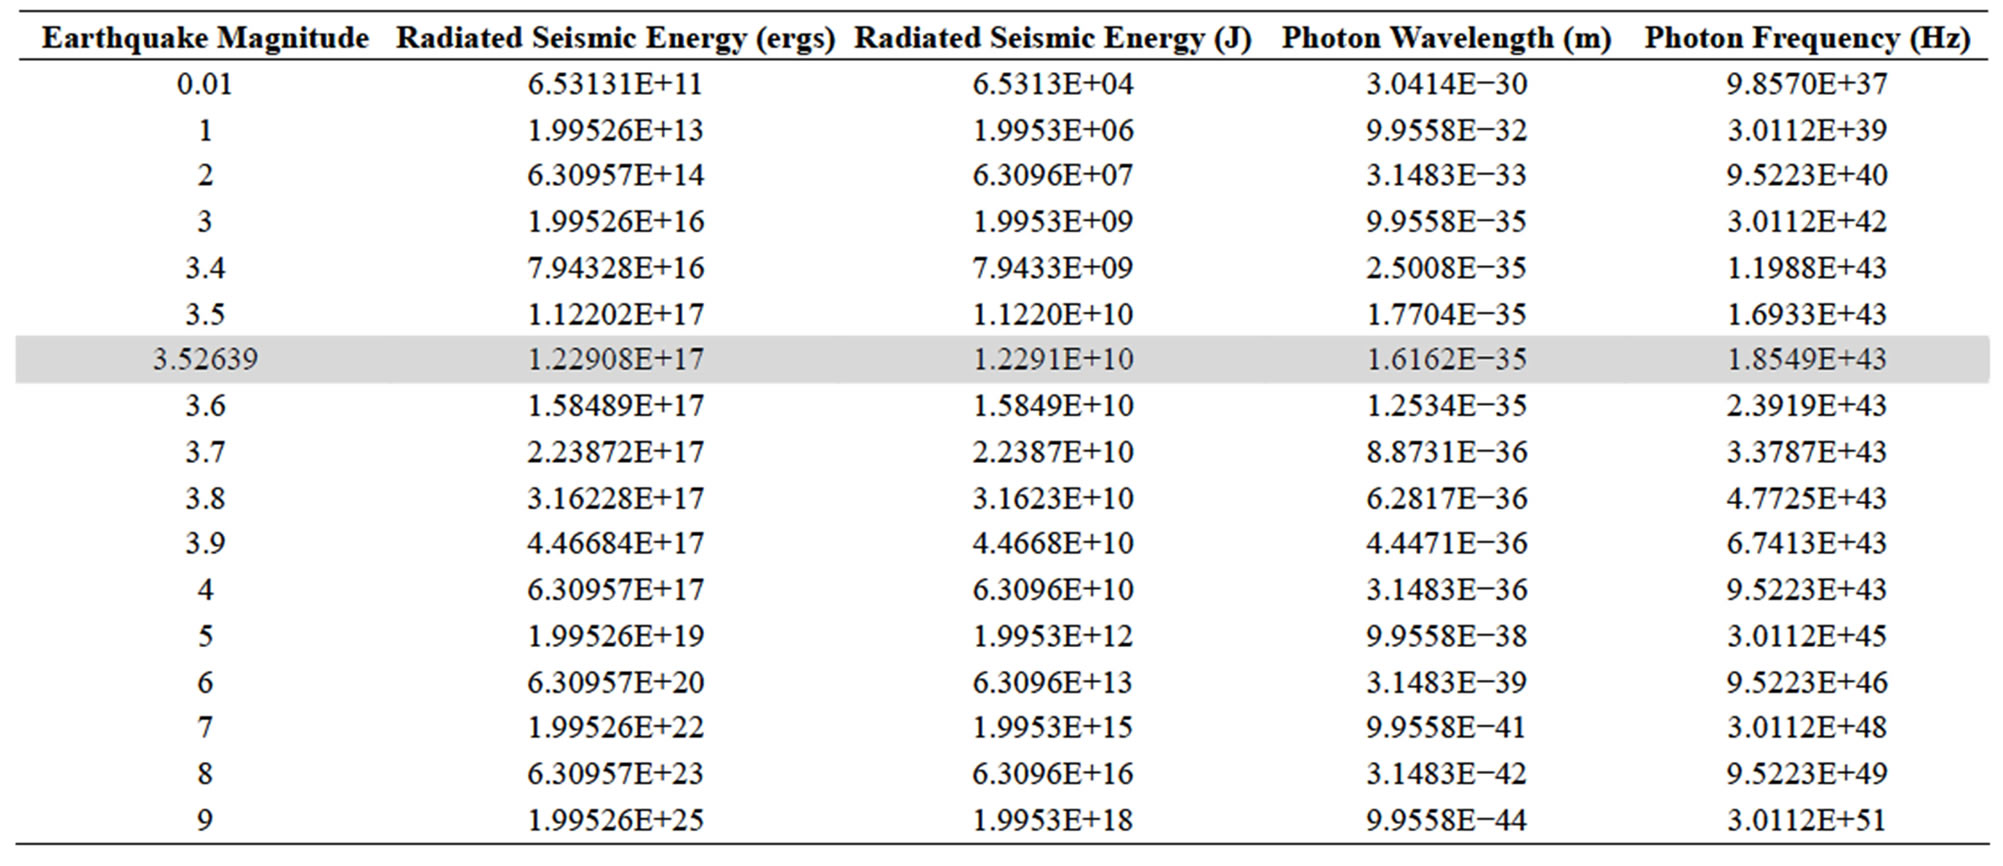
Table 1. Calculations for measures of energy, photon wavelength and frequency for various magnitude equivalents of earthquakes.
There may be direct application for this explanation for the M = 3.5 window. Main [17] reported two classes of earthquakes that preceded the explosive eruption of Mt. St. Helens on 18 May 1990. One class displayed a normal distribution of M = 4.6. The second group displayed a peak about M = 3.4, which was considered a probationary transition between being valid and an artifact of incomplete reporting. Preceding the Mt. St. Helens volcanic eruption, Derr and Persinger [18] showed a strong temporal and spatial correlation between the occurrence of unusual luminous phenomena within the area of the Satus Peak fault zone and the inferred movement of tectonic strain associated with the later occurrence of this magnitude range of earthquakes. Interestingly, many of the historical observations of atypical pre-earthquake luminosities preceded regional smaller earthquakes with magnitudes in this range [19]. The involvement of Planck space-time processes could alter the interpretation of these anomalous phenomena.
Main’s explanation [17] was the bimodal peaks which were the superimposition of “tectonic” events and volcanic tremor. From the perspective of our model, if the source of the energy producing the magnitude increment is coupled to ZPF-related processes, the reversal of frequency, that is an increase in numbers of quakes, would suggest that there has been a reversal of the transformational process. Energy from the ZPF sources could then create the conditions for this magnitude band of quakes and produce this mass shift in the organization of matter. Recently, Alexeevich et al. [20] have also pursued the hypothesis for the connection between seismicity of the Earth with fluctuations in the structure of physical (vacuum) space. If fundamental forces that involve gravity and the structure of space at Planck’s levels are associated with the incidence rates of the narrow band of earthquake magnitudes reported here, one would expect a conspicuous connection with changes in photon emission densities [21]. Interestingly, for at least two recent M > 8.0 earthquakes (Chile and Japan) several thousands of km away, we have measured marked increases in typical photon emission flux densities (~5 × 10⁻¹¹ W/m2) from the ground, by between a factor of 10 to 50 times, about two weeks before those seismic events [22].