Development of a Generic Model for the Detection of Roof Materials Based on an Object-Based Approach Using WorldView-2 Satellite Imagery ()
1. Introduction
Almost half of the world’s population lives in urban areas [1]. Over the last few decades, urban areas have grown rapidly, although cities occupy only a very small portion of the Earth’s total land surface. Urban areas are characterized by a large variety of artificial and natural surface materials that influence ecological [2,3], climatic and energy [4,5] conditions. One of the most important land cover types is IS that affects urban surface temperature [6-8] and runoff quality [9-11]. Detection and assessment of the percentage of IS in the heterogeneous urban area is one of the challenging and important tasks in urban remote sensing. Due to the impact of IS on the environment, the concentration on this field of study has been growing [12-15].
In this study, detection of the IS especially the roof of buildings based on their materials using multispectral remote sensing data is proposed. Detection of the roof types and conditions is important; knowledge on roof material types can assist applications such as disaster preparedness [16] solar photovoltaic energy modeling [17] UHI assessment [18-20] and runoff quality [11]. However, accurate IS extraction is still a challenge with existing and traditional methods. Due to the rapid expansion of cities, and with advent of new satellite sensors, the new methods with up-to-date information about the cities are needed because traditional methods are time-consuming, laborious and expensive [21]. Thus mapping activities often cannot keep up with the pace of urban development. To classify the heterogeneity of urban land cover at the parcel level, Very-High-Resolution (VHR) imagery is needed [22]. For the supervised classification of IS at the materials level, such as roof materials, adequate training data are needed. However, due to building security, permission to access roofs may be denied or access may be impossible. Several studies have been performed to illustrate the potential of hyperspectral data for discriminating urban surface materials [18,23-28]. High-spectral-resolution sensors are able to detect, classify, and discriminate materials on the earth better than traditional multispectral imagery that only uses a few wide-band spectral channels [29].
Urban hyperspectral mapping is currently limited to airborne data, despite the availability of spacebornehyperspectral systems [30]. Airborne data acquisition is normally expensive. Additionally, the coverage area is limited, and the analysis can be too complex compared to multispectral imagery. In this study unlike other commercial sensors, WorldView-2 (WV-2) that contains 8 spectral bands with high spatial resolution (0.5 m pan sharpened) was employed. Some studies used Landsat or SPOT images, but these images are not recommended for urban study because of their low spatial resolution. It should be mentioned that although VHR imagery provides more information about an object, once the spatial resolution increases, discrimination between classes is reduced because of the increased internal variability of the objects [31,32]. Some studies have used VHR satellite images such as Ikonos or QuickBird, but they are relatively limited in their spectral resolution, thus there are specific limitations in the separation of built-up and non-built-up materials [33].
Studies show that traditional methods such as maximum likelihood (ML) and parallelepiped are inadequate for classifying very-high-resolution multispectral imagery in urban areas [31,34-37]. Recent research shows that using only spectral information is insufficient for classifying IS in detail because of the spectral similarity between different materials in urban areas [38]. It is very important to add other sources of information, such as the spatial information inherent in images [36,39-41], and textural information, which can improve the classification accuracy. With the aim of extracting and integrating spatial, spectral and textural information, the object-based (OB) approach is used. Studies show that such information can be used to increase the discrimination between spectrally similar urban land cover types [37,40-42]. The OB classification approaches, in general, show better results compared to pixel-based approaches when mapping individual landscape features [43]. Nevertheless, to define objects in terms of certain rules based on extracted information, a priori knowledge is needed. Generally, the relevant information is not well formalized, and it is difficult to directly obtain such implicit knowledge, which is ordinarily held only by domain experts [44]. Previous studies such as [45] have defined the optimal rule sets for a limited coverage urban area but the rules are not transferable and generic for other different areas.
The main goal of this research is to build a generic and transferable model based on the spectral, spatial and texture information through the available training data in order to map the spatial distribution of roof materials by using WV-2 satellite image to overcome the limitations in the urban remote sensing context as mentioned such as the airborne hyperspectral data, inadequate training data and lack of the generic and transferable model to detect the IS at materials level. Furthermore, this generic model is used to predict the roof materials in different parts of new study areas without using new training data to evaluate the transferability of this model. Discriminate analysis (DA) utilizes an equation that minimizes the possibility of misclassifying cases into their respective groups or categories. The purpose of using DA is to investigate differences between groups on the basis of the attributes of the cases, indicating which attributes contribute most to group separation.
2. Methods
2.1. Data Acquisition
Pan-sharpened WV-2 images with a 0.5 meter spatial resolution with 8 spectral bands were employed as shown in Figure 1. The study areas were located in the Klang Valley, which is an area in Malaysia comprising Kuala Lumpur (KL) and its suburbs and adjoining cities and towns in the state of Selangor. Two different WV-2 images in terms of data collection time and areas were selected which depict parts of the city of KL and the Universiti Putra Malaysia (UPM). The standard radiometric, geometric and sensor corrections have been applied to the raw imagery by the image supplier.
2.2. Classification
Based on the WV-2 image of KL area the field survey has been conducted and 7 classes were defined. Four classes are related to the different roof materials which are widely used in Malaysia such as metal, asbestos, concrete and clay tile. The other classes are related to the vegetation, tarmac and shadow. To classify the KL image two different classification approaches were employed. First the ML classification which is based on the spectral information and subsequent based on generic model which were extracted based on the OB approach.
ML classifier assumes the normal distribution in each band for each class and the probability of the training
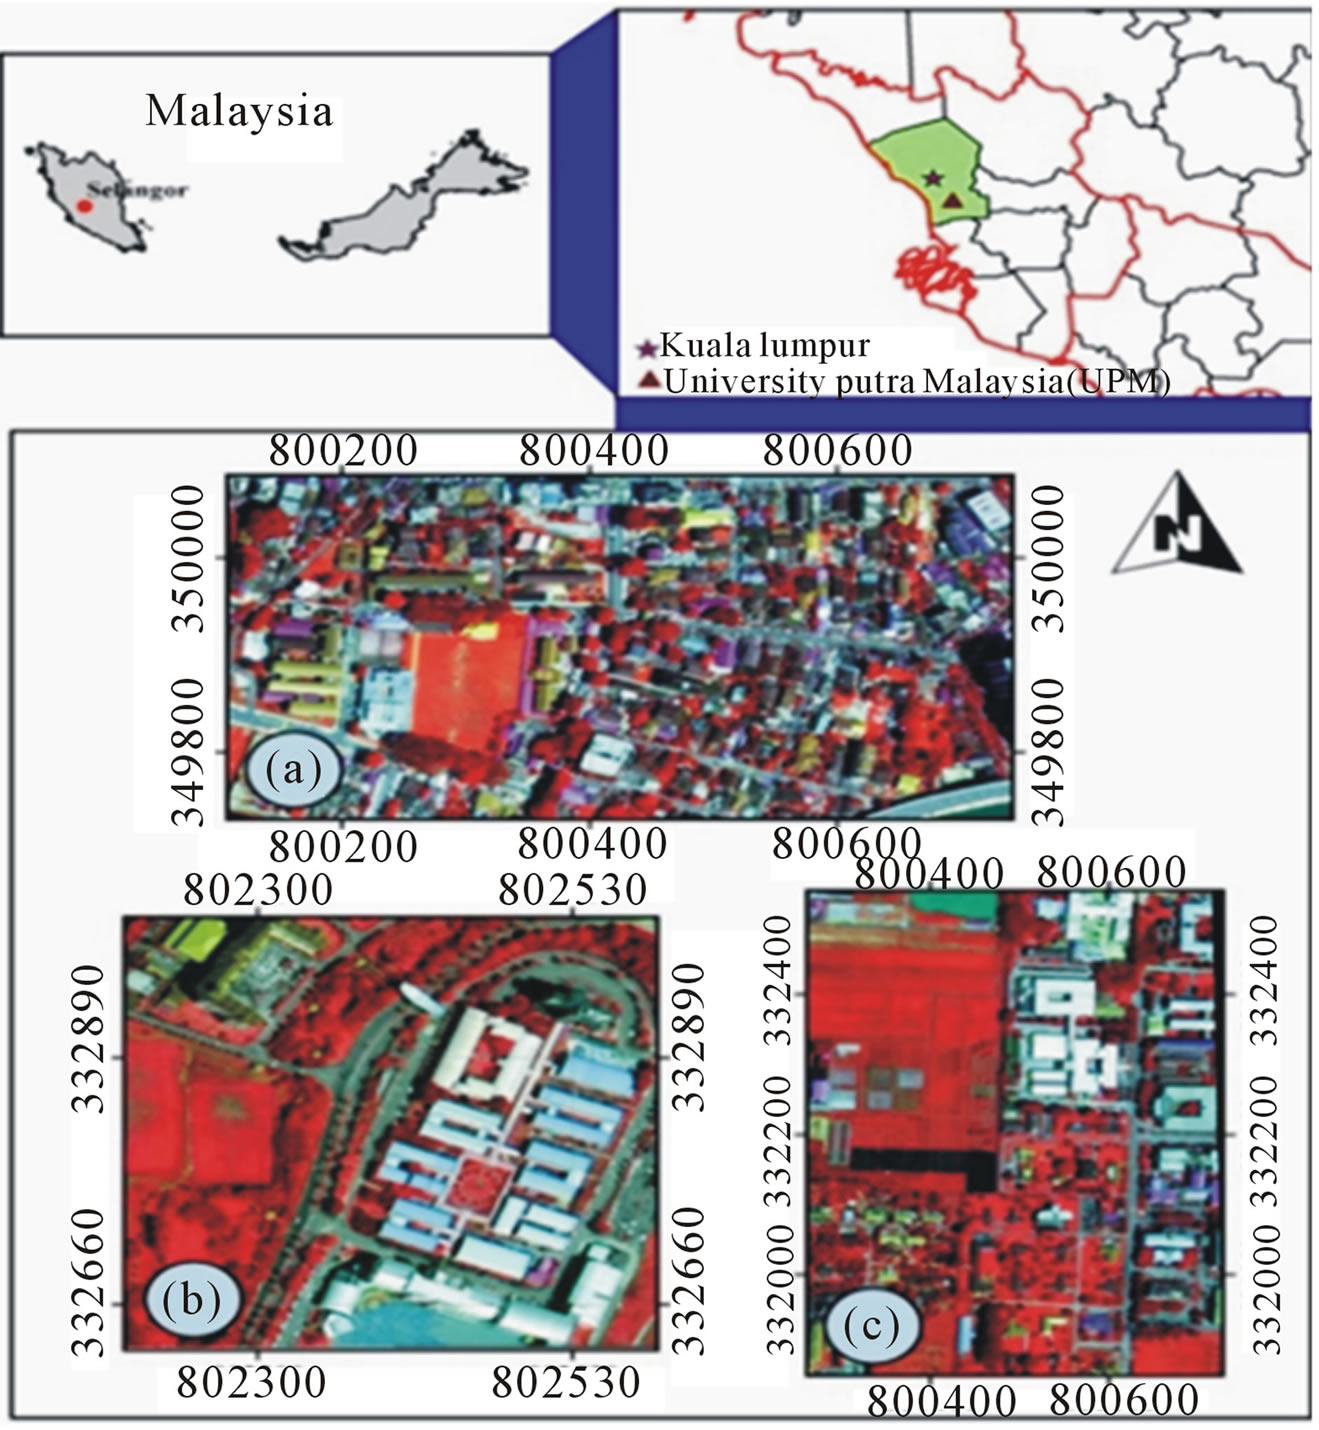
Figure 1. The locations and images of the study areas A) WV-2 image of part of KL; B, C) WV-2 images of parts of the Universiti Putra Malaysia (UPM)-UPM_Eng and UPM_ Itma respectively.
data pixel belongs to a specific class is calculated. The standard deviation and mean are employed that are derived from the training pixels. Theoretically, it is the best classifier but there is some limitation in this classifier such as an assumption of normal distribution of the spectral data within the training classes.
2.3. Object-Based Image Analysis Approach
To improve the classification accuracy and better discriminate between spectrally similar urban land cover types, the spectral information was combined with other sources of information inherent in VHR imagery, such as spatial and textural information. With the advent of high-resolution satellite imagery and the emergence of commercial software, object-based image analysis has been increasingly used [37,46,47]. In order to use the OB approach the feature extraction module which is available in ENVI Ex software was employed. The methodology conducted in this research in order to extract the model can be presented by the flowchart as shown in Figure 2.
2.3.1. Image Segmentation and Merging
The most crucial task in the OB classification approach is segmentation. Image segmentation is a process that partitions raster images into homogenous regions based on pixel values and location [48,49]. Pixels with similar spectral values that are spatially connected are grouped

Figure 2. Flowchart of methodology to extract the model.
into a single segment. There are different segmentation techniques based on pixel, edge and region methods [48], and these techniques have been applied in different studies [50]. To employ the OB approach and segmentation in this study, the feature extraction module of the ENVI 4.7 software package was used. There is a segmentation algorithm available in ENVI EX that is based on an edge that is very fast and only requires one input parameter.
Merging is an optional step used to aggregate small segments within larger segments. The merge level parameter in the ENVI EX feature extraction dialog represents the threshold lambda value, which ranges from 0.0 to 100. It is ideal to choose the highest merge level that delineates the boundaries of features as well as possible. Both scale level and merge level were selected manually, at 20 and 80, respectively, to detect building roofs.
2.3.2. Computing the Attribute
One of the valuable information inherent in the VHR is spatial information. Thus 14 spatial attributes were extracted from the image such compact, convexity, solidity, roundness, Formfactor, Elongation, Rec_fit, Maindir, Majaxislen, Minaxislen, Numholes, Holesolrat, Area and Length attributes which were calculated based on smoothed version of the geometry. Performing calculations on a smoothed geometry ensures the shape measurements are less sensitive to object rotation. The essential information to classify the remote sensing data is spectral information. Thus four spectral attributes were extracted for each spectral band of WV-2 image based on the OB approach as shown in Table 1.
Another source of information inherent in the VHR is textural information. Four attributes which are related to the textual information were extracted from the WV-2 image. Table 2 shows the definition of textural attributes.
In the computation of attributes step, the color infor-

Table 1. Spectral attributes definition which is extracted for each band.

Table 2. Textural attribute definition which is extracted from the image.
mation such as hue, saturation, and intensity (HSI) attributes and furthermore a band ratio attributes were employed. Access to each attributes variables of each segment in ENVI software is a very difficult task. Thus to overcome this limitation in order to access the each segment’s variables which were based on spatial, spectral and texture attributes the segmented image was exported to the vector layer with their attributes. Thus to access the each attribute variables of each segment the ArcGIS software was used.
2.3.3. Class Definition and Training Sample
A ground-truth image was created based on the field survey and 7 classes were defined (highlighted) on the segmentation map. In order to access the attribute’s variable of each class which was defined the attribute table of ArcGIS software was used. The attribute’s table allows us to access each segment’s attribute variables in terms of; each row in the table demonstrates the attribute variable for each segment. Subsequently the variable of all extracted attribute which were selected on the segment image (training data) was exported to separate file.
2.3.4. Discriminant Analysis
One of the challenging tasks in image processing is finding the useful and powerful method to best discriminate between some classes that are similar in spectral signature. The purpose of using DA is to investigate the differences between groups based on the attributes of each class, and explore the most significant attributes that contribute to separation of classes and finally create the generic predictive model which minimize the possibility of misclassifying case into the respective group based on the available training data to predict the roof materials. In this study the multiple-DA through the SPSS software was used. The stepwise method was applied as an exploratory approach to DA and useful method to find the best set of predictors based on the strength of their relationship with the attribute’s variable and subsequently enters them into the predictive model. In stepwise DA, the most correlated independent variable is entered first by the stepwise program, and then the second one is added, and so on, until an additional dependent adds no significance [51]. Wilks’ lambda selection method was chosen as a variable selection method for stepwise DA. Wilks’ λ or U statistic is the ratio of the within-group sum of squares to the total sum of square for each predictor. The value of λ is between 0 and 1 in which the large values of near 1 indicate that the group means do not seem to be different and inversely the small values of indicate that the group means seem to be different.
The predicative model is composed of a discriminant function based on linear combinations of the predictor variables that provide the best discrimination between the groups. The mean values for the discriminant scores for a particular class refer to the centroids. Basically based on the number of class and number of functions, there are centriod. The class centriod is useful for indication of the location of an individual for a specific class. Discriminant function analysis undertakes the same task as multiple linear regression analysis by predicting an outcome. DA involves the determination of a linear equation, as in regression, that will predict the group to which the case belongs. The form of the equation or function is
 (1)
(1)
where:
D = discriminate function V = the discriminant coefficient or weight for that attribute X = attribute’s variable a = a constant i = the number of predictor variables
2.3.5. Minimum Distance Classifier (Euclidian Distance)
In order to assign the class of each segment based on the different functions which were extracted, the Euclidian distance was used to measure the distance between different classes. The minimum distance between the different classes were assigned to the related class.
2.4. Validation and Accuracy Assessment
As mentioned all the training data were extracted from different parts of the KL image, thus in order to validate the model, it was applied to different areas of the WV-2 image from UPM that was captured in different time. Generally, classification accuracy refers to the extent of correspondence between the remotely sensed data and reference information. In order to assess the accuracy of spatial distribution of roof materials extracted from the WV-2 image by different classification approaches, the testing data which are provided based on the field survey were used and the results were recorded in a confusion matrix. A non-parametric Kappa test was also used to measure the classification accuracy.
3. Result and Discussion
3.1. Class Definition and Training Sample
The ground-truth image was created based on the field survey. All the training data used to train the model are related to the different parts of the KL image, although the testing data were collected from the KL and UPM images. As mentioned previously, this study focuses on the detection of roof materials, so the testing data are related only to the different roof types. Furthermore, the number of segments was used for the training data, and the number of pixels was used for the testing data as shown in Table 3.
3.2. Spectral-Based Classification
In order to evaluate the potential of different classification methods to extract the roof materials the supervised classifications such as ML classifier method was applied on WV-2 image from the KL image. Figure 3 shows the classification result using the ML classifier.
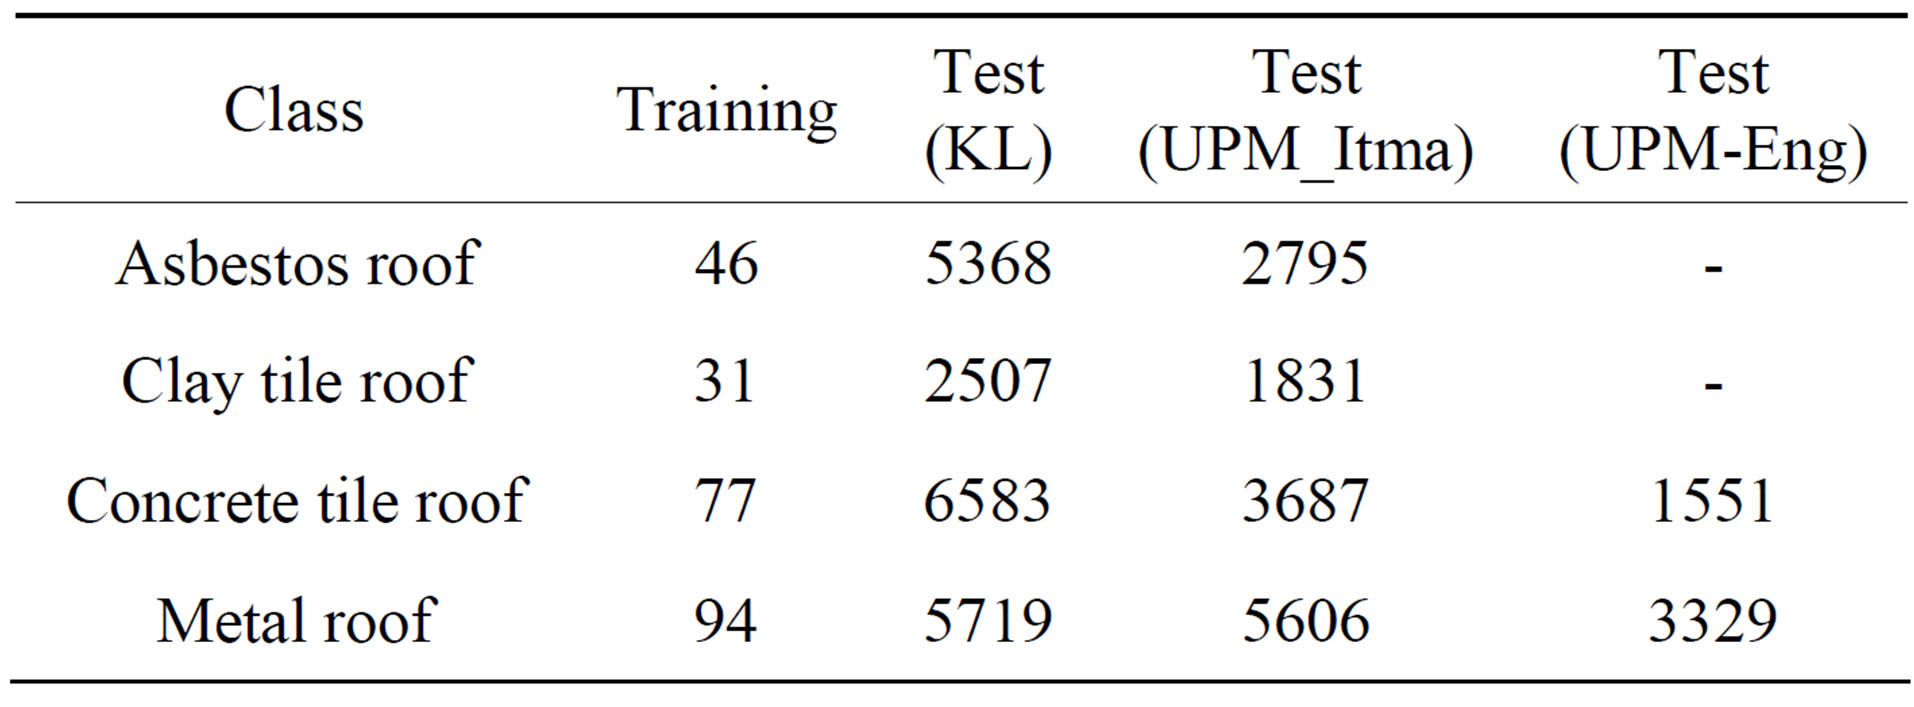
Table 3. The number of training in segment and testing in pixel.

Figure 3. Classification result using ML classifier.
To assess the accuracy of this classification the confusion matrix was used. Table 4 demonstrates the classification accuracy for each class.
3.3. Object-Based Classification Approach (Generic Model)
To build a generic model for detecting roof materials based on the OB approach, the WV-2 image was used. The first and most important step was segmentation and merging, for which the ENVI EX software was used. In this research, 20 and 80 were chosen as the scale bars for segmentation and merging, respectively as shown in Figure 4.
In this research 54 attributes were extracted from WV-2 image. Table 5 shows the number of attributes based on the spectral, spatial, texture and color.
The stepwise approach results show that only 13 of the 54 attributes were selected: band ratio; average bands 2, 3, 5, 6, 7 and 8; Tx_range; Max_band 2, 5 and 8; Majaxislen; and saturation attributes that were more significant than others for discriminating between the classes. The unstandardized coefficient result was used to utilize the original variables of each significant variables and no normalization was applied on the variables of attributes. Table 6 shows the discriminant function coefficient which is based on the unstandardized scores concerning the independent variables.
In this study, for instance, 13 predictor variables in 6 different functions, which follow the linear model, are extracted based on the training data. As an example, function 1 is calculated as follows:


Table 4. Classification accuracy using ML classifier.
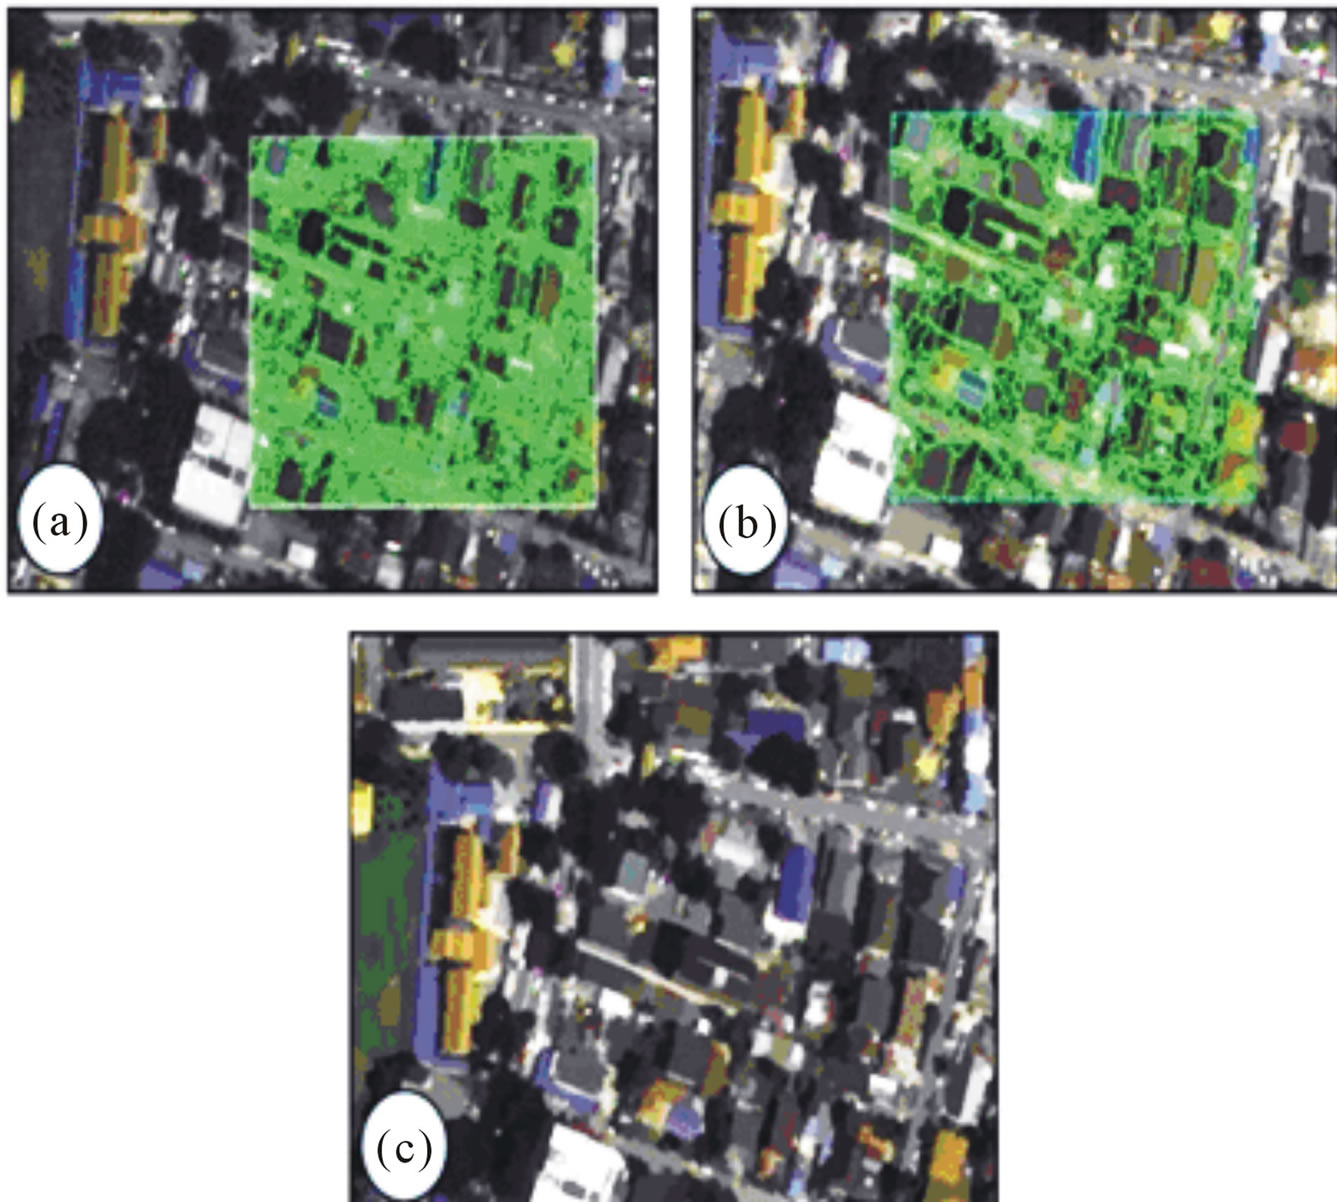
Figure 4. (a) Segmentation preview at scale level 20; (b) Merging preview at scale level 80; (c) Result of merging at scale level 80.

Table 5. Number of attributes which were computed based on spatial, spectral, texture and color.
The means for a group for all the functions are the group centroids, which are given in Table 7.
To predict and assign the class for each segment based on the model, which is based on 6 functions, the Euclidean distance approach was used by comparing the results of six functions output with centroid of each class. First this model was applied to the KL images that all training data for building the model was taken from the KL image. Figure 5 shows the predicated result of roof materials for KL image.

Table 6. Discriminant function coefficients.
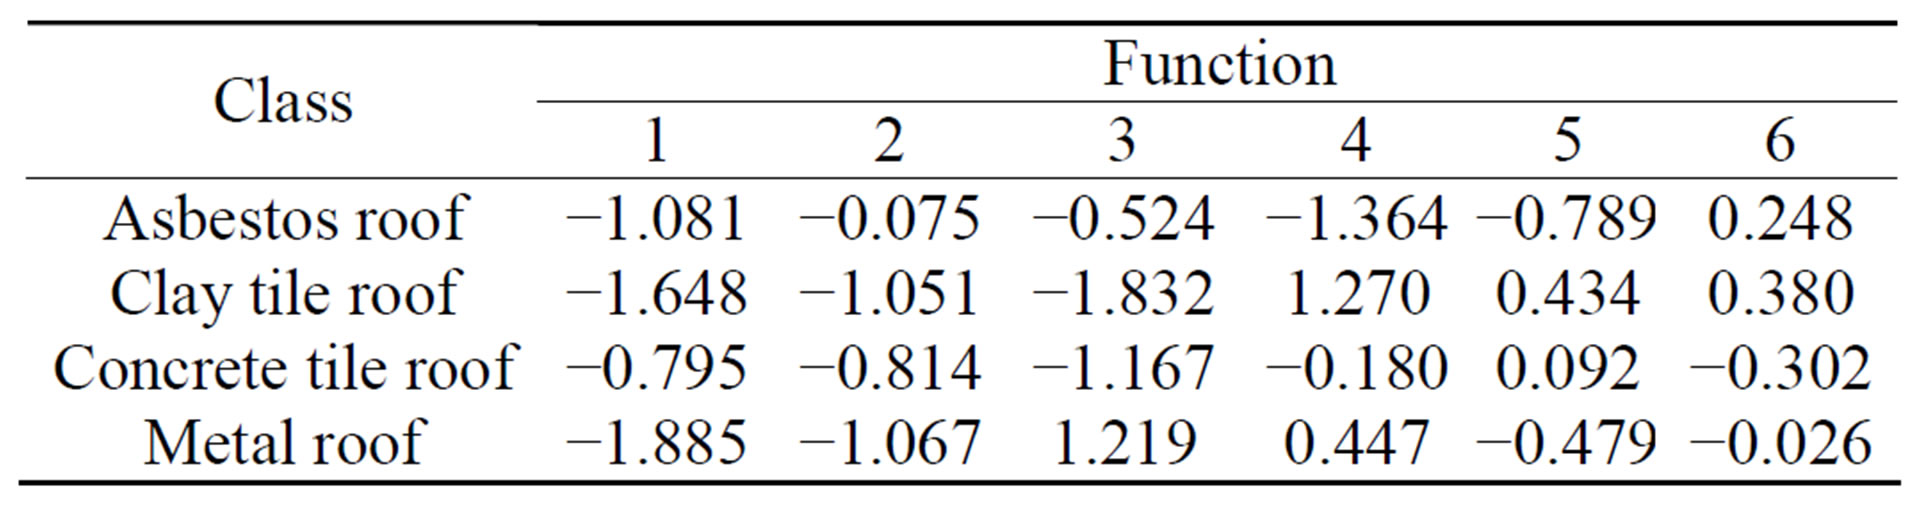
Table 7. Functions at group centroids.
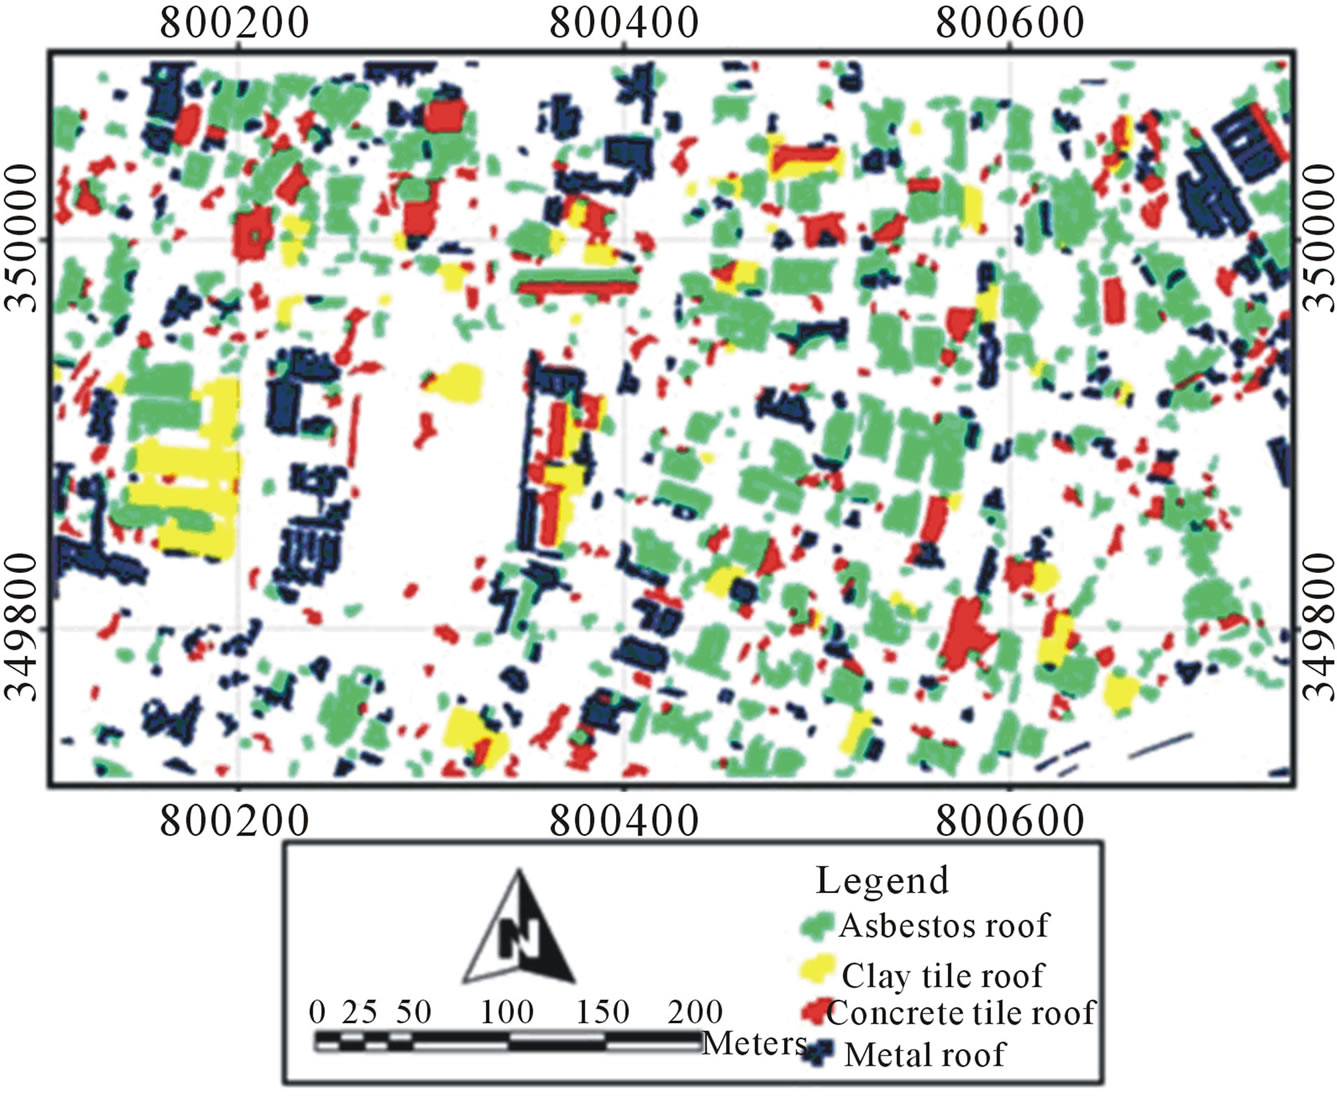
Figure 5. Spatial distribution of roof materials in KL image based on the generic model.
To evaluate, this model was applied to parts of the UPM study area images that was collected in different time. Figure 6 shows the results after applying the model to all attributes extracted from each segment.
To assess the accuracy of the prediction result based on the testing data, the confusion matrix was used. Table 8 shows the accuracy of the model in predicting the roof materials in the different study areas.
The main goal of this research is to build generic
 (a) (b)
Figure 6. (a) UPM_Eng roof types based on the generic model (b) UPM_Itma roof types based on the generic model.

Table 8. Accuracy of model on predicting roof materials in different areas.
model for very high spatial resolution satellite imagery such as WV-2 image, based on the available training data in order to predict the spatial distribution of roof materials in the new areas without using any training data. With the purpose of extraction of value of each spectral, spatial, texture and color attributes, the segmentation processing was applied. This step is the most important and crucial step which affected the result. DA was applied to select the significant attributes and in subsequent process utilizing them to model the roof materials in order to predict spatial distribution of roof materials from the WV-2 images. The model generated based on the KL training data was then applied to different parts of KL and UPM images.
The DA result illustrates that the 13 attributes related to the spectral, spatial, and textural and color information were the most effective over the 54 attributes at discriminating the roof materials. Furthermore based on the DA result, the new additional bands of WV-2 image such as the Red-edge and NIR-ІІ bands are valuable and useful to discriminate between the roof materials compared to the costal blue and yellow bands.
Finally, 6 functions were extracted as the generic model based on the stepwise DA results. First, the model was applied to the related attributes, which were extracted from the vector layer of the KL images, to assess the prediction accuracy, for which the confusion matrix was used. The results show that the model can predict the roof materials with an overall accuracy of approximately 83% and a Kappa coefficient of 0.76. To evaluate the model to predict roof materials without using training data, the model was applied to different WV-2 images of the UPM area. The UPM_Eng and UPM_Itma image results show that the overall accuracy of prediction is approximately 90% and 81%, respectively. This model shows the good potential to predict the spatial distribution without using training data rather than the traditional method (ML) which utilizes the spectral information with approximately 46% overall accuracy. Still, there were some misclassifications, such as asbestos vs. metal roofs, clay tile vs. concrete tile and certain roof materials vs. roads due to some reasons such as illumination of the roof, similarities in texture and spectra. In some parts of the classified images, shadows produced misclassifications, such as shadow vs. asbestos roof. Some misclassifications are related to spectral and textural similarities such as metal vs. asbestos roofs.
This model demonstrates the good potential for predicting and discriminating different roof types such as clay tile, asbestos, concrete tile and metal roof materials from the WV-2 imagery. Furthermore, if buildings are extracted from WV-2 images and the detection of the roof materials are desired, the model can be used to predict materials after the segmentation and extraction of roof attributes.
4. Conclusions
The main goal of this study is to build a generic and transferable model to predict roof materials without using training data, based on OB classification approach. According to the DA results, 13 of 54 attributes were selected based on their spectral, spatial, textural and color information. The model was applied to KL image, and the result shows that the model can predict the spatial distribution of roof materials with 82% accuracy and a 0.76 Kappa coefficient. To evaluate the model, it was applied to UPM_Itma and UPM_Eng images with no training data selected from the images. The UPM_Eng and UPM_Itma results show an overall prediction accuracy of approximately 90% and 81%, respectively.
Finally, this model shows good potential to predict and detect 4 types of roof material that are widely used in Malaysia (metal, concrete tile, asbestos and clay tile roof) without using training data from WV-2 images.
The significances of this model are listed as follows: First, it was created based on the multispectral satellite data instead of hyperspectral data to detect the IS up to the materials level. Second, this model was created based on statistical approach rather than by trial and error. Third, the model fully utilized the information inherent in the WV-2 image which includes the spatial, spectral, color and textural information. Fourth, the transferability of this generic model is able to predict the spatial distribution of roof materials without using training data. On the other hand, the limitation of this model is its inability to discriminate between some roof materials in some areas that have the similarity in terms of color and texture such as concrete tile and clay tile.
Future work could be extended to other types of data, such as high-resolution airborne hyperspectral and UAV imagery. Radar and LiDAR datasets could also be integrated for a more comprehensive modeling of roof materials.
5. Acknowledgements
This work is supported by the Ministry of Higher Education (MOHE) Malaysia (Vot No: 5524193) and Universiti Putra Malaysia (UPM). We also thank two anonymous reviewers for their valuable comments and suggestions that improved this paper.
NOTES