An Adaptive Fuzzy C-Means Algorithm for Improving MRI Segmentation ()
1. Introduction
Clustering is one of the most popular classification methods and has found many applications in pattern classification and image segmentation [1-6]. With increasing use of magnetic resonance imaging (MRI) for diagnosis, treatment planning and clinical studies, it has become almost necessary for radiological experts to make clinical diagnosis and treatment planning by using computers. Medical images tend to suffer much more noise than realistic images due to the nature of the acquisition devices. This of course poses great challenges to any image segmentation technique. In order to reduce noise, many devises increase the partial voluming, that is, they average acquisition on a thick slice. This leads to blurring the edges between the objects, which make decisions very hard for automatic tools [1]. The different acquisition modalities, the different image manipulations and variability of organs all contribute to a large verity of medical images. It can be safely said that there is no single image segmentation method that suits all possible images. This can pose great problems for any segmentation method. Therefore, several types of image segmentation techniques [3-8] were found to achieve accurate segmentations. Among them, the fuzzy clustering methods are of considerable benefits for MRI brain image segmentation [9,10] because the uncertainty of MRI image is widely presented in data. Also the MRIs contain weak boundaries i.e. pixels inside the region and on the boundaries have similar intensity; this causes difficulty working with methods based on edge detection techniques [7,8]. The fuzzy c-means clustering algorithms fall into two categories: fuzzy c-means (FCM) [9] and possibilistic c-means (PCM) [10]. Many extensions of the FCM algorithm have been proposed to overcome above fuzzy clustering problem and reduce errors in the segmentation process [9-13]. There are also other methods for enhancing the FCM performance. For example, to improve the segmentation performance, one can combine the pixel-wise classification with pre-processing (noise cleaning in the original image) [11,13] and post-processing (noise cleaning on the classified data). Xue et al. [13] proposed an algorithm where they firstly denoise images and then classify the pixels using the standard FCM method. These methods can reduce the noise to a certain extent, but still have some drawbacks such as increasing computational time, complexity and introducing unwanted smoothing [14,15]. Liew et al. [16] proposed a spatial FCM clustering algorithm for clustering and segmenting the images by using both the feature space and spatial information. Another variant of FCM algorithm called the robust fuzzy c-means (RFCM) algorithm was proposed in [17].
Pham and Prince [18] modified the FCM objective function by introducing a spatial penalty for enabling the iterative algorithm to estimate spatially smooth membership functions. Ahmed et al. [8] introduced a neighborhood averaging additive term into the objective function of FCM. They named the algorithm bias corrected FCM (BCFCM). Liew and Yan [19] introduced a spatial constraint to a fuzzy cluster method where the inhomogeneity field was modeled by a B-spline surface. The spatial voxel connectivity was implemented by a dissimilarity index, which enforced the connectivity constraint only in the homogeneous areas. This way preserves significantly the tissue boundaries. Zanaty and Aljahdali [11] introduced a new local similarity measure by combining spatial and gray level distances. They used their method as an alternative pre-filtering to an enhanced fuzzy c-means algorithm (EnFCM) [20]. Kang et al. [21] proposed a spatial homogeneity-based FCM (SHFCM). Wang et al. [22] incorporated both the local spatial context and the non-local information into the standard FCM cluster algorithm. They used a novel dissimilarity measure in place of the usual distance metric. In those methods, effect of noise can be overcome by incorporating possibility (typicality) function in addition to membership function. For that, the possibilistic c-means algorithm (PCM) was developed in [23]. This technique combines FCM and logic with some modification in its membership function for removal of noise from the MRI brain images. It has been shown to be more robust to outliers than FCM. However, the robustness of PFCM comes at the expense of the stability of the algorithm [24]. The PCM-based algorithms suffer from the coincident cluster problem that makes them too sensitive to initialization [24]. Many efforts have been presented to improve the stability of possibilistic clustering [25-27].
Although the previous MRIs segmentation algorithms had suppressed the impact of noise and intensity inhomogeneity to some extents, these algorithms still produce misclassified small regions. The problems of over-segmentation and sensitivity to noise are still the challenge. FCM and PCM are also very sensitive to initialization and sometimes coincident clusters will occur. Moreover, coincident clusters may occur during fuzziness processes which can affect the final segmentation.
In this paper, we propose a new method called PFCM which combines the characteristics of both FCM and PCM algorithms by new weights for accurate MRIs segmentation. The proposed method avoids various problems of existing fuzzy clustering methods, solves the noise sensitivity defect of FCM and overcomes the coincident clusters problem of PCM. In order to reduce the noise effect during segmentation, the proposed algorithm combines the objective functions of conventional FCM algorithm and PCM algorithm. To overcome the problem of coincident clusters of PCM and also for combination of the objective FCM and PCM, a new weight function is proposed that is based on Gaussian membership. In this method the effect of noise is overcome by incorporating possibility (typicality) function in addition to membership function. Consideration of these constraints can greatly control the noise in the image as shown in our experiments. The efficiency of the proposed algorithm is demonstrated by extensive segmentation experiments using real MRIs and comprising with other state of the art algorithms.
The rest of this paper is organized as follows: The theoretical foundation of fuzzy c-means and possibilistic c-means is described in Section 2. In Section 3, the proposed PFCM algorithm is presented. Experimental and comparisons results are given in Section 4. Finally, Section 5 gives our conclusions.
2. FCM and PCM Algorithms
The FCM algorithm [10] is an iterative clustering method that produces optimal C partitions by minimizing the weighted within the group sum of squared error objective function :
:
 (1)
(1)
where  is the data set in the p-dimensional vector space, n is the number of points, p is the number of data items, C is the number of clusters with
 .
.  is the C centers or prototypes of the clusters, vi is the p-dimension center of the cluster i, and
  is a square distance measure between object
  and cluster center
 represents a fuzzy partition matrix with
  is the degree of membership of
  in the ith cluster;
  is the jth of p-dimensional measured data. The fuzzy partition matrix satisfies:
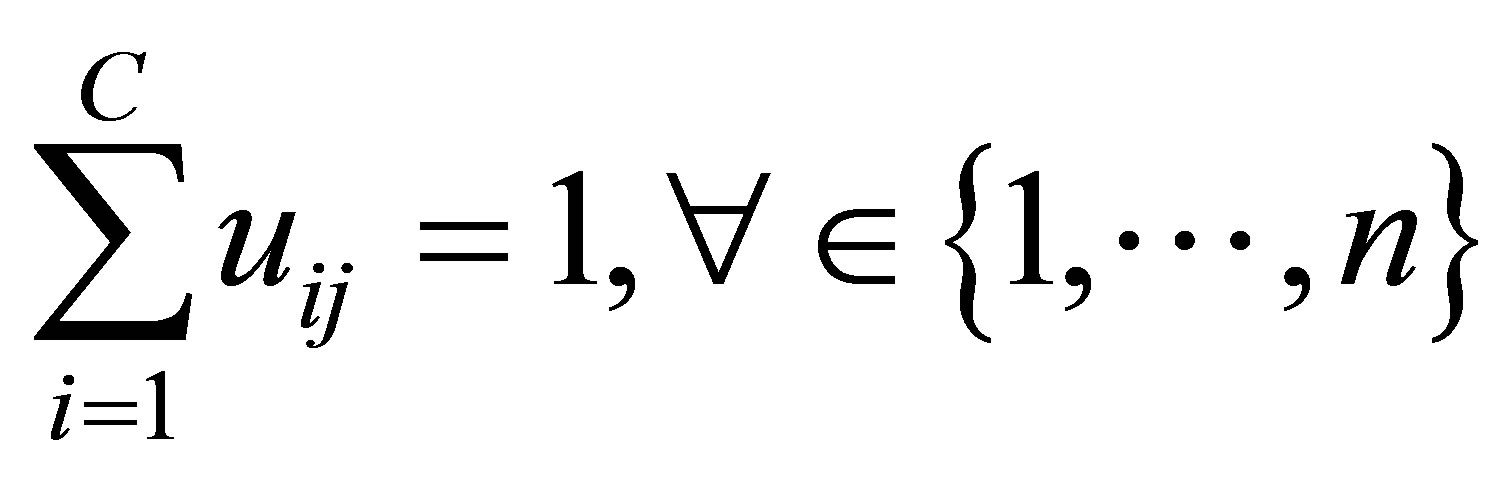
 (2)
(2)
 (3)
(3)
The parameter m is a weighting exponent for each fuzzy membership and determines the amount of fuzziness of the resulting classification; it is a fixed number greater than one. The objective function  can be minimized under the constraint of
The objective function  is minimized with respect to
  and
and , respectively:
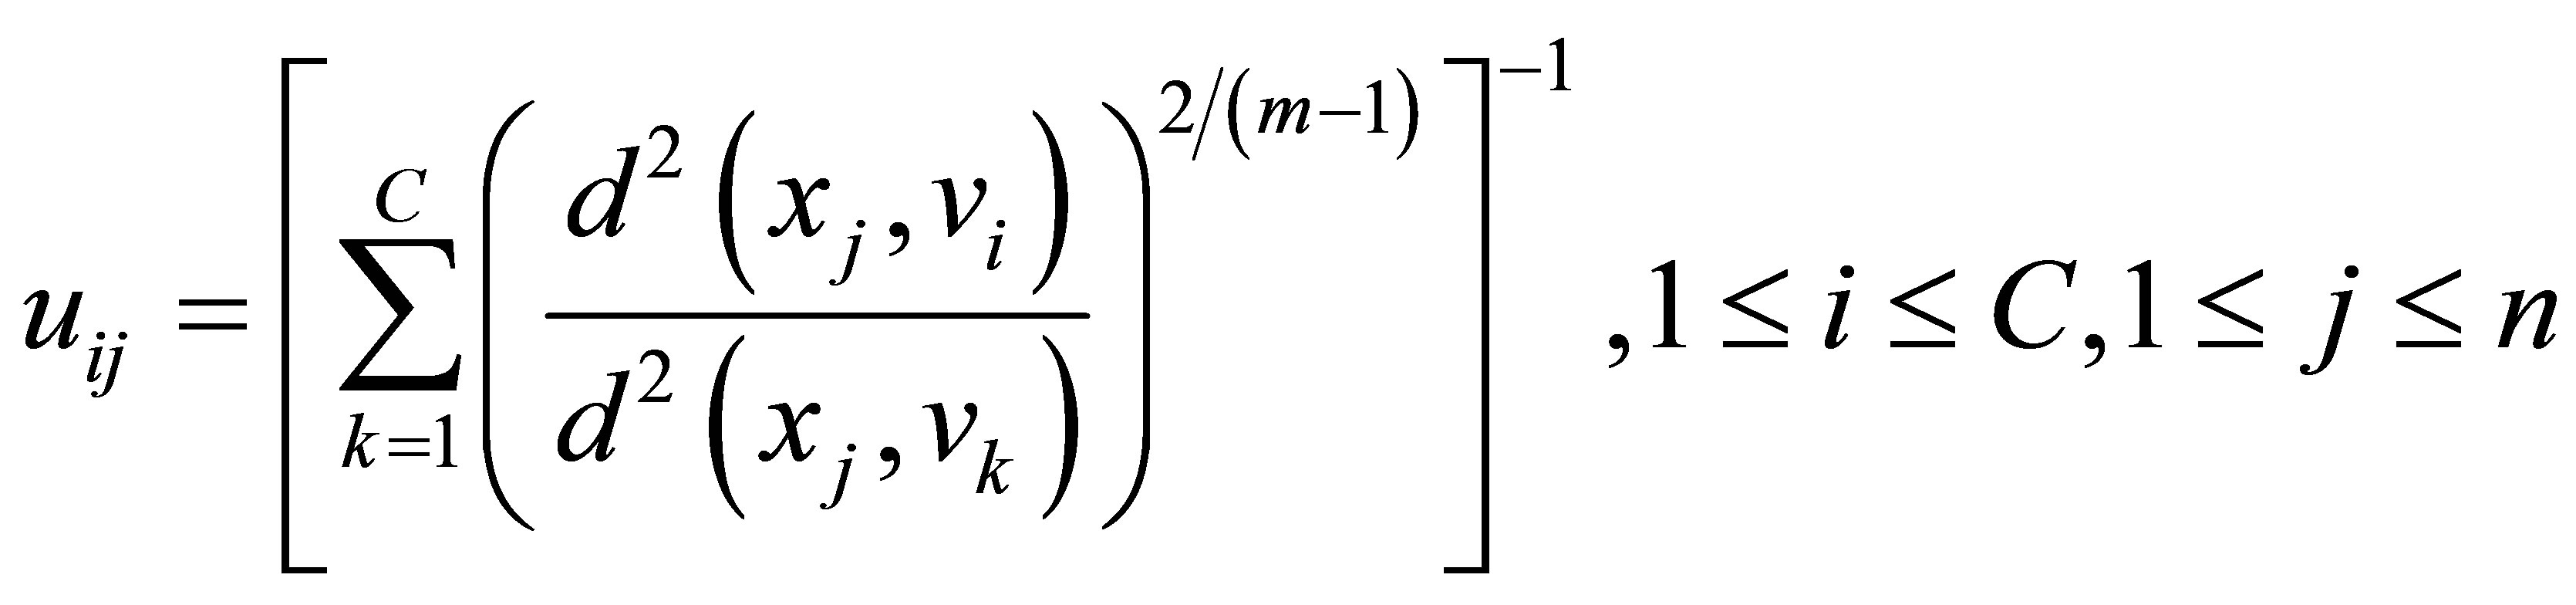
 (4)
(4)
 (5)
(5)
Although FCM and the modified FCM [18,20,22] are useful clustering methods, their memberships do not always correspond well to the degree of belonging of the data, and may be inaccurate in a noisy environment, because the real data unavoidably involves noise. To alleviate weakness of FCM, and to produce memberships that have a good explanation for the degree of belonging of the data. Wang et al. [22] relaxed the constrained condition (3) of the fuzzy C-partition to obtain a possibilistic type of membership function and propose PCM for unsupervised clustering. The component generated by the PCM corresponds to a dense region in the data set; each cluster is independent of the other clusters in the PCM strategy. The objective function of the PCM can be formulated as follows:
 (6)
(6)
where
 (7)
(7)
is the scale parameter at the ith cluster, and
 (8)
(8)
is the possibilistic typicality value of training sample  belonging to the cluster
  is a weighting factor called the possibilistic parameter.
Zanaty and Sultan [11] proposed a method for automatic fuzzy algorithms by considering some spatial constraints on the objective function. The algorithm starts of subdivide the data a set of  vector
 into M clusters using well-known fuzzy method [10] (see Equations (1)-(4)). Assume, the data is divided into M cluster,
  with centres
  respectively. The proposed algorithm processes every two neighbours clusters individually, i.e. if we have three clusters
  with centres
 ,
,  , and
, and . We start to hold our validity function between clusters
  and
and  if:
if:

Our validity function is proposed to use the intracluster distance measure, which is simply the distance between a centre of cluster  and cluster centre
  multiplied by the objective function of fuzzy. We can define the validity function as:
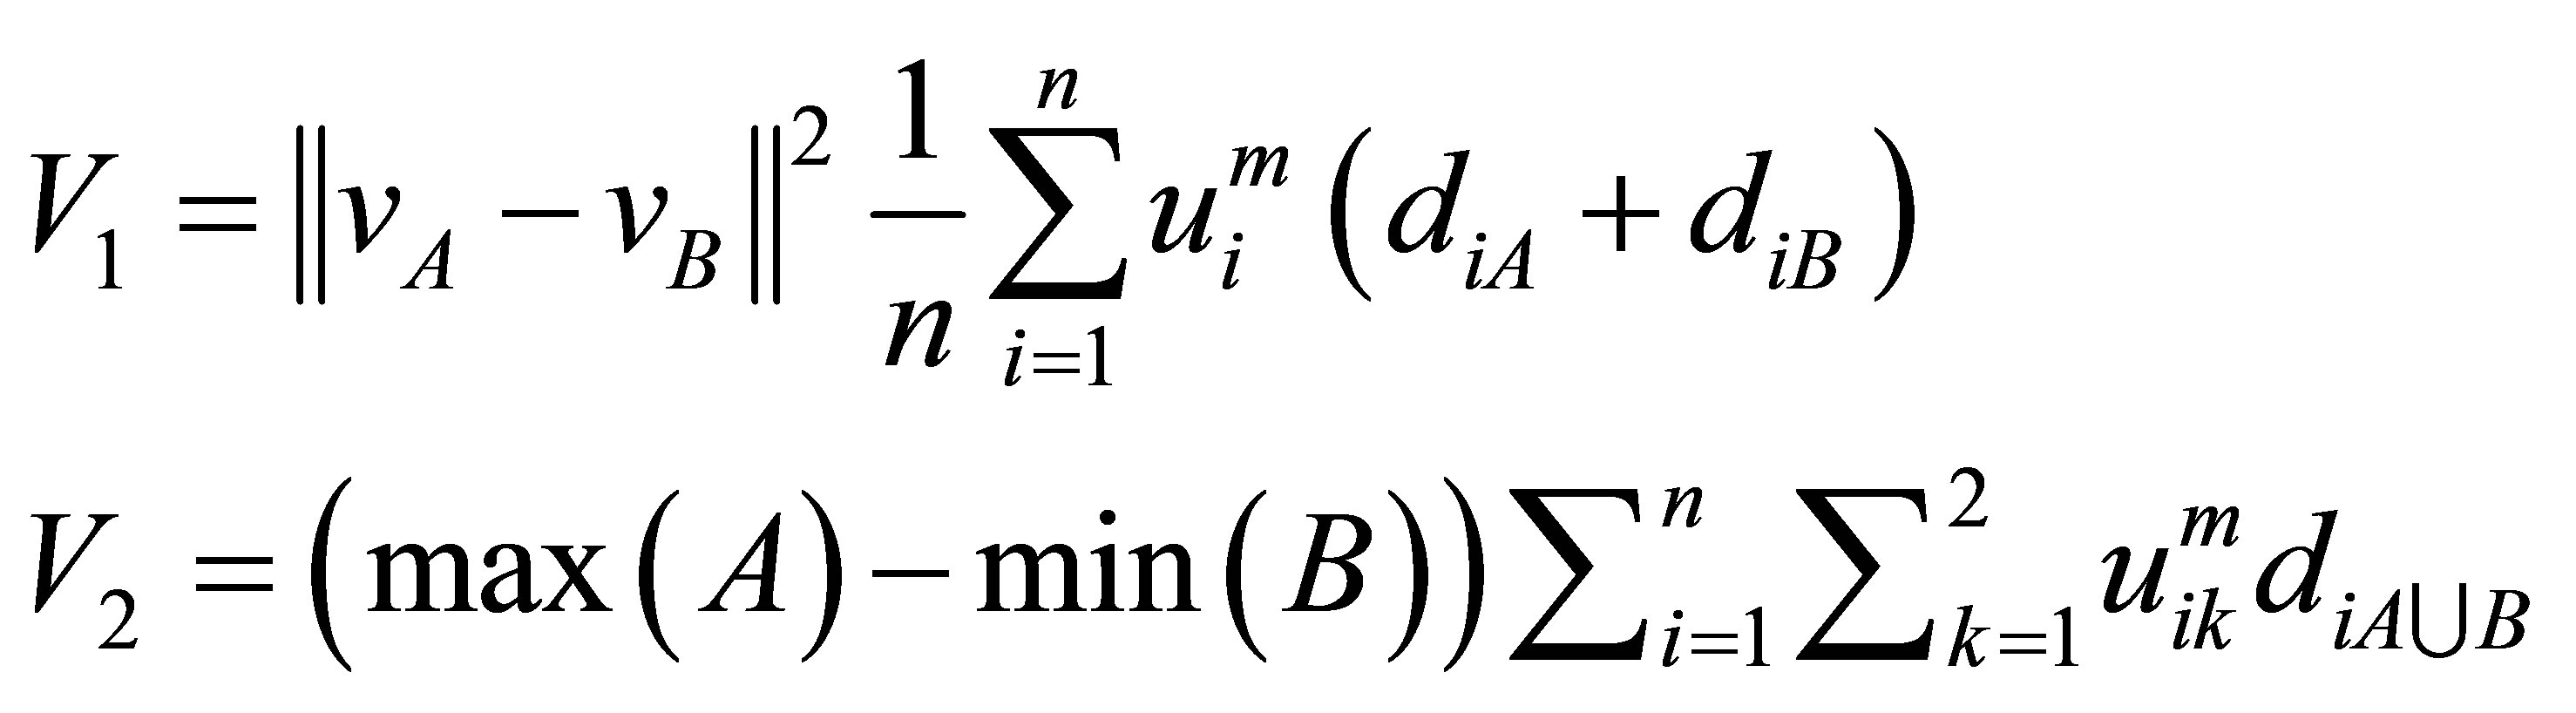 (9)
(9)
where  and
and  are the maximum and minimum values of clusters
  and
and  respectively. While
  is the distances of the data
  (of number n) of
  union
union  i.e.
i.e. . This algorithm works iteratively the number of clusters increases automatically according to the decision of validity function in Equations (9) and (10), more discussion can be shown in [11].
Typical of other cluster approaches, the PCM also depends on initialization. In PCM technique [25], the clusters do not have a lot of mobility, since each data point is classified as only one cluster at a time rather than all the clusters simultaneously. Therefore, a suitable initialization is required for the algorithms to converge to nearly global minimum.
 (10)
(10)
with the following constraints:

A solution of the objective function can be obtained via an iterative process where the degrees of membership, typicality and the cluster centers are updated as follows:
 (11)
(11)
 (12)
(12)
 (13)
(13)
Pal et al. [26] improved this method by adding a new penalty to the objective function in order to control the noise affects. The objective unction can be written as:
 (14)
(14)

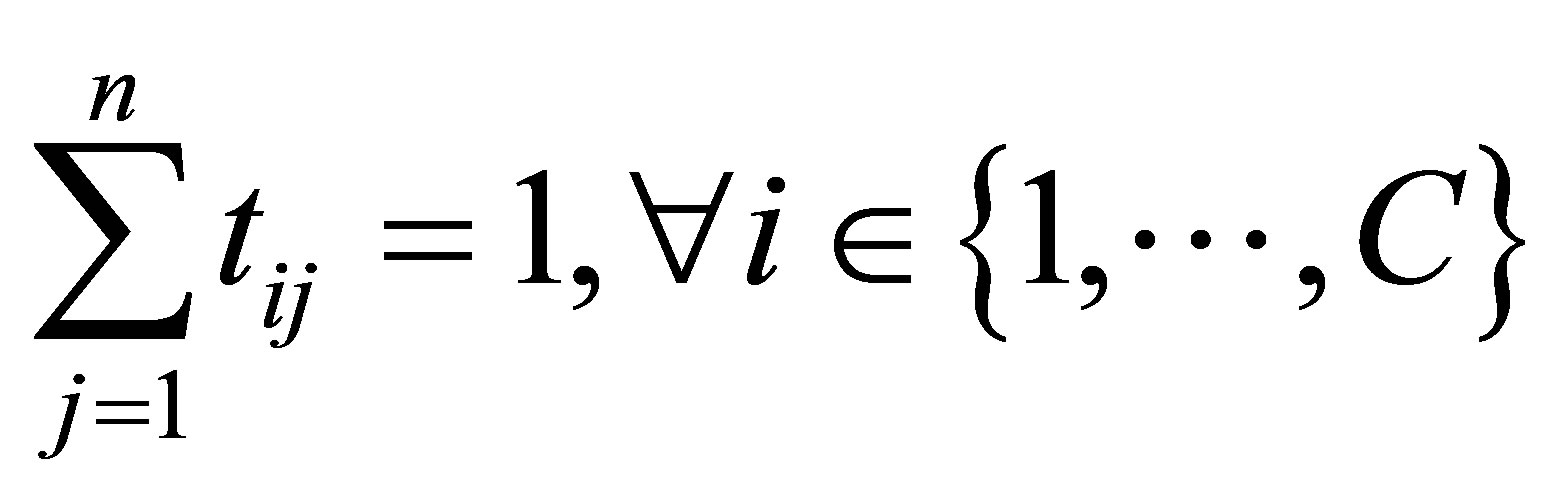
with the following constraints:
 (15)
(15)
 (16)
(16)
 (17)
(17)

Rajendran and Dhanasekaran [24] define a clustering algorithm that combines the characteristics of both fuzzy and possibilistic c-means. Memberships and typicalities are important for the correct feature of data substructure in clustering problems. Thus, an objective function in this method that depends on both memberships and typicalities can be shown as:
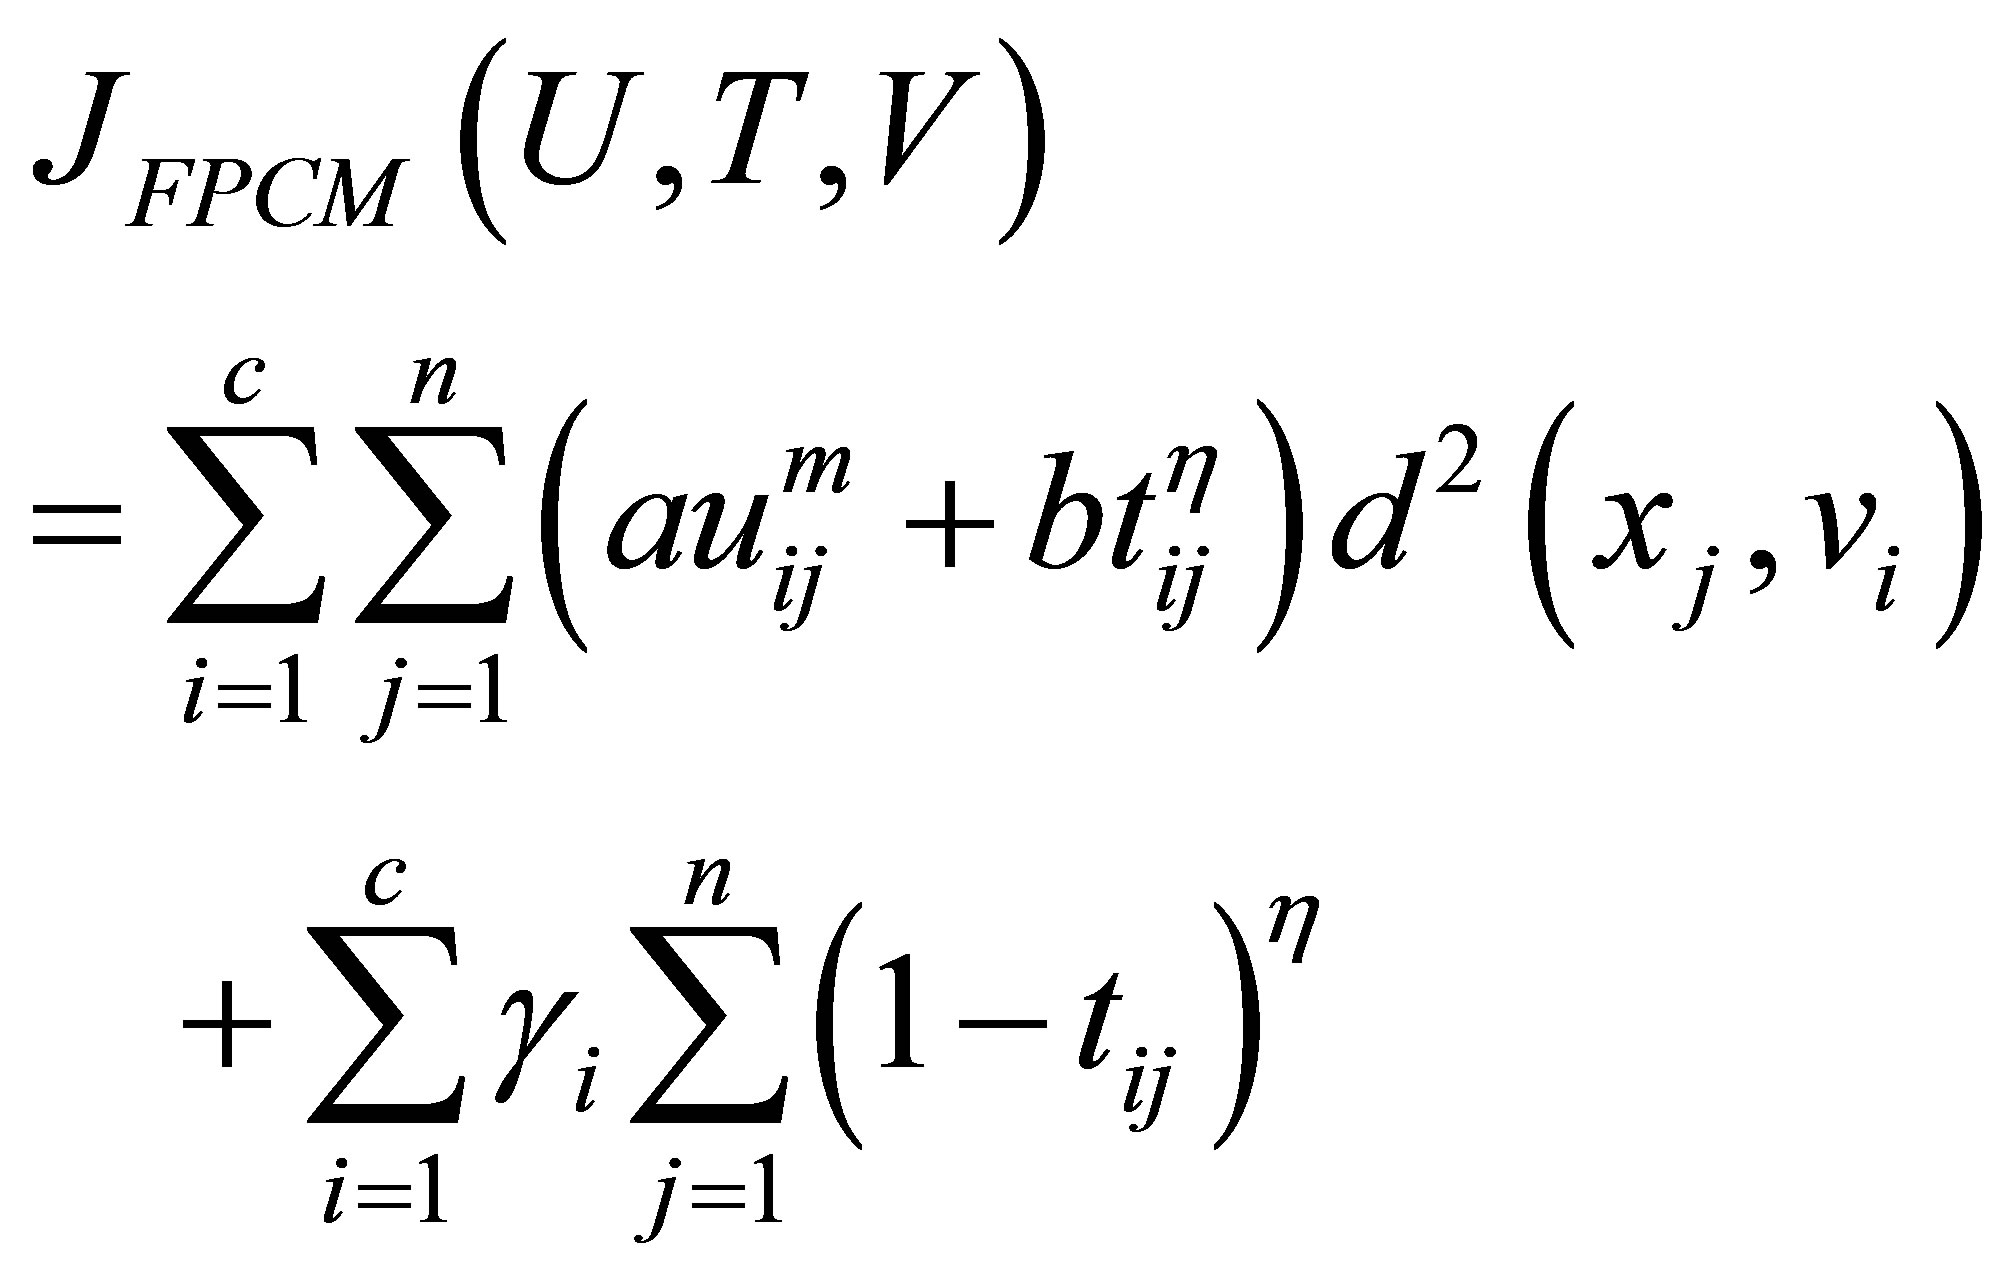 (18)
(18)
with the following constraints:


A solution of the objective function can be obtained via an iterative process where the degrees of membership, typicality and the cluster centers are updated as follows:
 (19)
(19)
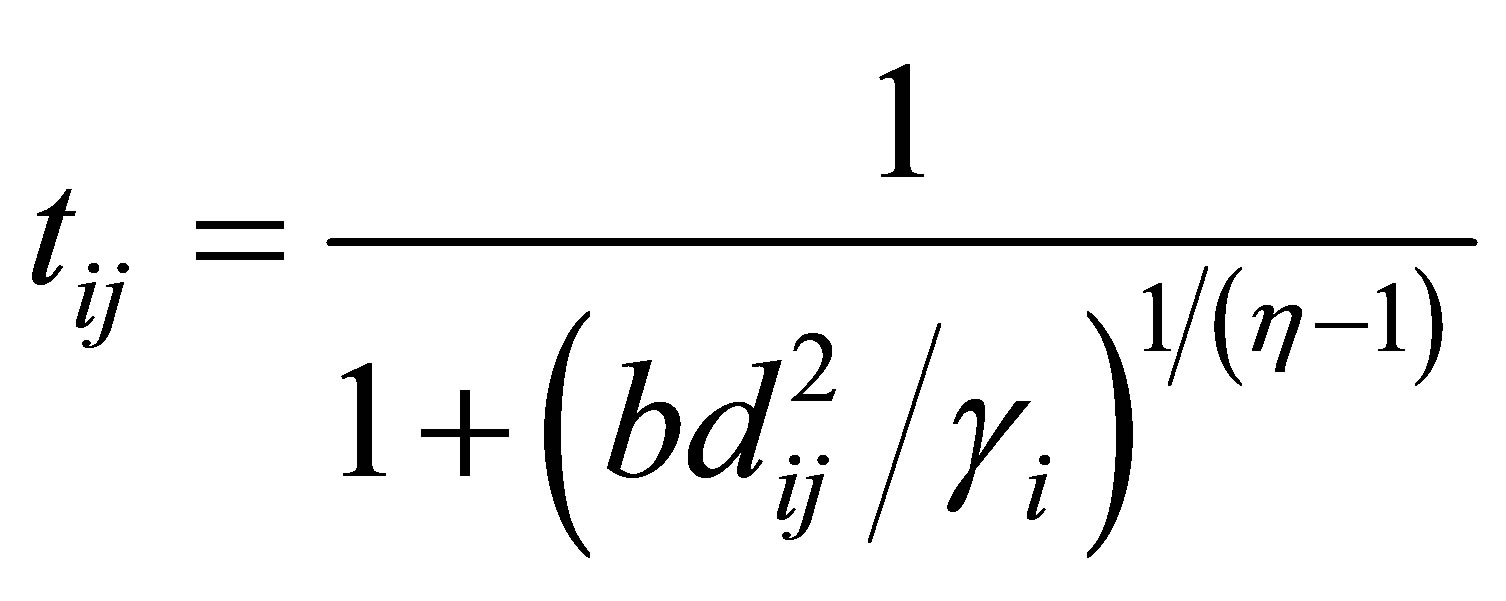 (20)
(20)
 (21)
(21)
The above equations indicate that membership uij is influenced by all C cluster centers, while possibility tij is influenced just by the ith cluster center ci. The possibilistic term distributes the tij with respect to every n data points, but not by means of every C clusters. Thus, membership can be described as relative typicality, it determines the degree to which a data fit in to cluster in accordance with other clusters and is helpful in correctly labeling a data point. Possibility can be observed as absolute typicality, it determines the degree to which a data point belongs to a cluster correctly, it can decrease the consequence of noise. Joining both membership and possibility can yield to good clustering result [28].
3. The Proposed PFCM Algorithm
The choice of an appropriate objective function is a key to the success of cluster analysis and to obtain better quality clustering results; hence, clustering optimization is based on the objective function [28]. To identify a suitable objective function, one may start from the following set of requissrements: the distance between the data points assigned to a cluster should be minimized and the distance between clusters should to be maximized [26]. To obtain an appropriate objective function, we take into consideration the following:
● The distance between clusters and the data points allocated to them must be reduced.
● Coincident clusters may occur and must to be controlled.
● Selecting the initialization sensitive parameters for decreasing noises affect.
The desirability between data and clusters is modeled by the objective function. Hung et al. [29] provides a modified PCM technique which considerably improves the function of FCM because of a prototype-driven learning of parameter. The learning procedure of is dependent on an exponential separation strength between clusters and is updated at every iteration.
As for the common value used for this parameter by every data for iterations, we propose a new weight function  which is based on Gaussian membership of a point p. achieving every point of the data set has a weight in relation to every cluster. The usage of weights produces good classification particularly in the case of noisy data. The weight is calculated as follows:
 (22)
(22)
where ,
,  and
and  is the weight of the point j in relation to class i. This weight is used to modify the fuzzy and typical partition. To classify a data point, the cluster centroid has to be closest to the data point, it is membership; and for estimating the centroids, the typicality is used for alleviating the undesirable effect of outliers. The objective function is composed of two expressions: the first is the fuzzy function and it uses a fuzziness weighting exponent, the second is possibililstic function and it uses a typical weighting exponent; but the two coefficients in the objective function are only used as exhibitor of membership and typicality. A new relation, lightly different, enabling a more rapid decrease in the function and increase in the membership and the typicality when they tend toward 1 and decrease this degree when they tend toward 0. This relation is to add weighting Gaussian exponent as exhibitor of distance in the two under objective functions.
To solve the noise sensitivity defect of FCM which has an influence on the estimation of centroids, and to overcome the coincident clusters problem of PCM, the hybridization of possibilistic c-means (PCM) and fuzzy c-means (FCM) is proposed that often avoids various problems. We will use the proposed weight  and the term
  in the objective function for alleviating the noise affect and to decrease the distances between clusters and centers and to avoid coincident clusters. Thus the objective function of the proposed method (PFCM) can be formulated as follows:

 (23)
(23)
where  and
and  is a user defined constants and the parameter m is a weighting exponent for each fuzzy membership. More datasets are tested in [30], they proved that there is a relation between the data shape and m. For instance, the triangular shape will fit better if m = 3 is used, more discussion can be found in [10]. Therefore we take into account the data shape in the objective function and to be general for all tested data sets. This penalty term also contains spatial neighborhood information, which acts as a regularizer and biases the solution toward piecewise-homogeneous labeling. Such regularization is helpful in segmenting images corrupted by noise. The objective function
  under the constraint of
  and
and  can be obtained by using the following theorem [25]:
Theorem: Let  denotes an image with n pixels to be partitioned into C classes (clusters), where
  represents feature data. The algorithm is an iterative optimization that minimizes the objective function defined by Equation (23) with the constraints
 . Then
 and
and
 must satisfy the following equalities:
 (24)
(24)
 (25)
(25)
 (26)
(26)
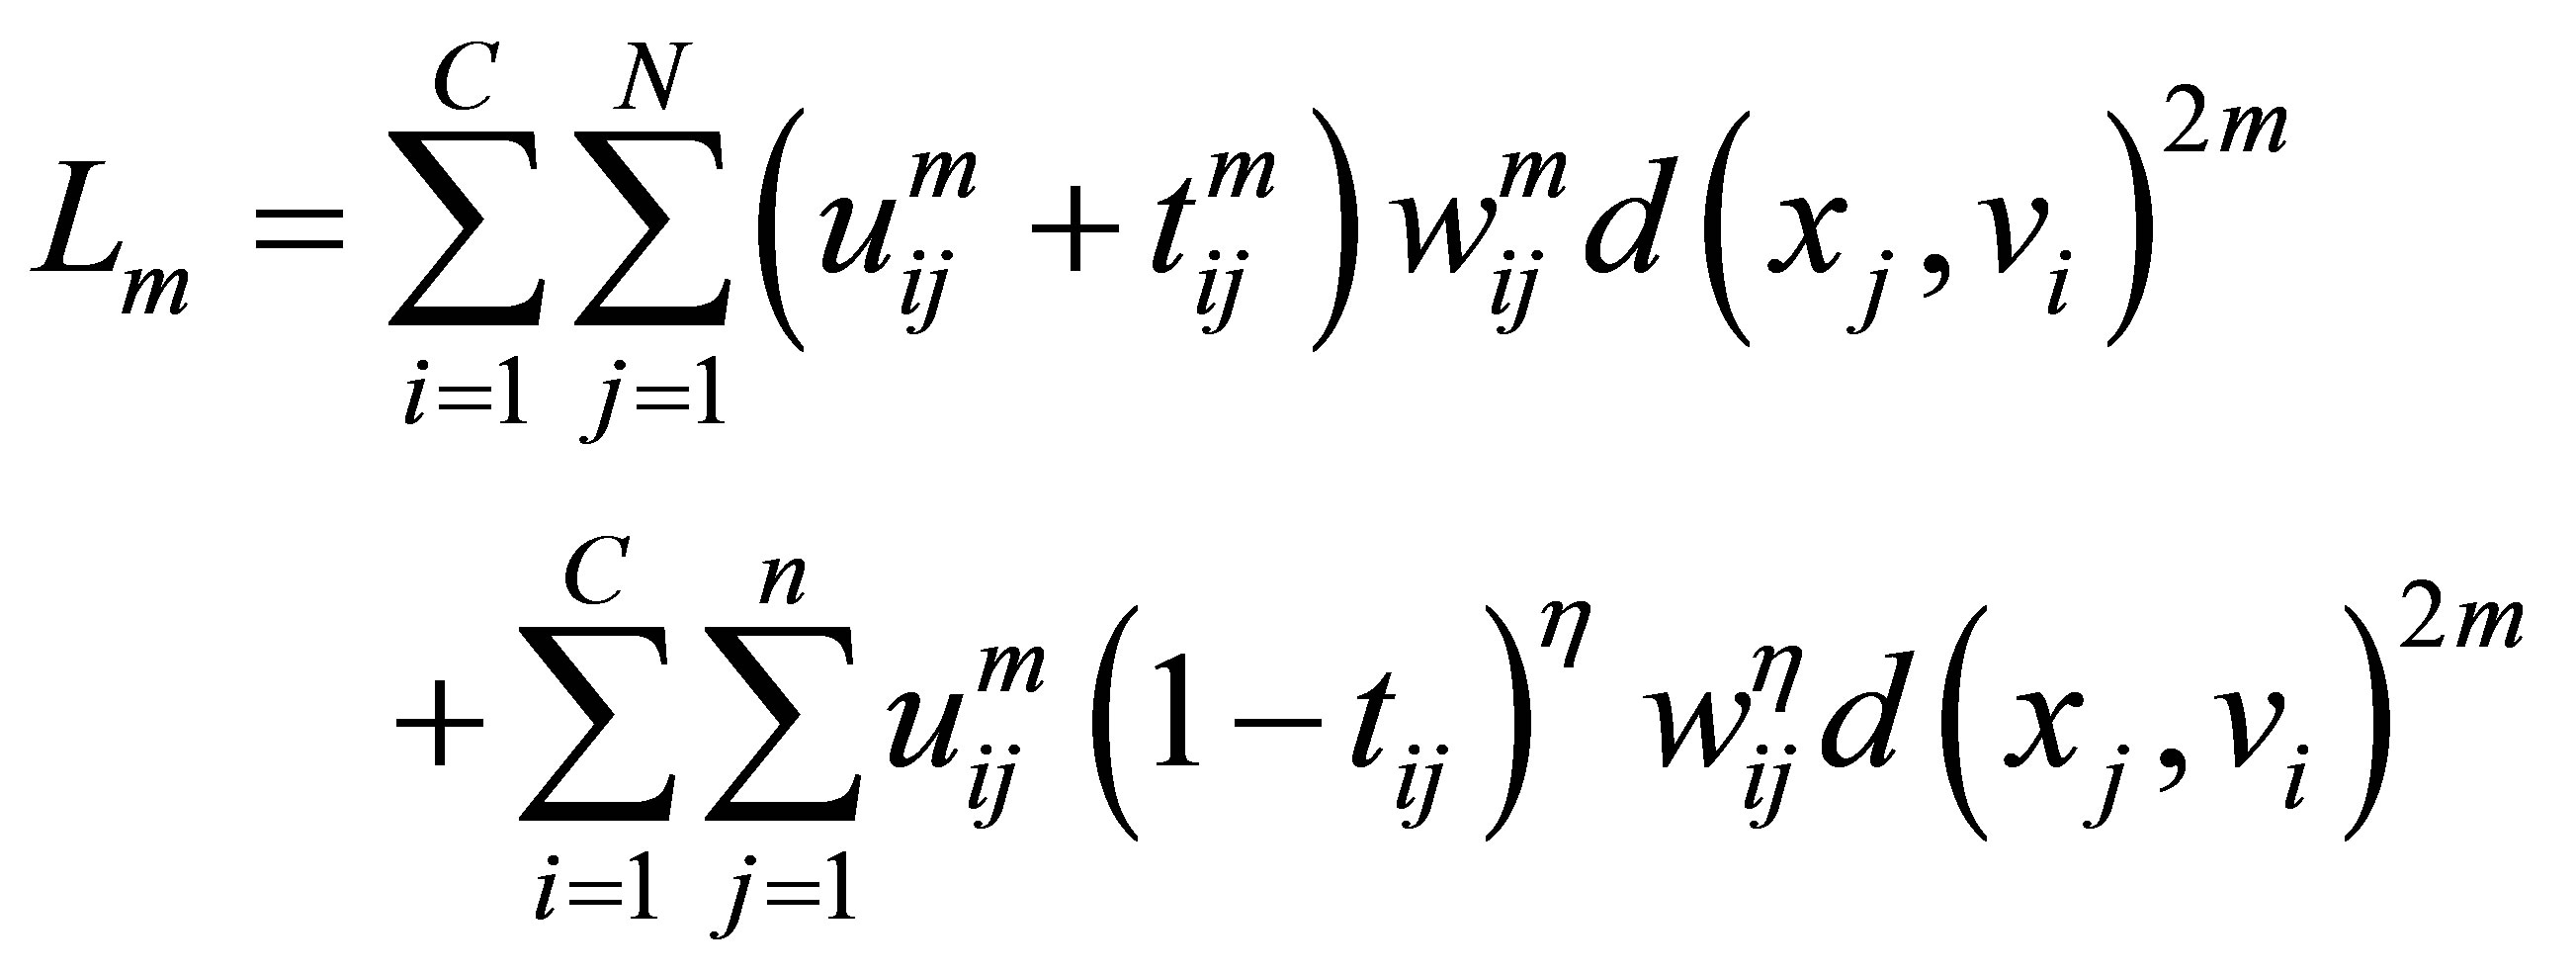
Proof: The minimization of constraint problem  in Equation (23) under the given constraints can be solved of using the Lagrange multiplier method. We define a new objective function with the constraint condition of (Equation (23)) as follows:

Taking the partial derivative of Lm with respect to uki and  and then setting them to equal to zero, we have:
 (27)
(27)
 (28)
(28)
From Equation (27), we get:
 (29)
(29)
By substitution from Equation (29) into Equation (28), we get
 (30)
(30)
 (31)
(31)
 (32)
(32)
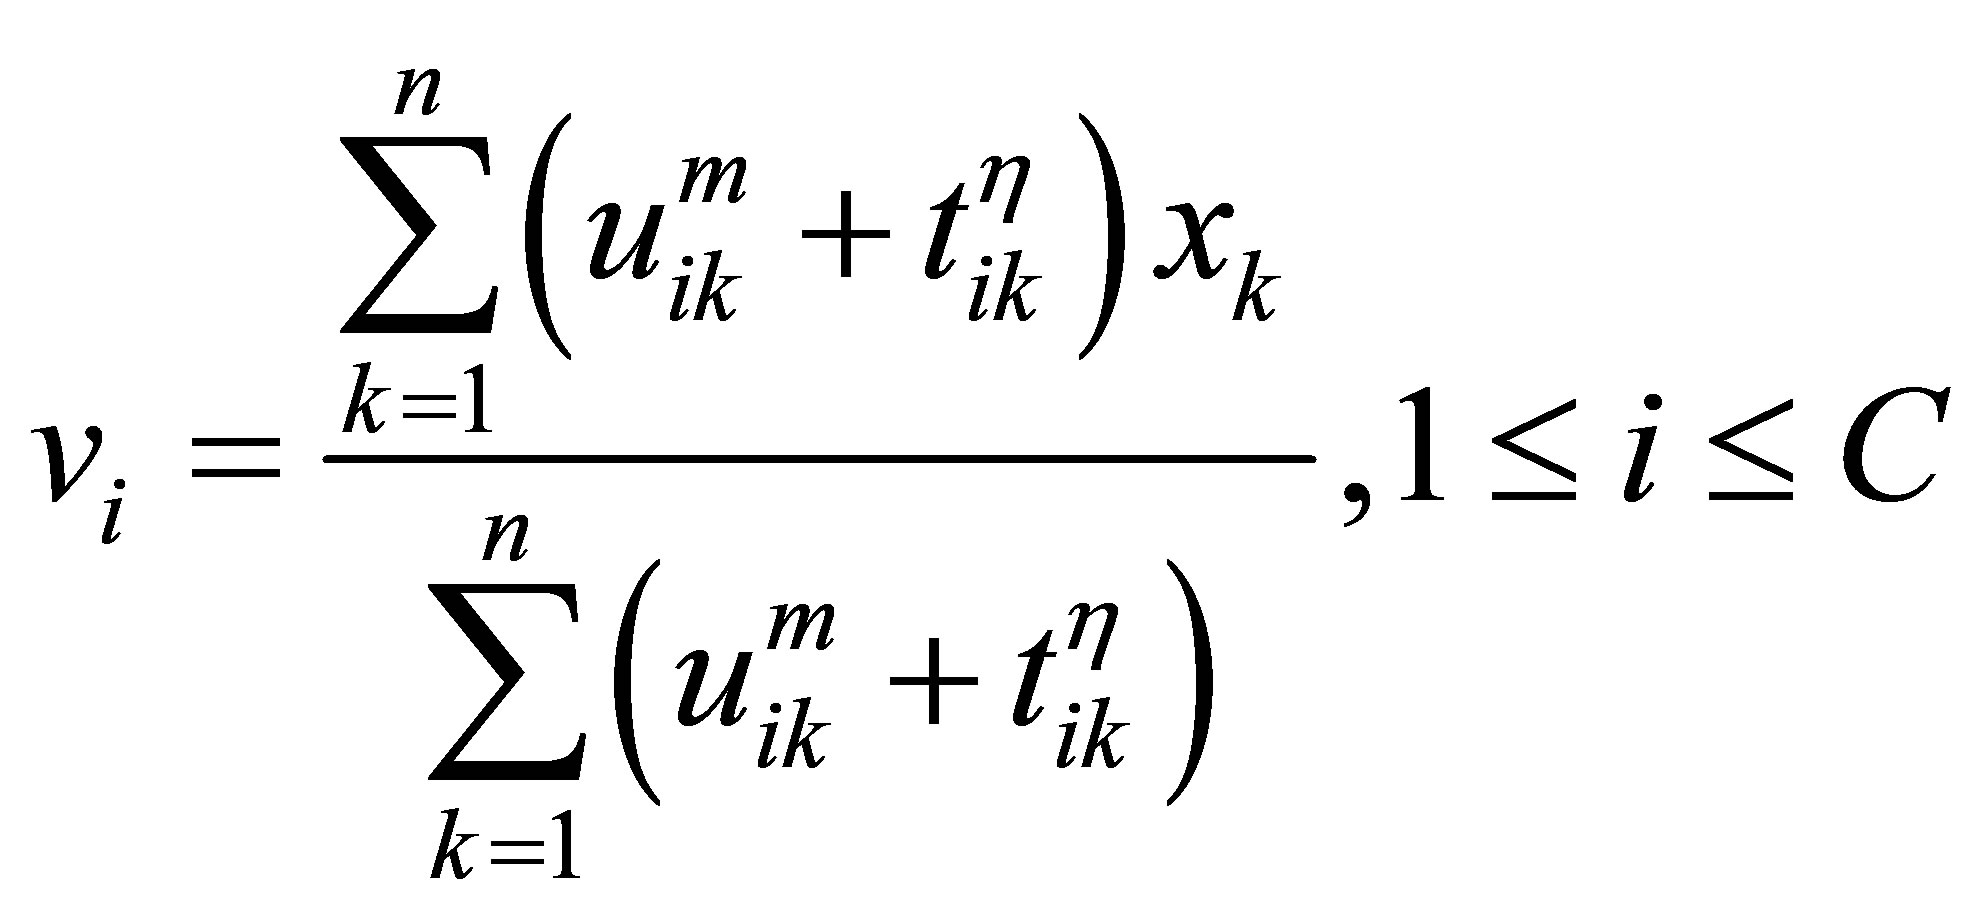
The process of finding the best clusters is continued to update the centres  and the membership
  using Equations (30) and (31), respectively.
The algorithm for carrying out PFCM for segmentation of MRI brain images can now be stated from the following steps:
1) Select the number of clusters “C” and fuzziness factor “m”
2) Select initial class center prototypes ;
; , randomly and ε ,a very small number 3) Find the value of wij using Equation (22)
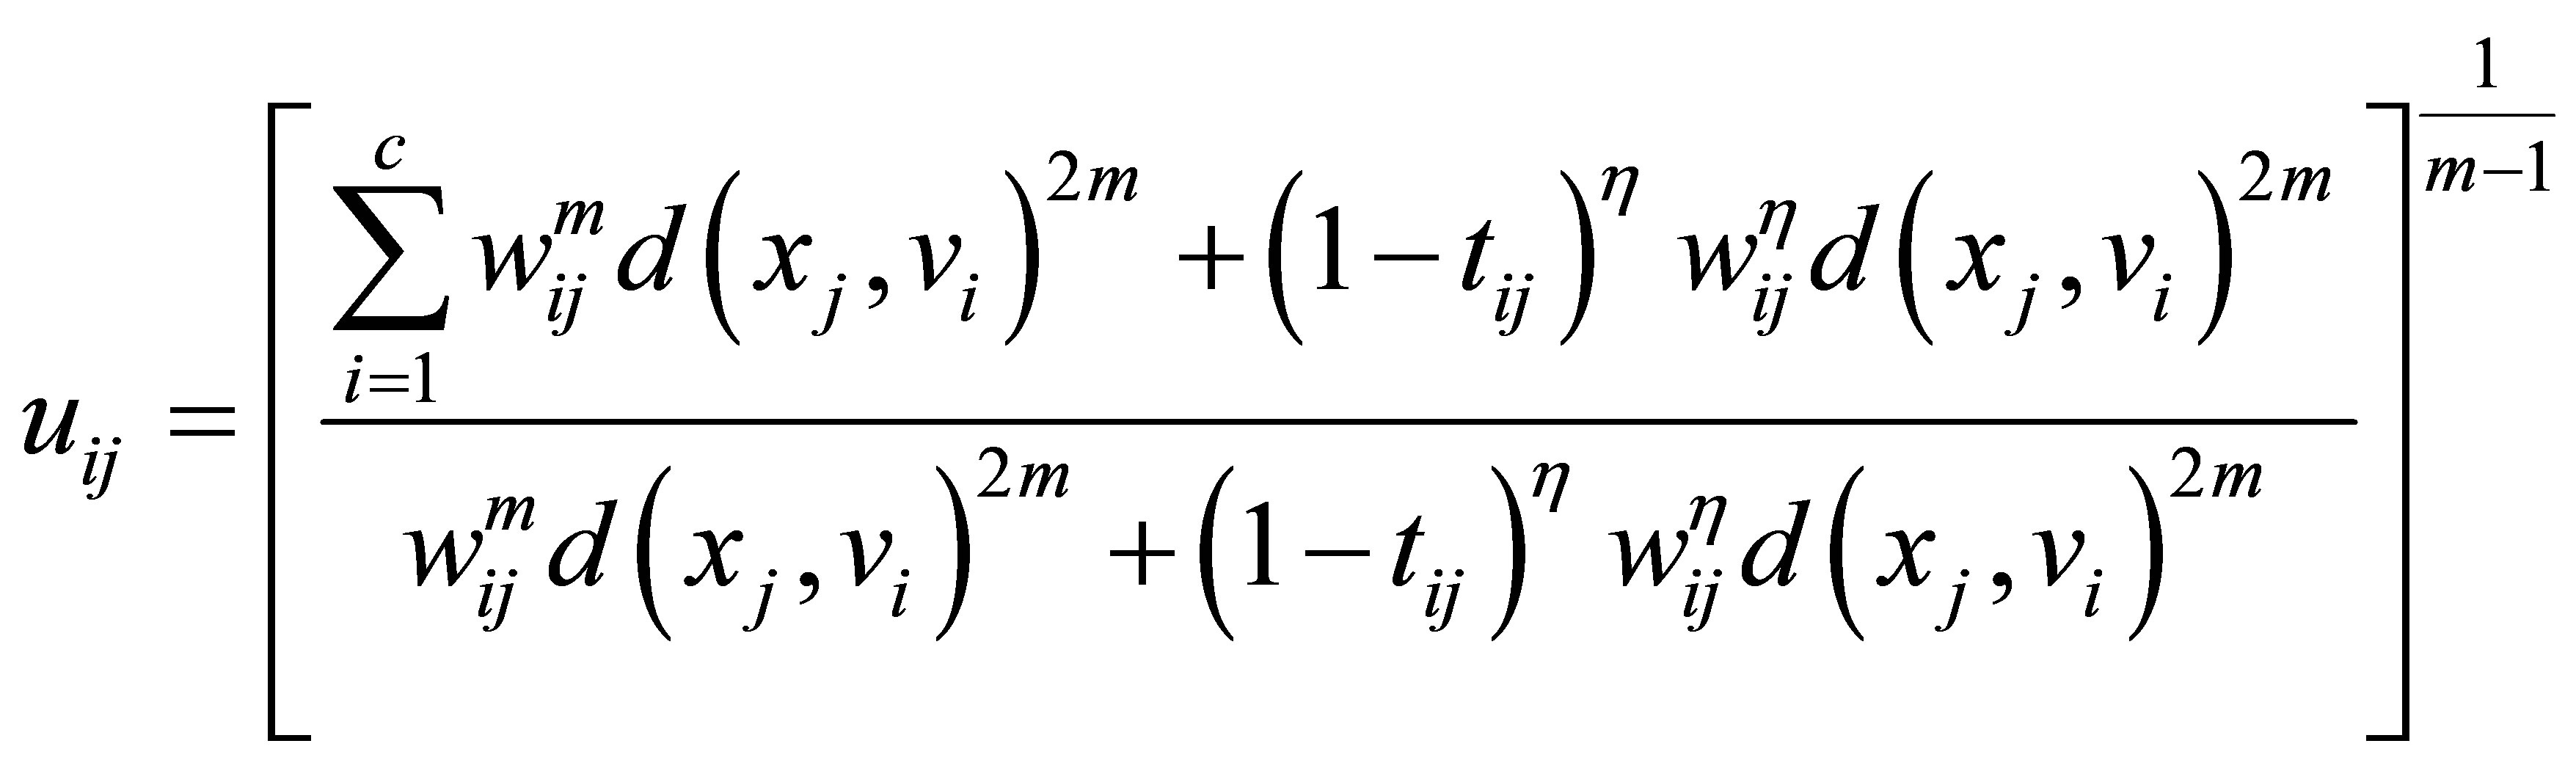
4) Update membershisp function uij using Equation (30)
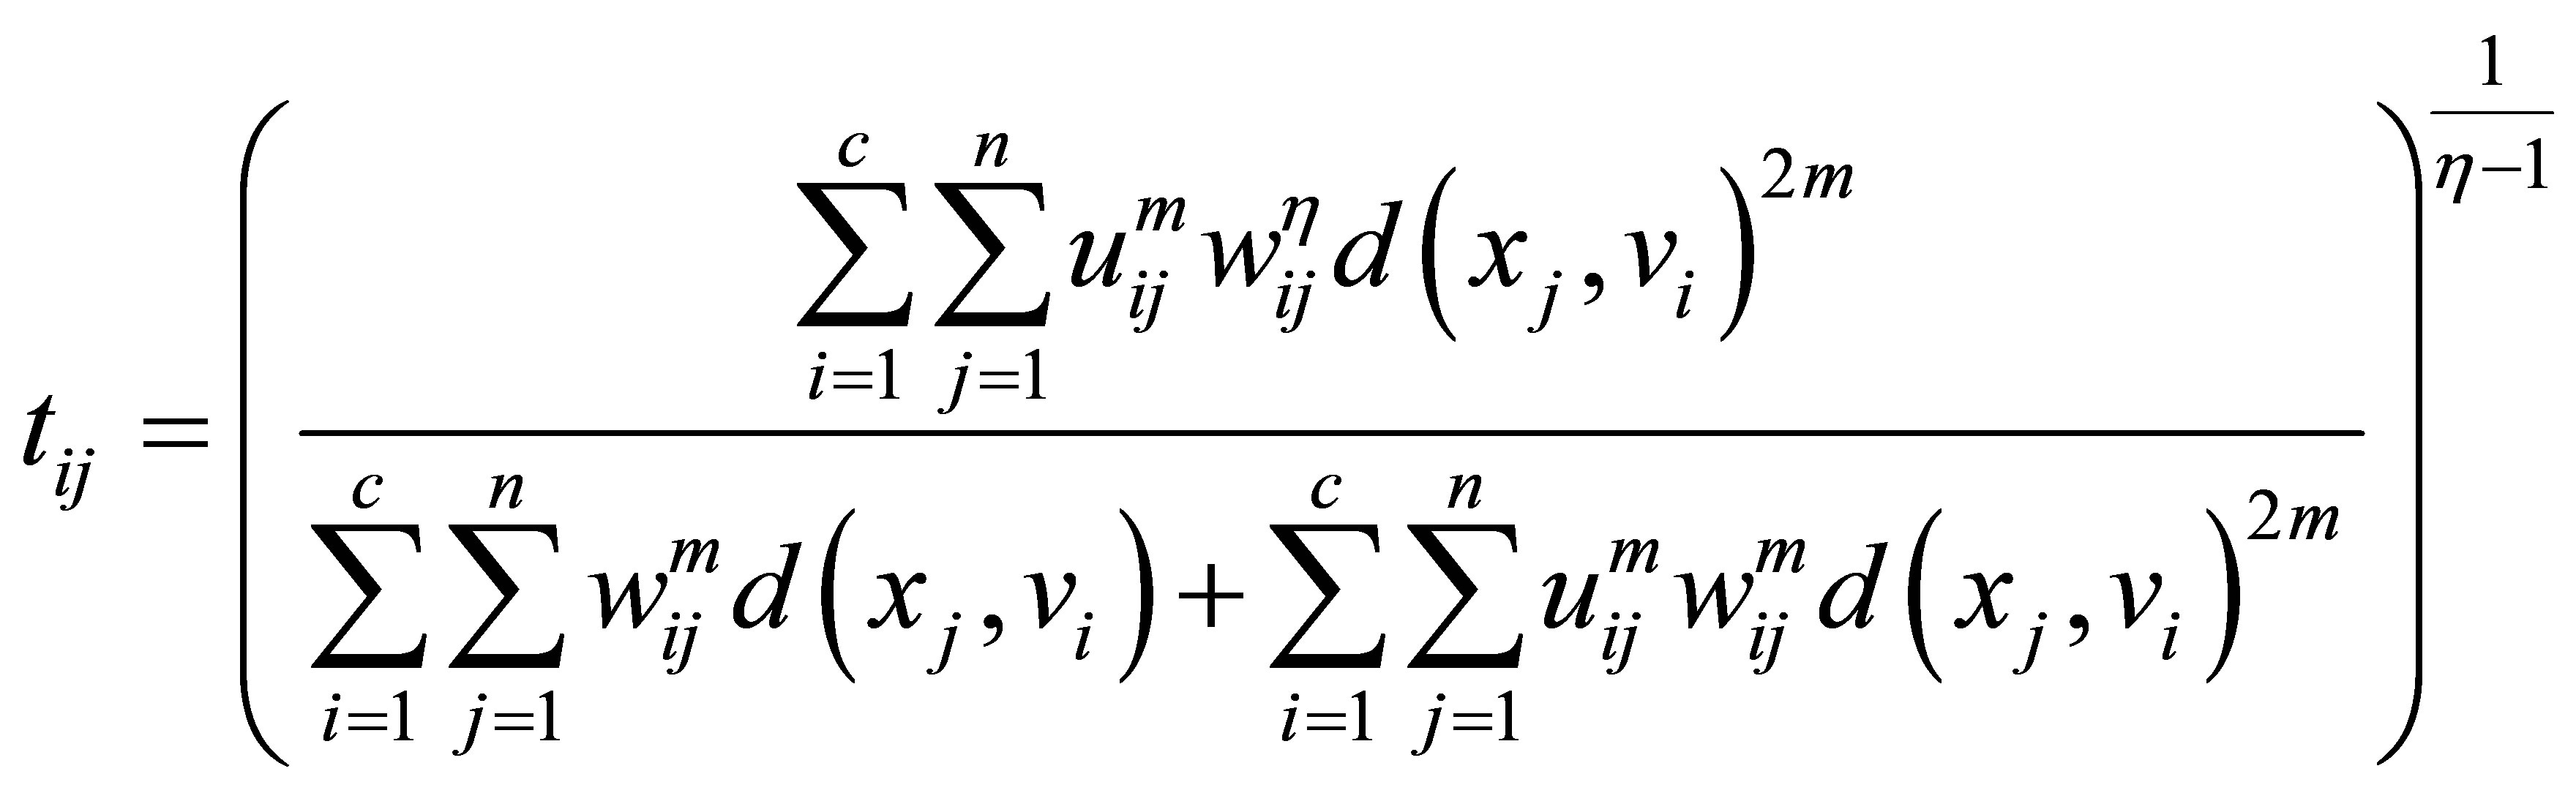
5) Update membership function tij using Equation (31)
6) Update cluster center vi using Equation (32)
7) Repeat steps 3 to 6 until termination , where “t” is the iteration steps,
  is the Euclidean distance norm.
8) Stop
4. Experimental Results
The experiments were performed on three different sets T1-weigthed and T2-weighted MRIs: in the first test, we used T1-weigthed and T2-weighted at various noise levels (0%, 3%, 7% and 9%) and radio frequency (RF) levels (0% and 20%) as shown in Figure 1. T1-weigthed corrupted by 6% salt and pepper noise and the image size is 129 × 129 pixels [30] (see Figure 2) is used in the next. The third set includes simulated volumetric MRI consisting of ten classes as shown in Figure 3. The advantages of using digital phantoms rather than real image data for soft segmentation methods include prior knowledge of the true tissue types and control over image parameters such as modality, slice thickness, noise, and intensity in homogeneities. Through our implementation, we set the following parameters: m = 2, ε = 0.0001 and . The quality of the segmentation algorithm is of vital importance to the segmentation process. The comparison score S for each algorithm as proposed in [31] is defined as follows:
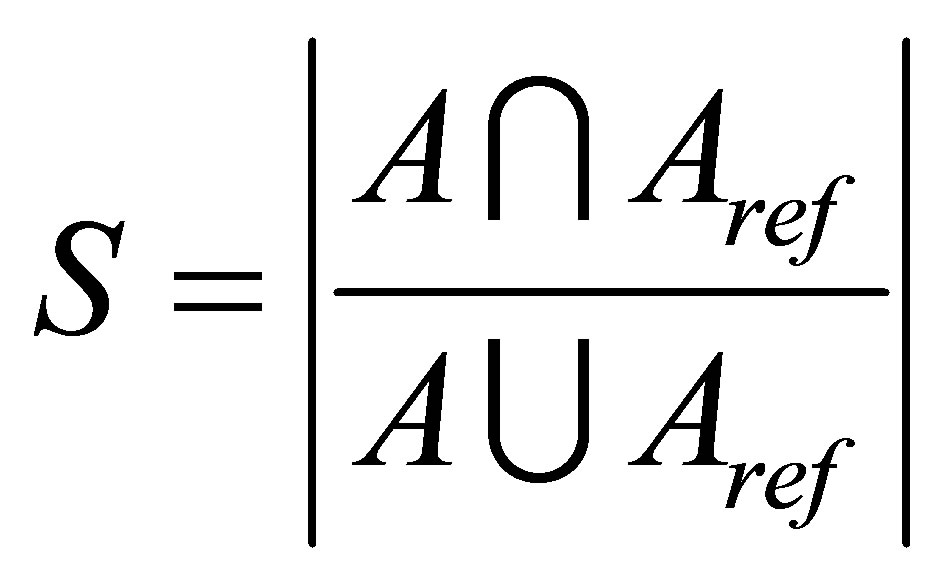 (33)
(33)
where A represents the set of pixels belonging to a class as found by a particular method and  represents the
 (a)
(a)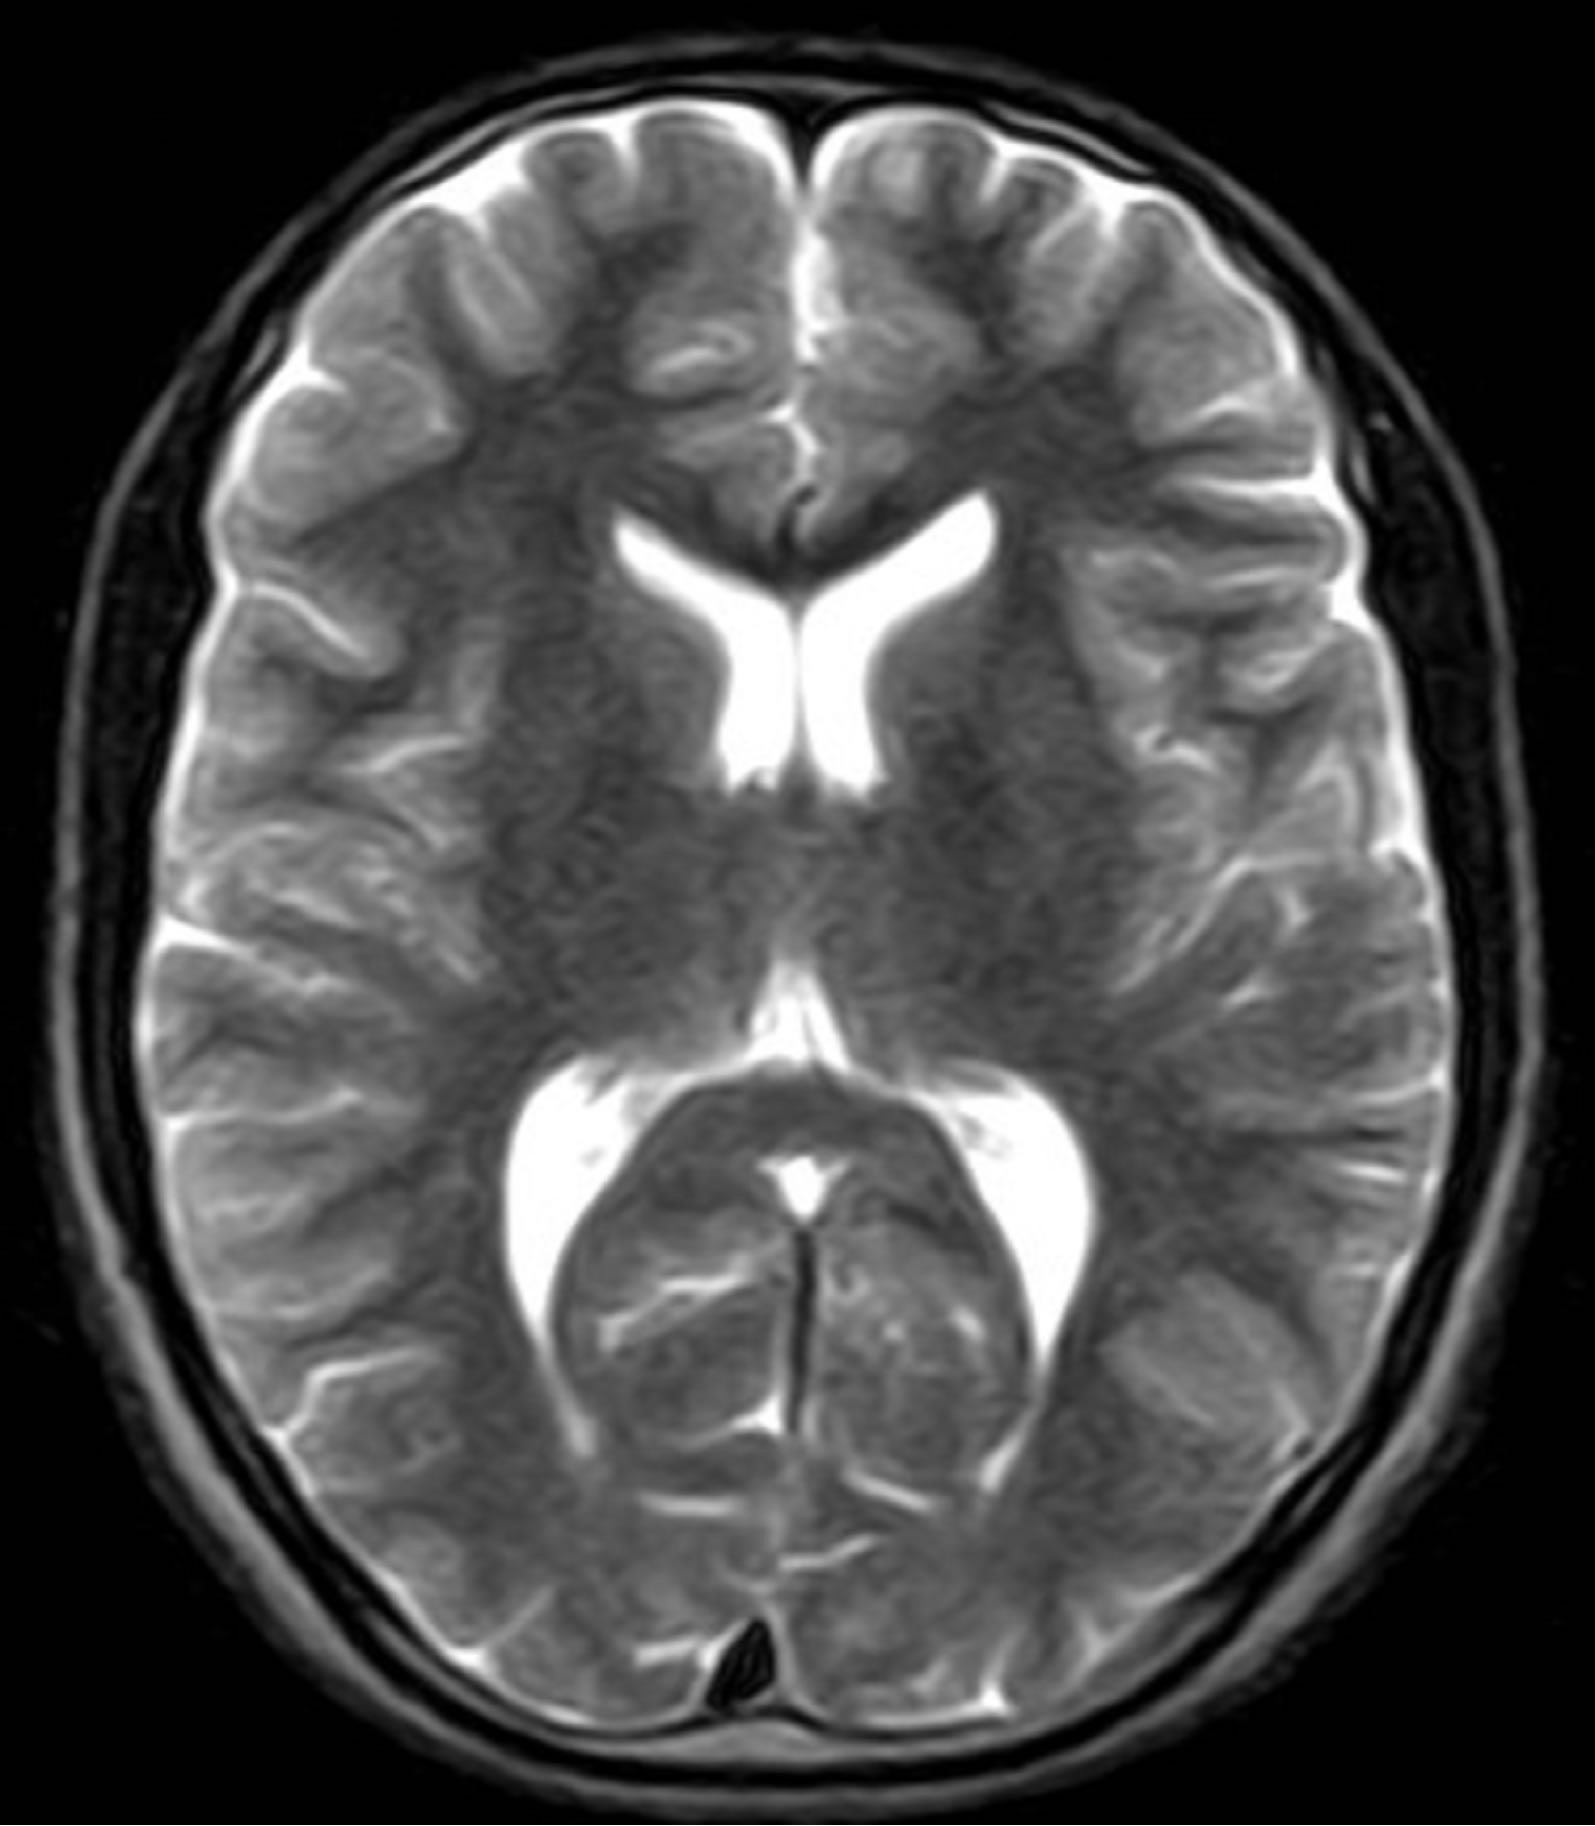 (b)
(b)
Figure 1. MRI image: (a) Original T1-weigthed, (b) Original T2-weigthed.
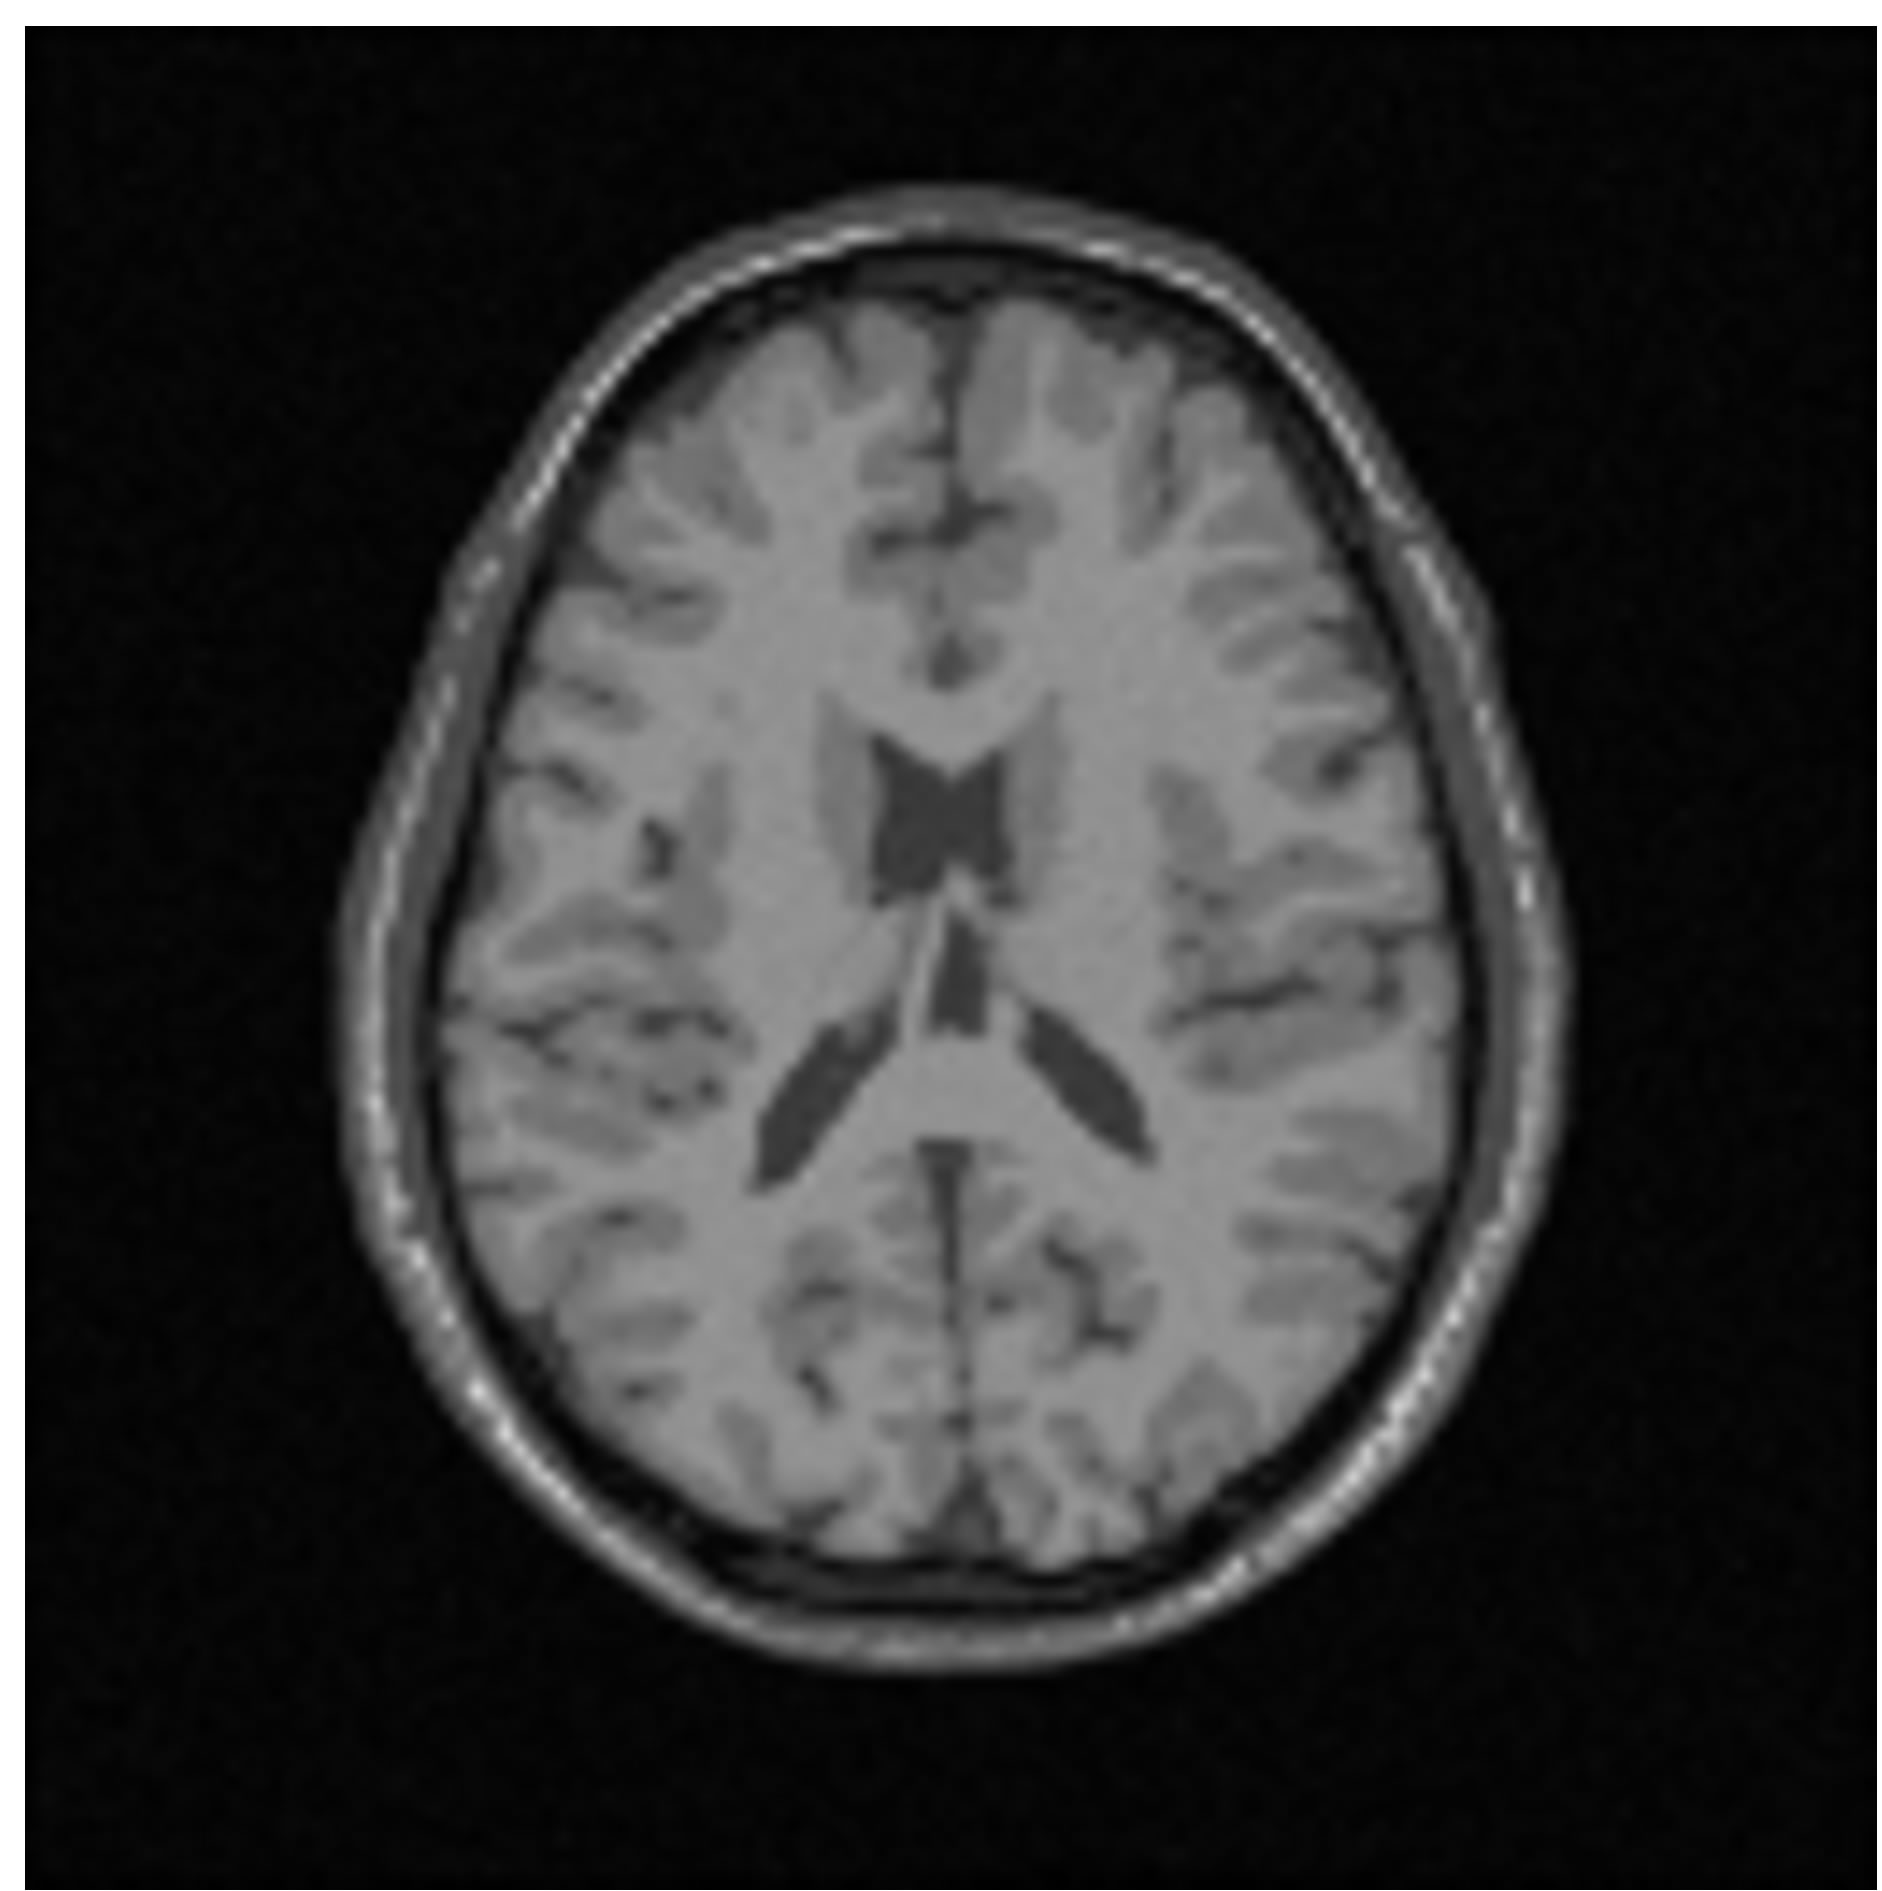
Figure 2. Original T1-weigthed (slice 91).
reference cluster pixels.
4.1. Noisy T1-Weigthed and T2-Weighted MRI
The proposed technique is applied to T1-weigthed and T2-weighted MRI [32] (as shown in Figures 1(a) and (b)) at various noise levels (0%, 3%, 5% and 9%) and RF levels (0% and 20%). To prove the efficiency of proposed algorithm, several noise levels are added to these data sets, while S (Equation (33)) is evaluated for each segment in T1-weigthed and T2-weighted. Figure 4 shows the segmentation output of T1-weigthed and T2-weighted MRI at noise levels (0%, 3%, 5% and 9%) and RF levels (0% and 20%). The average of segmentation accuracy scores (average) for each image is indicated in Table 1. Suppose we have an image containing v segments, the accuracy scores can be computed from: 
Table 1 describes the average of the proposed method when applied to the test images. For example in Figure 4 when noise = 0% and RF = 0%, average is equal to 0.98% and 0.95% for T1-weigthed and T2-weighted MRI respectively. The obtained results show that the proposed algorithms are very robust to noise and intensity homogeneities and inhomogeneities. According to Zijdenbos [32] statement that average > 0.7 indicates excellent agreement; the proposed algorithm has desired performance in cortical segmentation.
The best average is achieved for low noise and RF levels, for which values of average are higher than 0.94. According to Table 1, the proposed technique is stable at 88% at noise level 9% and RF 20%, this result is satisfactory for segmenting the weak boundary tissues.
4.2. T1-Weighted MRI Phantom
We used a high-resolution T1-weighted MRI (with slice thickness of 1mm, 6% noise and RF 20%) obtained from the simulated brain database of McGill University [32] (see Figure 2). In this test, beside evaluating the proposed method and the most recent fuzzy c-means such as: Pal et al. [26], Wang et al. [22], Rajendran and Dhana-
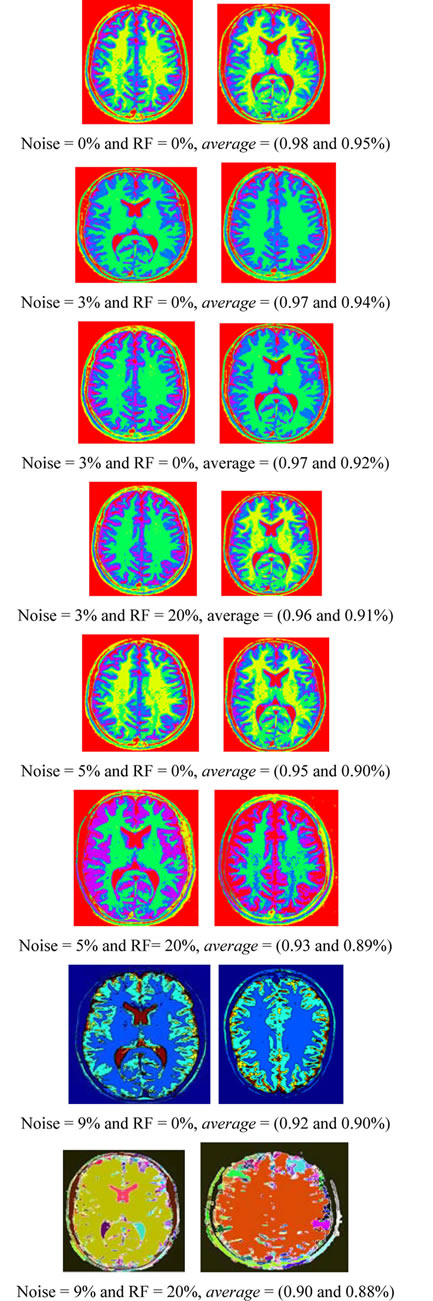
Figure 4. The segmentation results of T1-weigthed and T2-weighted MRI.
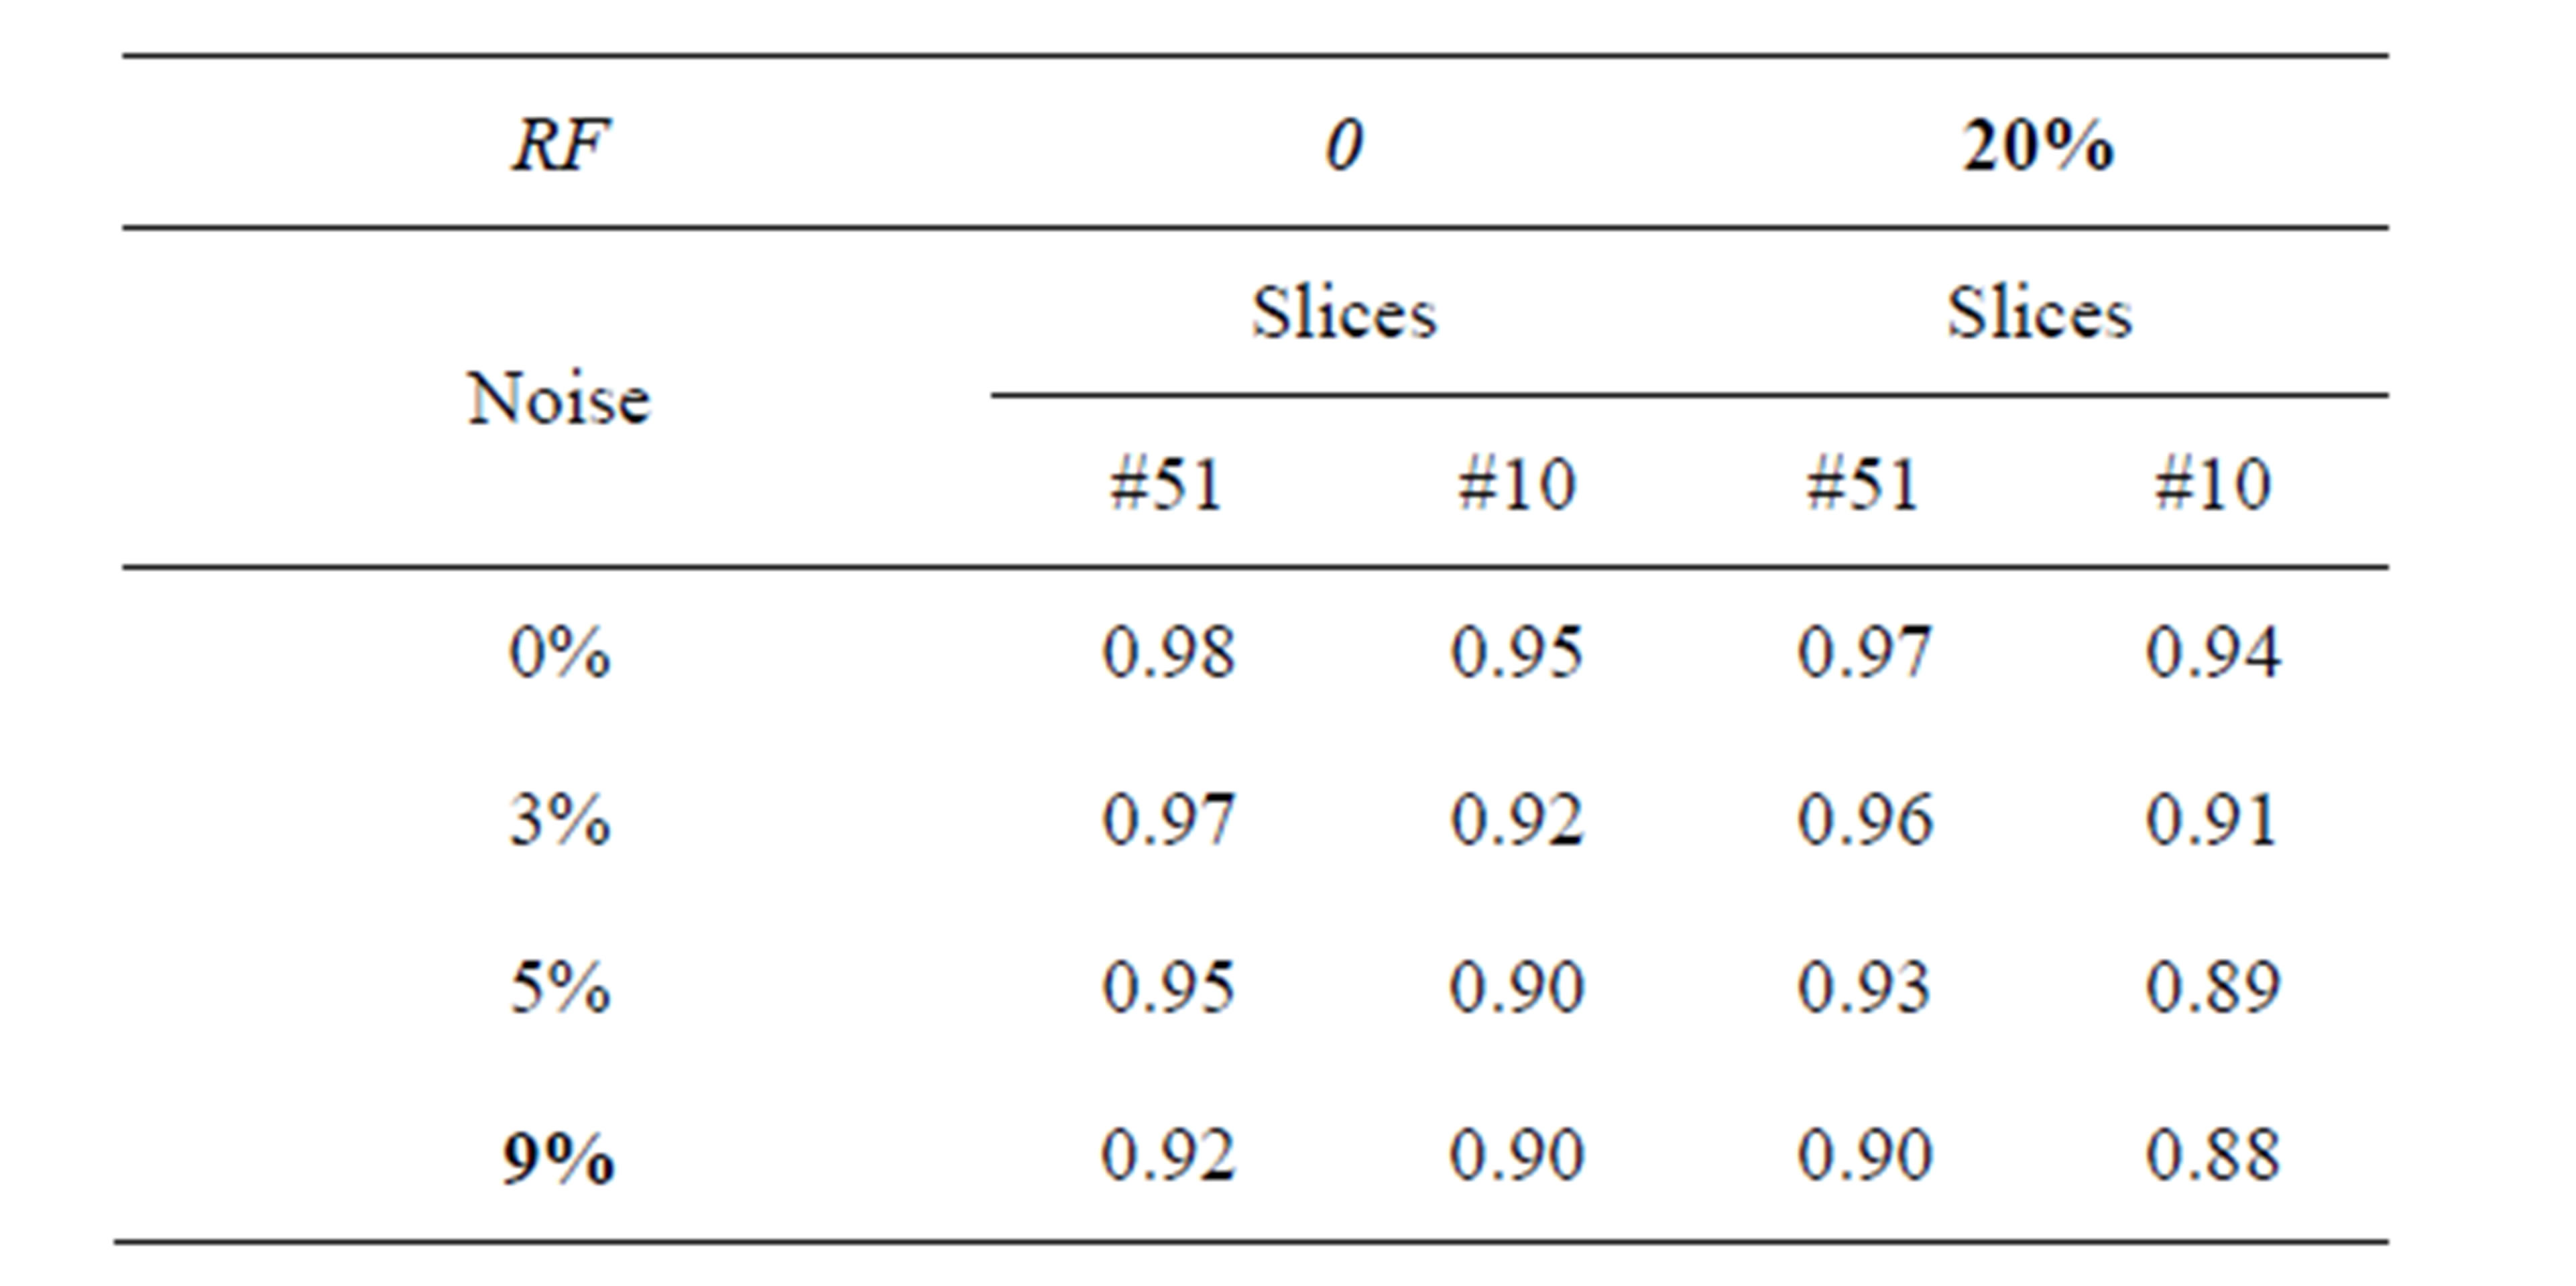
Table 1. The segmentation average of slices (T1-weigthed and T2-weighted MRI) with different situations of noise level and intensity non-uniformity (RF).
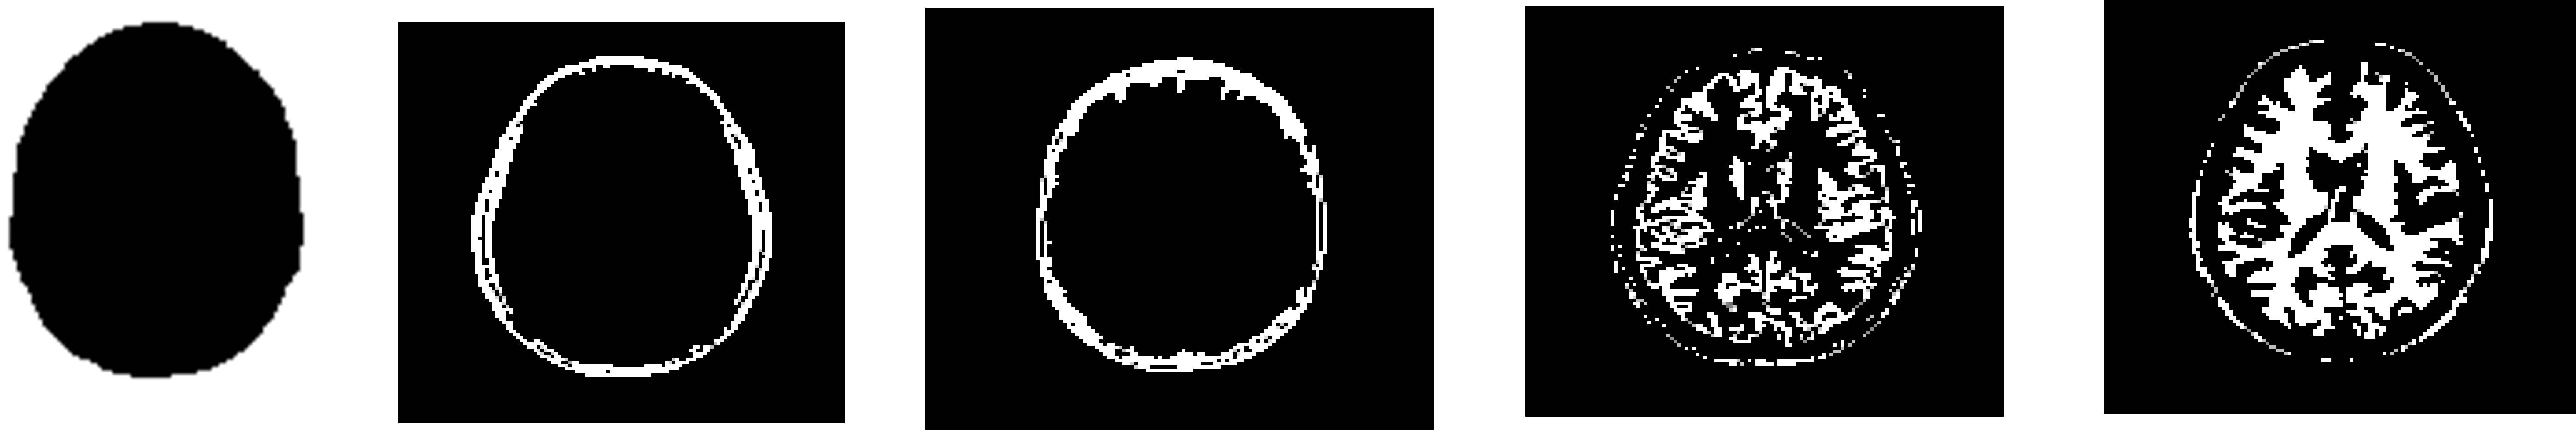
sekaran [24] and Zanaty and Aljahdali [11] are implemented and applied on the test image to prove the efficiency of the proposed method. Five segments as shown in Figures 5-9 are obtained after applying these methods to this image. Evaluating the accuracy of the existing methods and the proposed method is shown in Table 2. Obviously, the proposed method acquires the best segmentation performance. The proposed method appears to be stable and achieve better performance than Pal et al. [26], Wang et al. [22], Rajendran and Dhanasekaran [24] and Zanaty and Aljahdali [11] by factor 12%, 8%, 7%, and 3% respectively.
4.3. Simulated MR Data
In this section, we experiment the proposed method and some existing methods such as: Pal et al. [26], Wang et al. [22], Rajendran and Dhanasekaran [24] and Zanaty and Aljahdali [11] when applied to the nine classes (slices# 51-59) from 3D simulated data (see Figure 3). Table 3 shows the corresponding accuracy scores (%) of the proposed and the existing methods for the nine classes. Obviously, the FCM gives the worst segmentation accuracy for all classes, while other methods give satisfactory results. On the other hand, the method of Pal et al. [26], Wang et al. [22], Rajendran and Dhanasekaran [24] and Zanaty and Aljahdali [11] acquire the good segmentation performance in case of classes 9, 3, 4, and 8 respectively. Overall, the proposed method is more stable and achieves much better performance than the others in all different classes even with misleading of true tissue of validity indexes.
5. Conclusion
This paper has presented a new approach called possiblsistic fuzzy c-means (PFCM) which combines FCM and PCM to overcome the weakness of both methods. The proposed algorithm is formulated by modifying the objective function of PCM algorithm to allow the labeling of a pixel to be influenced by other pixels and to suppress the
 (a) (b) (c) (d) (e)
Figure 5. Results of segmentation using Pal et al. [26].
 (a) (b) (c) (d) (e)
Figure 6. Results of segmentation using Wang et al. [22].
 (a) (b) (c) (d) (e)
Figure 7. Results of segmentation using Rajendran and Dhanasskaran method [24].
 (a) (b) (c) (d) (e)
Figure 8. Results of segmentation Zanaty and Ajahdali [11].
 (a) (b) (c) (d) (e)
Figure 9. Results of segmentation using the proposed method.
noise effect during segmentation. To prove the efficiency of the proposed algorithm in segmenting the MRI images, the proposed algorithm has been applied to different data sets. The first set includes T1-weigthed and T2-weighted MRI at noise levels (0%, 3%, 5%, 7%, and 9%) and RF levels (0% and 20%). We have noted that the proposed algorithm succeeded to segment noisy MRI images (at noise levels from 0% to 9% and RF levels from 0% to 20%). The accuracy average of output segmentation of T1-weigthed and T2-weighted MRI shows excellent performances exceeding 88% for complex image structures. Next test, we have experimented the proposed algorithm using T1-weigthed MRI with 6% noise while the score accuracy of each segment is evaluated. The superiority of

Table 2. Accuracy of the segmentation results.

Table 3. Segmentation accuracy (%) of the proposed and the existing methods on brain classes.
the proposed algorithm is demonstrated by comparing its performance against the existing Pal et al. [26], Wang et al. [22], Rajendran and Dhanasekaran [24] and Zanaty and Aljahdali [11]. The proposed method achieves better performance than Pal et al. [26] by factor 12%, Wang et al. [22] by factor 7%, Rajendran and Dhanasekaran [24] by factor 8% and Zanaty and Aljahdali [11] by factor 3%. In addition, for the simulated 3D data (brain volume consists of ten slices), the average accuracy of the proposed algorithm have been evaluated and compared to Pal et al. [26], Wang et al. [22], Rajendran and Dhanasekaran [24] and Zanaty and Aljahdali [11]. We have noted that the average accuracy of the proposed method gave an improvement about 12%, 8%, 6%, and 7% over Pal et al. [26], Wang et al. [22], Rajendran and Dhanasekaran [24] and Zanaty and Aljahdali [11] respectively.
Future research in MRI segmentation should strive toward improving the computation speed of the segmentation algorithms. This is particularly important as MRI imaging is becoming a routine diagnostic procedure in clinical practice. It is also important that any practical segmentation algorithm should deal with 3D volume segmentation instead of 2D slice by slice segmentation, since MRI data is 3D in nature.