Molecular Dynamics of Free and Graphite-Supported Pt-Pd Nanoparticles ()
1. Introduction
The use of metal nanoparticles is considerably more common than it was just a few years ago, and this tendency is mainly due to two different but related reasons: the refinement of the synthesis methods that have made possible the improvement in the production of nanoparticles on a large scale with a good degree of control [1], and a better knowledge of the relationships between physicochemical and structural properties [2]. It is common now to find metal nanoparticles playing an active role as components in catalysts [3], but also as parts of electronic components, systems for the detection of proteins [4], contrast enhancers in imaging techniques [4], in drug delivery [5], and as antiviral agents [6]. As the demand for more precise properties keeps growing, the need for better knowledge of these function/structure relations becomes a more strategic issue. In this context, the case of bimetallic nanoparticles is particularly relevant. Some bimetallic nanoparticles are known to have a greater catalytic activity compared with catalysts based on a single metal, and the structural, optical and mechanical properties can be dramatically changed when two metals are composing the particle at a particular relative concentration [7].
Palladium and platinum particles are good catalysts for hydrogenation [8,9]. Platinum-palladium nanoparticles are used as elements of electrocatalysts of gas diffusion electrodes [10], as well as for the detection of formaldehyde [11], while the enhancement of electro-oxidation of formic acid for Pd adsorbed on Pt (100) single crystal surfaces has been reported by several groups [12,13]; this enhancement is likely due to the presence of single crystalline surfaces of low Miller indices in the cubic particles, but the presence of Pd absorbed on the (100) Pt surfaces lowers the oxidation rate [12,13]. This is a clear example of how the interplay between structure and local elemental distribution greatly determines the catalytic properties of a nanoalloy.
In this paper, we describe a study based on Molecular Dynamics (MD) simulations of the thermal behavior of cubic Pd-Pt nanoparticles. Previous MD studies by Sankaranarayanan et al. [14,15] of these nanoalloys have predicted a two-stage melting scenario, in a similar manner to the melting of gold-palladium nanoparticles [16], and differences in the melting transition temperatures of supported clusters as high as 200 K when compared against unsupported clusters. These previous MD simulations are characterized for a very careful and wellthought out preparation of the initial configurations, by using a set of Monte Carlo simulations where the bond order simulation model is employed. In this paper, we have decided to take an alternative approach, and to use cubic particles with a randomized distribution of Pd and Pt atoms as initial configurations. This choice rests on the rationale of allowing the study to focus on the role of the graphite substrate in the dynamics of the system, in situations where the particle is trapped in a non-minimum region on the energy landscape, as commonly happens in real synthesis conditions, where it is known that kinetics plays a role as important as energetics.
2. Simulation Details
The initial structure of the bimetallic nanoparticle was built by extracting a 500-atom cubic volume from an fcc arrangement, with a lattice constant corresponding to palladium. Half the atoms were randomly chosen to be identified as platinum atoms. The graphite was modeled as two carbon layers in an ABAB arrangement of dimensions 73.8 × 73.8 × 6.7 Å, for a total of 3600 carbon atoms. For the supported particle configuration, the nanoparticle was placed 2 Å above the graphite surface, with one of its faces parallel to the carbon surface. A graphical representation of the initial configuration is depicted in Figure 1.
The metal-metal atomic interactions were modeled through a quantum Sutton-Chen many-body potential, since it is accepted that this model can successfully predict the properties of fcc metals [17]:

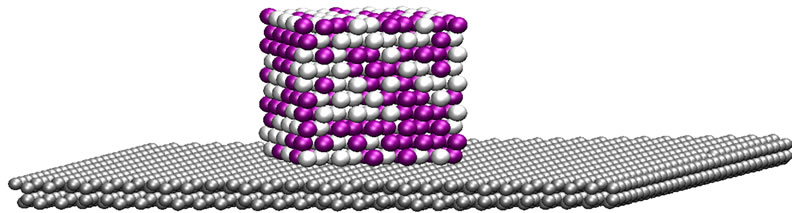
Figure 1. Initial configuration of the cubic Pt-Pd nanoparticle supported on a graphite surface.
where

Here, the parameters m and n are positive integers, ε is a parameter with energy dimensions, a is an fcc lattice constant, and c is an adimensional-positive parameter that fits according to experimental results. The parameters used in our simulations consider quantum corrections [18,19] and are the same as those used in [14]. The Pd-Pt interaction is defined by using the approach proposed by Raffi-Tabar and Sutton [20], as is commonly done in simulations of alloys using Sutton-Chen and other Finnis-Sinclair types of potential. The carbon-metal interactions were modeled using a simple Lennard-Jones potential with the parameters obtained in [15]. The graphite layers were kept rigid during the simulations without periodic boundary conditions, so there was no need to define a carbon-carbon interaction.
Each simulation was performed in the canonical (NVT) ensemble using a Nosé-Hoover thermostat to keep the temperature controlled, with a time step of 1.5 fs for the numerical integration of the equations of motion, using a leap-frog integrator. The set of simulations was constructed by a series of NVT runs, starting with 0 K and increasing the temperature from one run to the next in 100 K increments. In this way, each particle was heated up until it reached a temperature 80 K higher than its own melting temperature. Once the melting point was reached, an additional series of simulations was made around the melting condition using 10 K increments, for a more precise determination of the melting transition. In another set of runs, the starting temperature was set to 300 K, but there were no significant differences with the results of the series started at 0 K. Each simulation was run for 6.0 × 10⁵ total steps, using the first 2.0 × 10⁵ steps to bring the system to thermal equilibrium, making a total dynamics time for each simulation of 900 ps. For the analysis, 500 samples were collected at intervals of 1.8 ps, for averaging purposes, and to make a fair distinction between the different morphologies adopted by the particle as the temperature was varied.
3. Results
The melting temperatures were determined using two different criteria. In the first one, the attention was centered on the variations of the potential energy of the nanoalloy. The results are shown in Figure 2, where the sudden jumps in the caloric curves correspond with the melting transition. As can be seen, prior to the melting transition, both the free and the supported particles experience a change in the tendency of the potential energy curve (around 1000 K for the unsupported particle,

Figure 2. Potential energy variation with temperature. The potential energy includes both the metal-substrate interaction and the metal-metal interaction.
around 1200 K for the supported one). Inspection of the configurations at these states makes clear that these changes of slope in the caloric curves are due to structural modifications on the surface of the particles. It is notable that these modifications are delayed for almost 200 K by the effect of the interaction of the particle with the carbon substrate, considering that the interaction energy of the metal-substrate interaction is at least two orders of magnitude lower than the metal-metal interaction. Once the modifications are present on the supported particle, the main modifications on the particles are noted on the area in direct contact with the carbon substrate, where a migration of Pd atoms was detected, as will be discussed in the next paragraphs.
The second criterion to localize the melting temperatures is monitoring the variation of the heat capacity, defined as
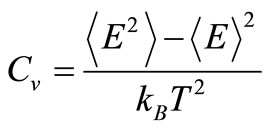
to find the conditions where Cv becomes undetermined. The resulting curves are shown in Figure 3. The results are consistent with those found using the caloric curves. The melting temperatures were 1320 ± 10 K for the free nanoparticle, and 1490 ± 10 K for the graphite-supported nanoparticle. Both temperatures are appreciably lower than the melting transition temperature for bulk Pd50Pt50 alloys, which is reported to be around 1935 K, while the reported melting temperatures for bulk Pd and Pt are 1828 K and 2042 K, respectively [21]. In the graphitesupported nanoparticle, a sharp rise in the value of Cv occurs at 200 K; this change is likely due to a slight change in the interatomic distances of the metal atoms close to the substrate in order to have a better match with the carbon lattice; this interpretation is reinforced if it is considered that the order parameter analysis, to be de-
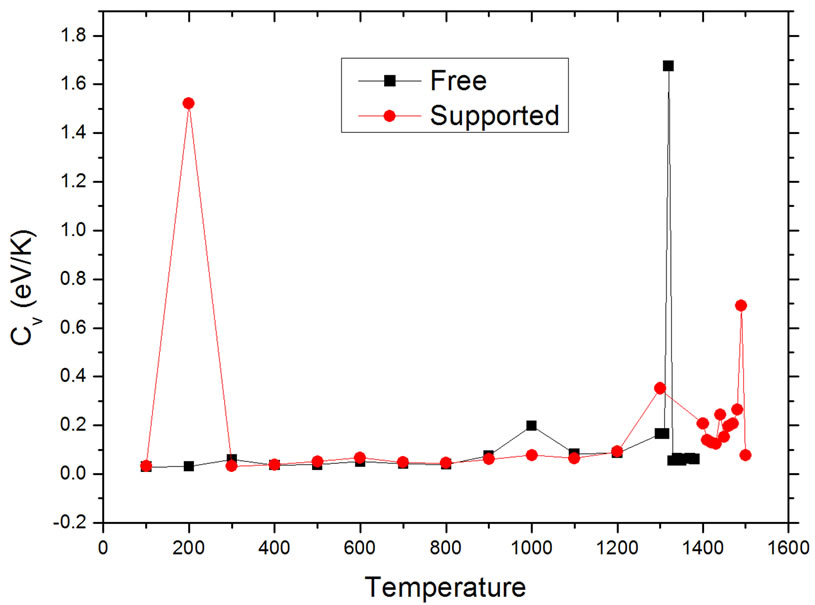
Figure 3. Dependence of heat capacity on temperature in unsupported (squares) and supported (dots) particles.
scribed in more detail in the next paragraphs, shows no large rearrangements in the structure of the nanoparticle.
To investigate the structural behavior of the clusters during the heating processes, we calculated the global order parameter Q6, which is defined as

where

N is the total number of atoms in the particle, Nnb(i) is the number of first neighbors for the i-th atom, and q6m(i) measures the local order around the i-th atom considering the average of the spherical harmonics Y6m of the bonds with the Nnb(i) neighbors:

Defined in this way, the order parameter Q6 becomes a fair criterion to identify the resulting structures of the heating process, because a specific structure is characterized by a well-defined value of Q6: a perfect fcc structure gives a value Q6fcc = 0.575, whereas an icosahedron gives Q6Ih = 0.663, while for melted states, the value of Q6 will drop to values close to zero. This is shown in Figure 4, where the calculated values of Q6 for the nanoparticles at different temperatures are plotted. The initial values of Q6 correspond to an fcc structure, but as the temperature increases this value diminishes in a slow but steady fashion, until the behavior is suddenly changed, at temperatures that coincide with the changes in the behavior

Figure 4. Variation of the bond orientational order parameter with temperature.
on the caloric curves shown in Figure 2.
This peculiar feature that can be easily noted in the behavior of Q6 at around 1000 K in the supported particle. This abrupt rise in the value of Q6 is directly related to a structural change in the particle that could be followed by inspecting the configurations in the dynamics trajectory. The structural change was abrupt and difficult to characterize, but it is likely that it is analog to the pre-melting restructuration that has been reported in simulation results for other metal nanoparticles [16,22-24].
We used density profiles ρ(z) to examine the atomic distribution of Pt and Pd atoms during the melting process for the supported-graphite nanoparticle along the zaxis perpendicular to the surface. The definition that we used for ρ(z) for a particular metal is the one given in [25]:

n(z) is the number of atoms of the same metal element in a slice of width Δh parallel to the xy plane of graphite; Axy is the surface area of the graphite xy plane, and Ns is the number of samples considered for the calculation. Δh was set to 0.017 Å.
Figure 5 shows the atomic distribution of Pt and Pd at three different temperatures. The sharp and well-differentiated peaks in the density distribution of both elements are evident below the melting temperature. As the temperature is increased to values higher than the melting temperature Tm, the series of broad maxima characteristic of a liquid state appear. At the higher value of T, 1520 K, the density profile peaks become very small, evidencing that the particle has completely changed its shape, now occupying a larger area on the substrate. At both temperatures above Tm, the peaks corresponding to Pd are higher than those of Pt in the direct vicinity of the


Figure 5. Density profiles at different temperatures. Top: 300 K. Center: 1470 K. Bottom: 1520 K.
carbon substrate, but also at the opposite end of the particle, at a distance of around 16 Å from the substrate. This corresponds with a situation where, after the melting of the particle, the palladium atoms migrate to the surface of the particle, and this trend is more evident at the surface in contact with the carbon, where the particle has the only remaining flat and large surface.
4. Conclusion
We have studied the dynamics of palladium-platinum nanoparticles in a heating process until the system reaches the melting condition. We have compared the melting process in an unsupported particle, against that of a particle supported in a graphite substrate. Our results indicate that in the supported particle, a local rearrangement of metal atoms in the vicinity of the carbon substrate occurs in such a way that the metal lattice has a better match with the carbon substrate. This rearrangement, although affecting only very slightly the ordering in the nanoalloy, is easily identifiable by the monitoring of the heat capacity as a function of T. The analysis using bond-orientational order parameter and density profiles confirms that there is a reordering of the structure prior to the melting condition, and that after the supported particle melts, Pd atoms migrate to preferentially occupy the region in direct contact with the carbon substrate.
5. Acknowledgements
This work was supported by the Mexican Council for Science and Technology (CONACYT, Mexico), through the project CIAM 148967. Support from UANL, through the project PAICYT CE820-11 is also acknowledged.